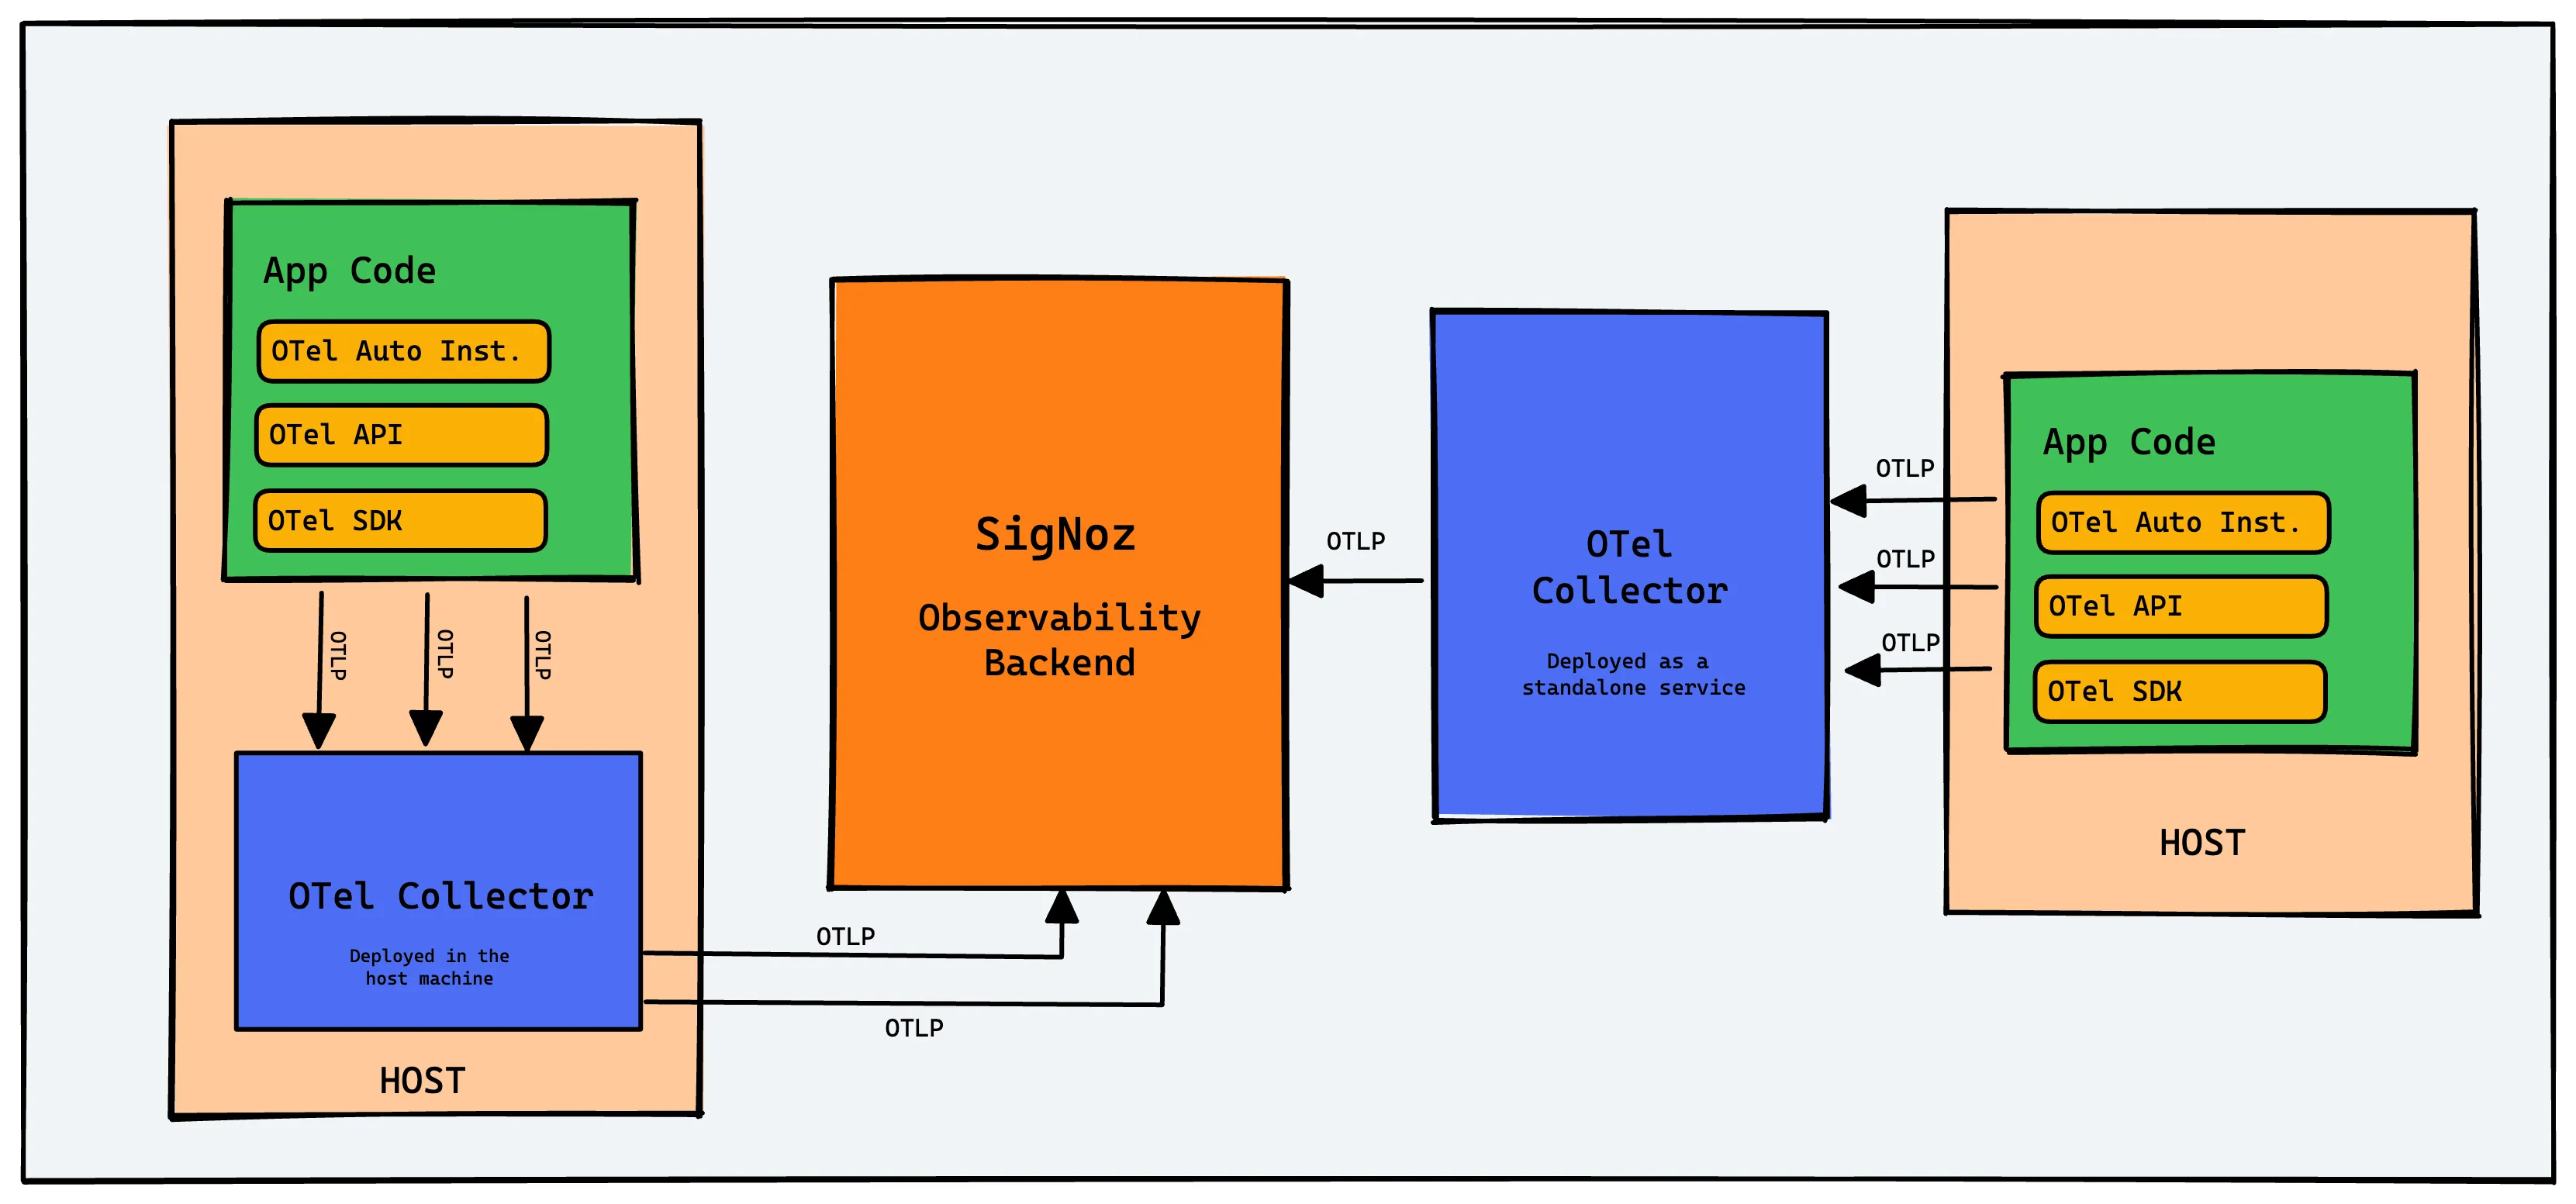
The OpenTelemetry Collector is a stand-alone service that acts as a powerful, vendor-neutral pipeline for your telemetry data. It can receive, process, and export logs, metrics, and traces, giving you full control over your observability data before it reaches a backend.
This guide will provide a comprehensive overview of the OpenTelemetry Collector, its architecture, deployment patterns, and how to configure it for production use.
What is OpenTelemetry?
OpenTelemetry is an open-source observability framework, incubated by the Cloud Native Computing Foundation (CNCF), that standardizes how telemetry data (logs, metrics, traces) is generated and collected. After instrumenting your applications with OpenTelemetry SDKs, the Collector is the next critical piece for managing that data.
Why Use an OpenTelemetry Collector?
Using a Collector is a best practice for several key reasons:
- Vendor Agnostic: Easily switch or send data to multiple backends (e.g., SigNoz, Prometheus, Jaeger) by changing the collector configuration, not your application code.
- Data Processing & Enrichment: Clean, modify, and enrich data before it's exported. This can involve removing sensitive information (PII), adding metadata, or reducing cardinality.
- Reduces Application Overhead: The Collector handles batching, retries, and compression, offloading this work from your application and simplifying your instrumentation.
- Centralized Management: Manage telemetry routing and processing for all your services from a central point.
- Host Metrics: An agent-based collector can automatically gather system-level metrics like CPU, memory, and disk usage.
Collector Architecture: Receivers, Processors, Exporters
The Collector's functionality is defined by pipelines, which are composed of three types of components:
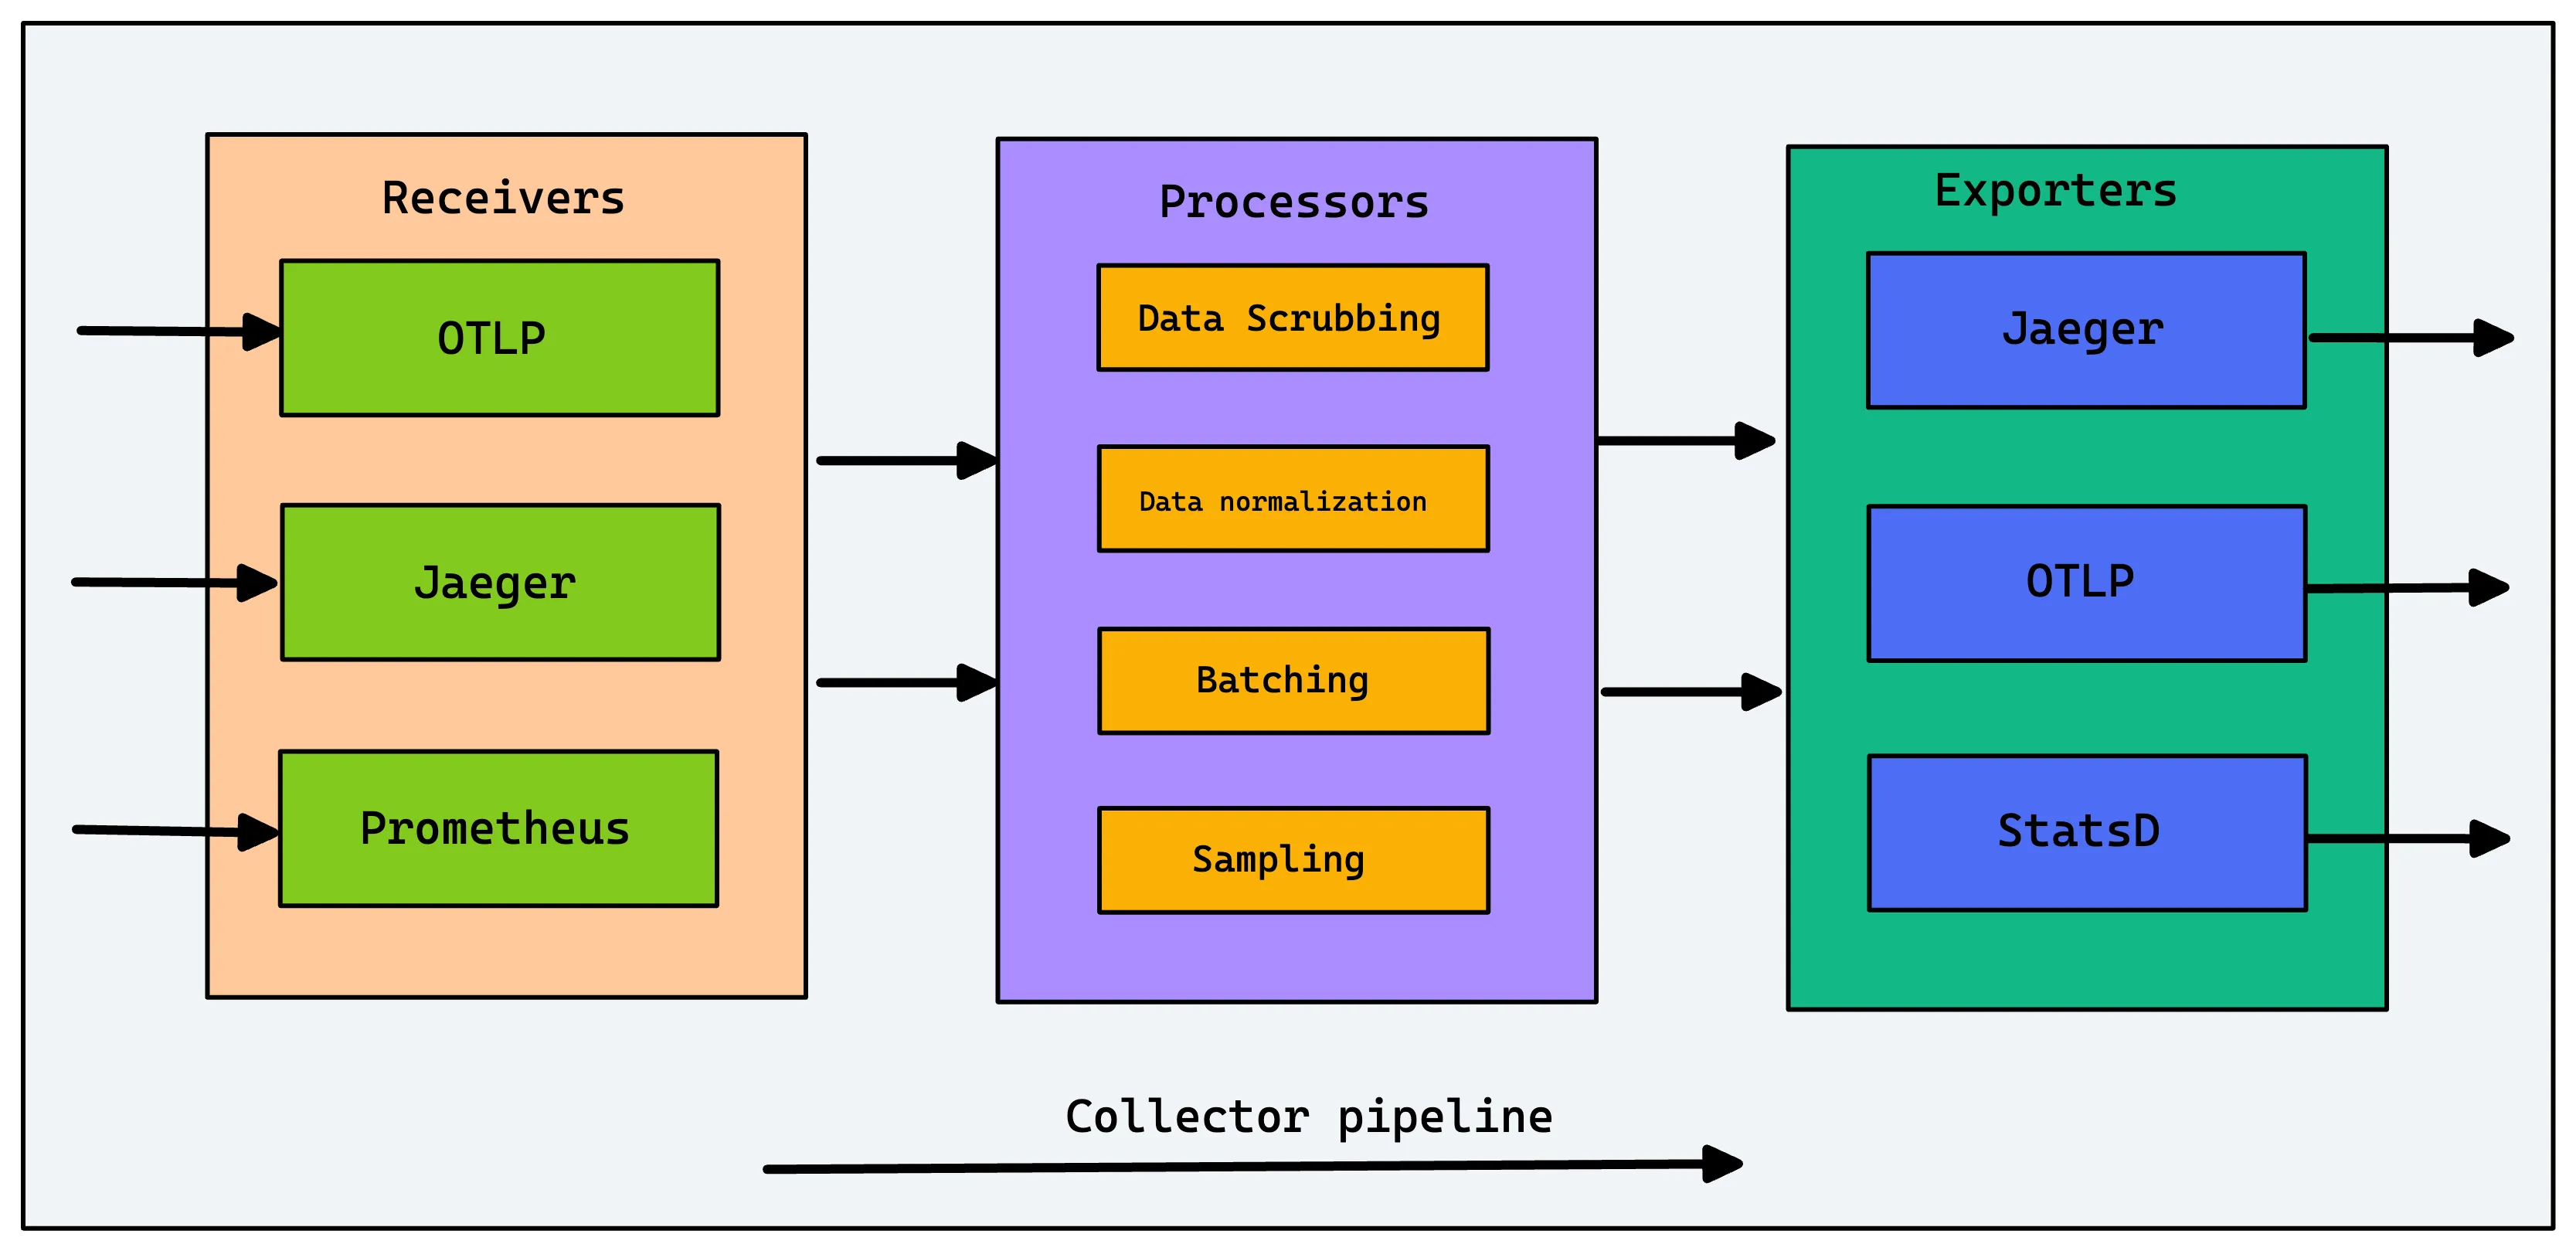
Receivers
Receivers are how data gets into the Collector. They can be push-based (listening for data on an endpoint) or pull-based (scraping a target). A single collector can have multiple receivers for different formats, such as:
- OTLP (OpenTelemetry Protocol): The native and recommended protocol.
- Jaeger: For trace data in Jaeger formats.
- Prometheus: To scrape Prometheus metrics endpoints.
Processors
Processors transform the data as it flows through the pipeline. This is one of the most powerful features of the Collector. Common processors include:
- Batch Processor: Groups telemetry into batches for more efficient export.
- Memory Limiter Processor: Prevents the Collector from consuming too much memory and crashing.
- Attributes Processor: Adds, modifies, or deletes attributes (metadata) on spans, logs, or metrics.
- Tail Sampling Processor: Samples traces based on decisions made after all spans for a trace have arrived.
Previously, a queued_retry processor was used to handle retries and queuing. This functionality is now built into most exporters, which is the recommended approach. You can configure retry_on_failure and sending_queue directly on the exporter to prevent data loss.
Exporters
Exporters send the processed data to a destination. This can be an observability backend like SigNoz, an open-source tool, or even another Collector. You can configure multiple exporters to send the same data to different backends or send different signals (e.g., traces to SigNoz, metrics to Prometheus) to different places.
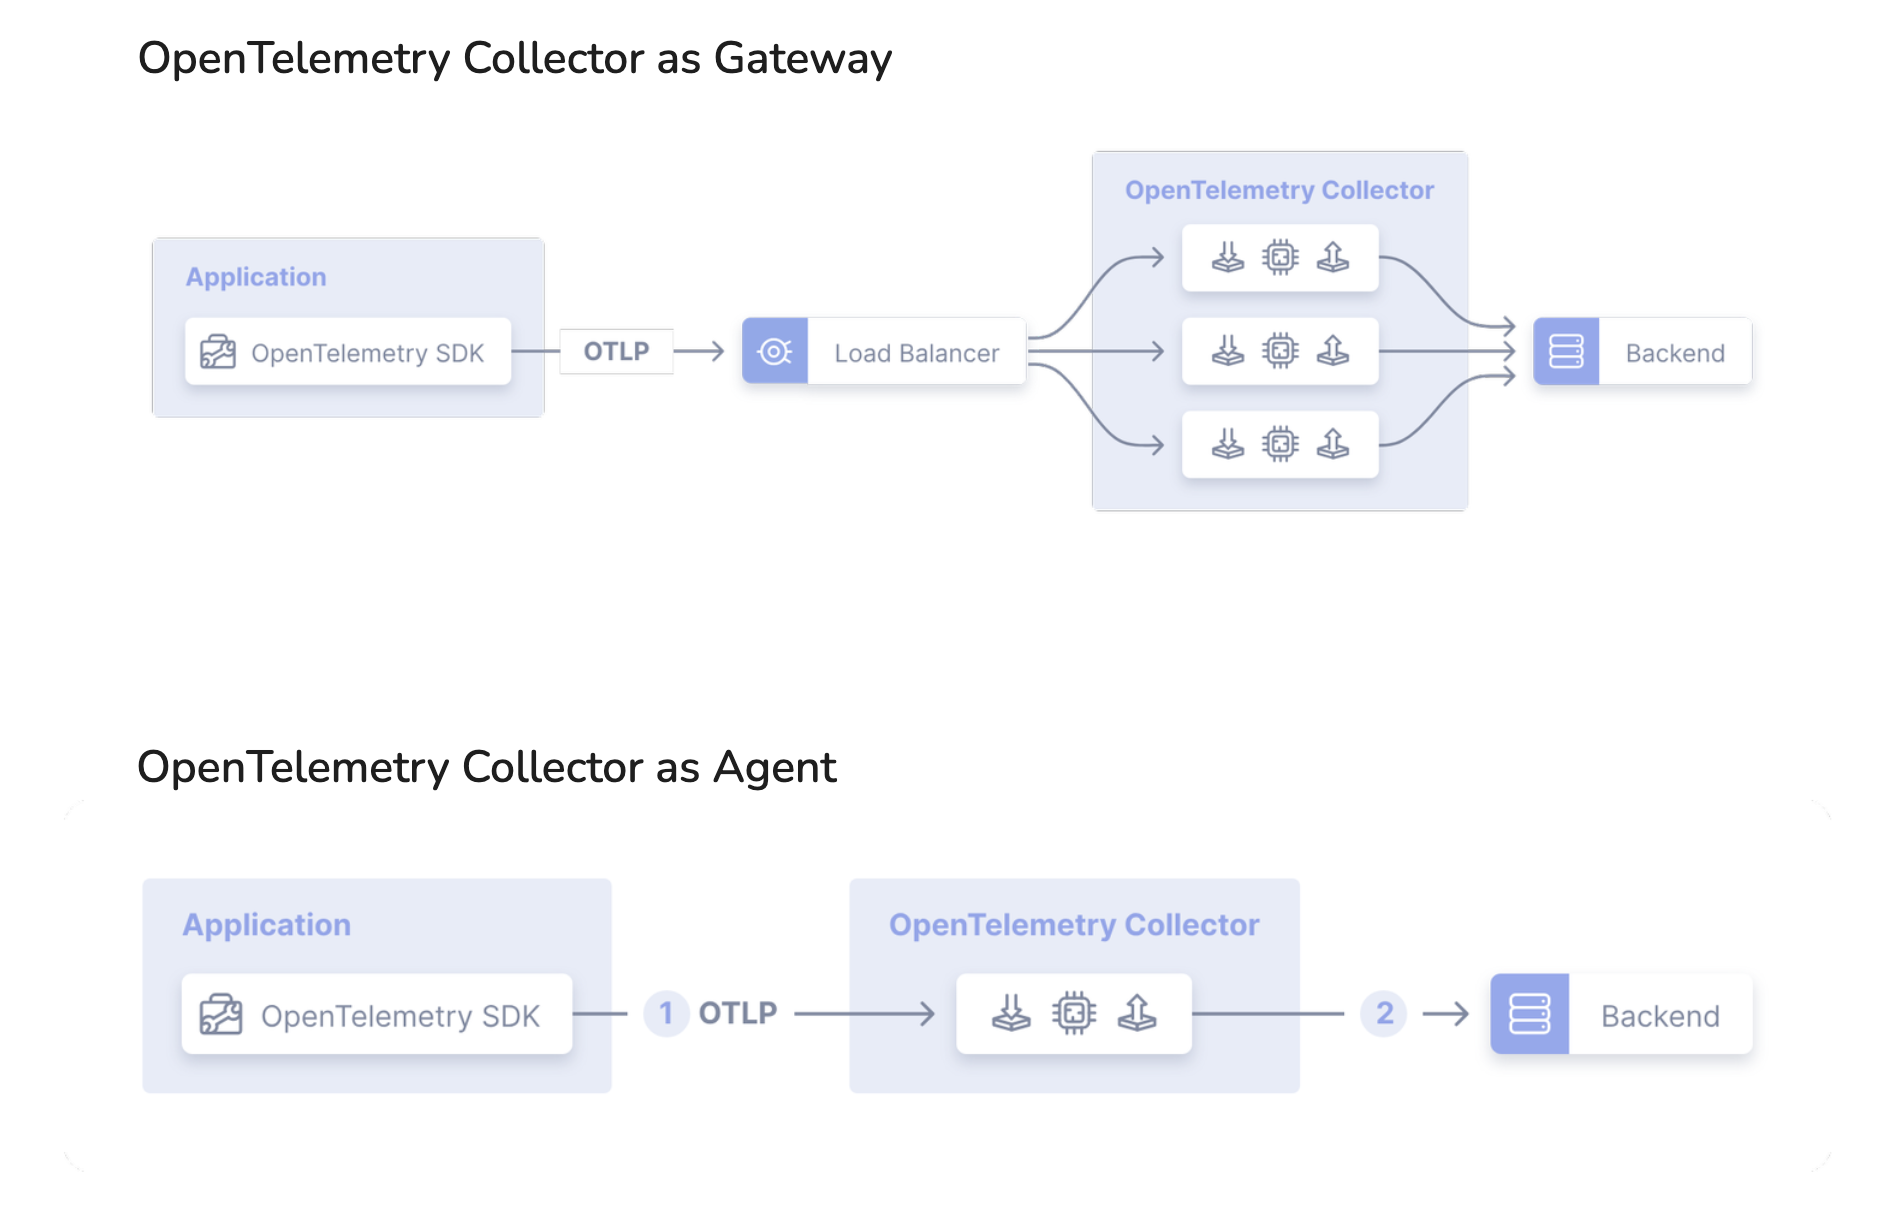
Deployment Patterns: Agent vs. Gateway
There are two primary patterns for deploying the Collector. Choosing the right one depends on your scale and requirements.
| Pattern | Description | Pros | Cons |
|---|---|---|---|
| Agent | A Collector instance is deployed on the same host as the application (e.g., as a sidecar in Kubernetes or a local process). | - Enriches data with host-level metadata. - Collects host metrics (CPU, memory). - Can perform early filtering/sampling. | - Higher resource consumption across all hosts. - Managing many individual configs can be complex. |
| Gateway | A standalone, centralized Collector service (or cluster of services) that receives telemetry from many sources (applications or agents). | - Centralized management of processing and exporting. - Reduces the number of egress points. - Better for heavy, cross-signal processing. | - Single point of failure (requires HA setup). - Cannot easily add host-specific metadata. |
A Hybrid Pattern is very common: Agents are deployed on hosts for local collection and metadata enrichment, and they forward their data to a central Gateway for aggregation, heavy processing, and exporting.
Step-by-Step Configuration Tutorial
Let's build a practical config.yaml for a Collector. For most use cases, it's recommended to start with the otelcol-contrib distribution, as it includes a much wider range of components than the core distribution.
You can run it via Docker: docker run -p 4317:4317 -v $(pwd)/config.yaml:/etc/otelcol-contrib/config.yaml otel/opentelemetry-collector-contrib
Here’s how to build your config.yaml:
Step 1: Define Receivers
We'll accept data using the standard OTLP protocol over gRPC and HTTP.
receivers:
  otlp:
    protocols:
      grpc:
        # Default endpoint: 0.0.0.0:4317
      http:
        # Default endpoint: 0.0.0.0:4318
Step 2: Define Exporters
We'll configure an exporter to send data to SigNoz Cloud. This same OTLP exporter can be configured to send data to any OTLP-compatible backend.
exporters:
  otlp:
    # Replace with your backend endpoint
    endpoint: "ingest.us.signoz.cloud:443"
    headers:
      # Replace with your ingestion key
      "signoz-ingestion-key": "${SIGNOZ_INGESTION_KEY}"
Step 3: Add Processors for Stability and Efficiency
It's a best practice to always include memory_limiter and batch processors.
processors:
  # Prevents the collector from exceeding memory limits
  memory_limiter:
    check_interval: 1s
    limit_mib: 500 # Set based on available memory
    spike_limit_mib: 128

  # Batches data for more efficient export
  batch:
    send_batch_size: 8192
    timeout: 10s
Step 4: Enable Components with Pipelines
Pipelines connect the receivers, processors, and exporters. The order of processors matters: they are executed in the order they are listed.
service:
  pipelines:
    traces:
      receivers: [otlp]
      processors: [memory_limiter, batch]
      exporters: [otlp]
    metrics:
      receivers: [otlp]
      processors: [memory_limiter, batch]
      exporters: [otlp]
    logs:
      receivers: [otlp]
      processors: [memory_limiter, batch]
      exporters: [otlp]
This complete configuration provides a robust starting point for collecting and forwarding telemetry data.
Production Best Practices
Running a Collector in production requires a few more considerations:
- Monitoring the Collector: The Collector can expose its own metrics. Add the
prometheusexporter to themetricspipeline and configure a Prometheus instance to scrape the Collector itself. This helps you monitor ingestion rates, queue sizes, and errors. - Health and Readiness: Use the
health_checkextension to provide a health check endpoint, which is essential for running the Collector in orchestrated environments like Kubernetes. - Data Durability: For critical data, configure the
sending_queueon your exporters to enable disk-based buffering and retries. This prevents data loss if the backend is temporarily unavailable. - Security: Secure communication channels. Use TLS for all gRPC and HTTP receivers and exporters. Ensure any sensitive data in headers or attributes is handled securely.
# Example of adding health_check and self-observability
exporters:
  # ... (your otlp exporter)
  prometheus:
    endpoint: "0.0.0.0:8889"

extensions:
  health_check: {}

service:
  extensions: [health_check]
  pipelines:
    metrics:
      receivers: [otlp]
      processors: [memory_limiter, batch]
      # Export to your backend AND to a local prometheus endpoint
      exporters: [otlp, prometheus]
    # ... other pipelines
Common Telemetry Processing Use Cases
Processors unlock powerful capabilities. Here are a few examples:
- Removing Sensitive Data: Use the
transformprocessor to remove a user's credit card number from span attributes to ensure compliance.processors: transform: trace_statements: - context: span statements: - delete_key(attributes, "credit_card_number") - Enriching Data: Use the
attributesprocessor to add a staticenvironmentattribute to all incoming telemetry.processors: attributes: actions: - key: environment value: "production" action: insert - Reducing Cardinality: Use the
spanprocessor to rename a high-cardinality span name (e.g., involving a user ID) to a generic name.processors: span: name: # From attribute "http.route" from_attributes: ["http.route"]
FAQs
What is the difference between OpenTelemetry Agent and Collector?
They are the same software, just deployed differently. "Agent" refers to a Collector deployed on the same host as an application (the Agent pattern). "Collector" or "Gateway" typically refers to a centralized, standalone Collector service (the Gateway pattern).
What is the difference between OpenTelemetry Collector and Jaeger/Prometheus?
The OpenTelemetry Collector is a pipeline; it receives, processes, and exports data. Jaeger is a backend specifically for storing and visualizing traces. Prometheus is a backend for storing and querying time-series metrics. The Collector can receive data in Jaeger/Prometheus formats and export data to Jaeger/Prometheus backends.
What is OpenTelemetry collector-contrib vs. core?
The core distribution contains a minimal, stable set of components. The collector-contrib distribution is a much larger set that includes core components plus many more contributed by the community. For most use cases, you should start with collector-contrib to have more capabilities available.
How do I monitor the OpenTelemetry Collector itself?
Use the prometheus exporter within the Collector's own metrics pipeline to expose its internal operational metrics. Then, scrape that endpoint (:8889 in our example) with a Prometheus server to monitor the Collector's health and performance.
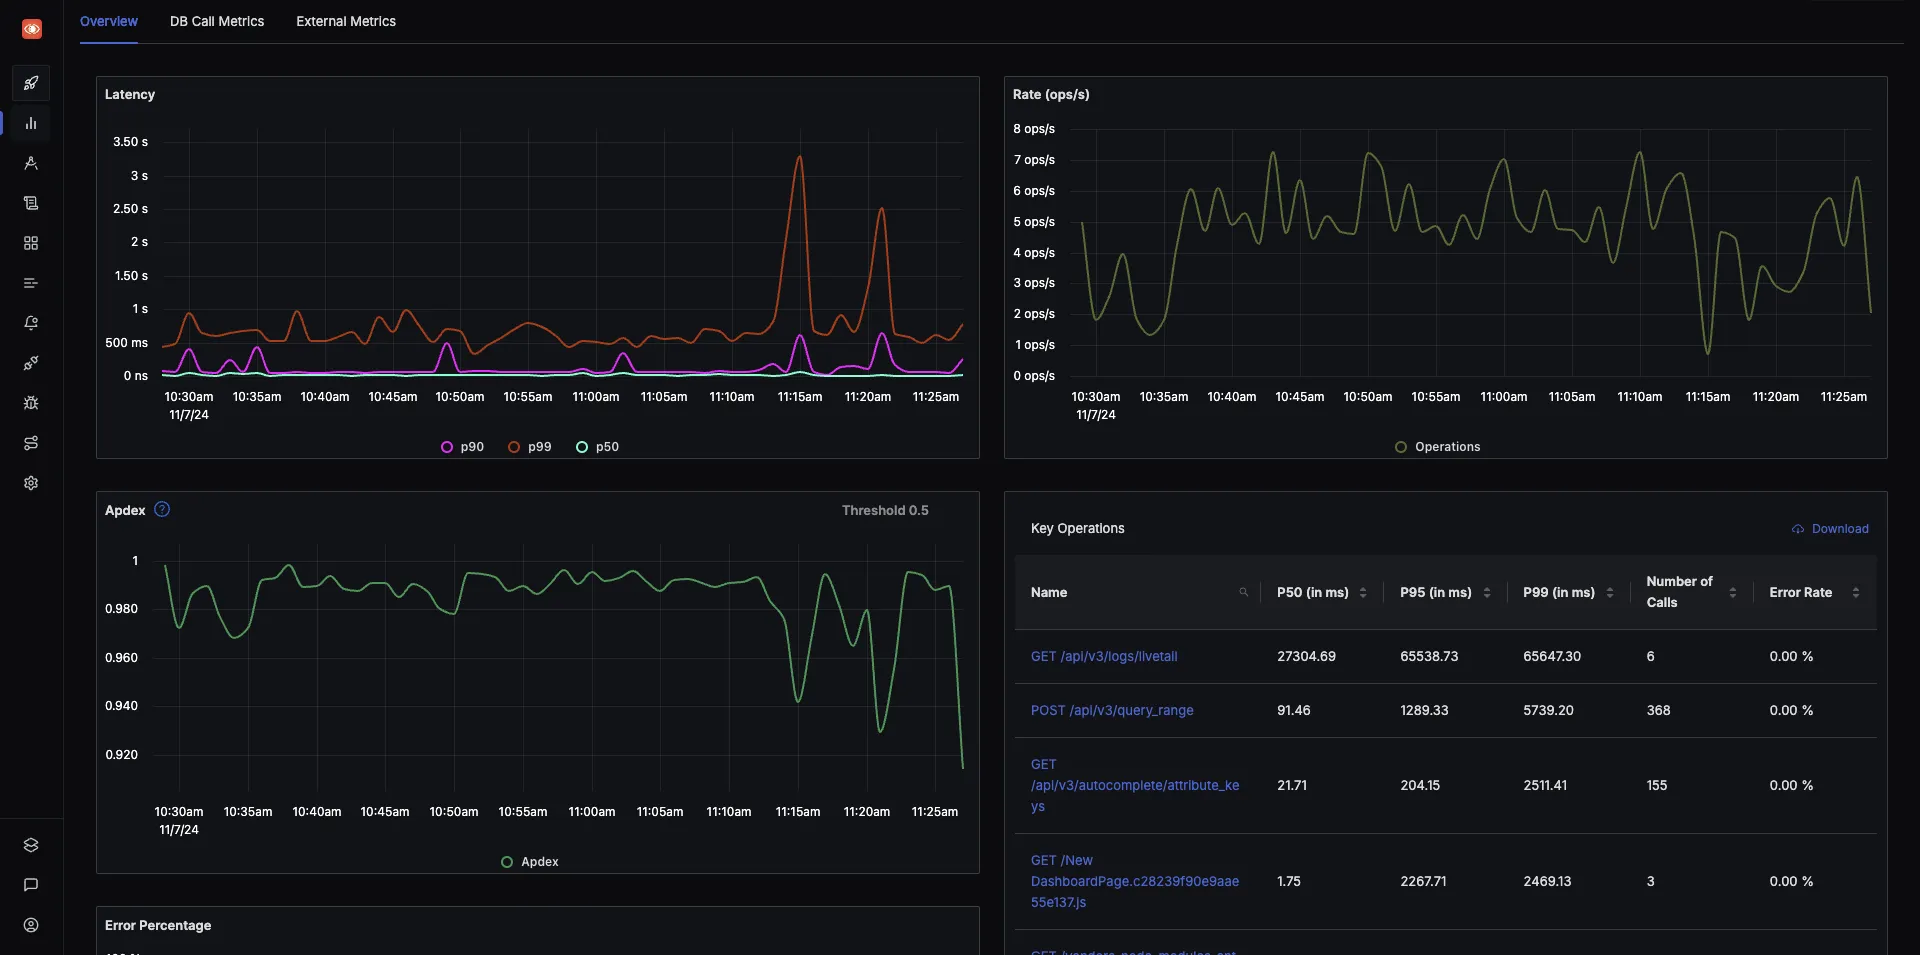
Getting Started with OpenTelemetry and SigNoz
The OpenTelemetry Collector provides a powerful, vendor-agnostic way to manage your telemetry data. Once your data is flowing, you need a backend to visualize and analyze it. SigNoz is a one-stop unified observability platform built to support OpenTelemetry natively.
With SigNoz, you can visualize all your logs, metrics, and traces in a single pane of glass, helping you resolve issues faster.
SigNoz cloud is the easiest way to run SigNoz. Sign up for a free account and get 30 days of unlimited access to all features.

You can also install and self-host SigNoz yourself since it is open-source. With 20,000+ GitHub stars, open-source SigNoz is loved by developers. Find the instructions to self-host SigNoz.
Related Content
OpenTelemetry Tracing - things you need to know
OpenTelemetry Logs - A Complete Introduction & Implementation
Monitor Nodejs Application with OpenTelemetry and SigNoz
