What is Distributed Tracing in OpenTelemetry?
Have you heard about traces? Most likely, yes! Do you confuse it with auditing? Hope not. Today, we're going to talk about tracing, specifically “Distributed Tracing,” and do a deep dive into it. Once we’re familiar with distributed tracing, we will show you how to implement it with OpenTelemetry - a new-age observability framework.
What is Distributed Tracing?
It is a method of tracking application requests as they flow from front-end devices to back-end services and databases in a distributed system.
Why do we need Distributed Tracing?
We will first understand what is a Distributed System.
Distributed systems are systems that look like a single application to an end user, but at their core, the functionalities are hosted and deployed on multiple servers that communicate over the network.
A typical distributed system will have three main servers: a front-end server, a back-end application server, and a database server. Each of these servers will, of course, have a replica for high availability. This is still not a complex system. You have just a handful of applications to trace a request, which you can easily trace via simple log files.
However, things become more complicated when working with a microservices architecture.
You would ask, “What are microservices?”
Basically, microservices are a software approach that creates applications as a loose coupling of specific services or functions rather than as a single, “monolithic” program.
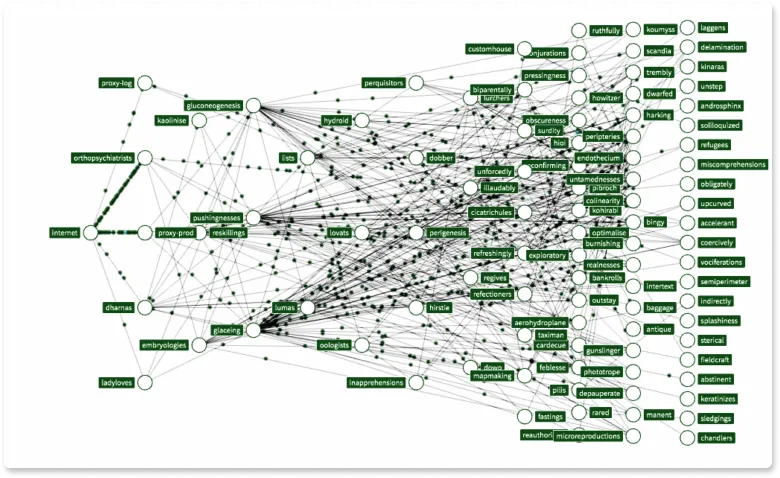
As you break your single monolithic application into smaller sets of services, the number of moving components in your architecture increases. It becomes complex to track a request and its flow through the mesh of all the services. In the olden days, a single log file was enough to scan through the logs to troubleshoot an issue.

However, in a microservice architecture, you could end up with 50-100 services, each with its logging file and separate process, with multiple instances running and distributed across multiple environments and locations. Imagine the pain of trying to understand or track a request in such a complex web of dynamic components. These requests are nearly impossible to track with traditional techniques designed for a single service application.
Therefore, we need a tool that can help us trace requests.
How do we implement Distributed Tracing?
The most common poor man's tool for tracing is logging. Yes, you'll spit out log statements in each and every method and be able to trace a request within a service. But it won’t suffice as most applications are multithreaded. Tracing a request in log files is very tedious and not easy. You will soon need a unique identifier tagged in each log statement so that when you look at the log files of different services, you can trace the request with the unique identifier for a single request in all the log files.
Clearly, logging is not the right approach for tracing. We need a more robust and mature solution that can handle the complex architectures we operate in.
Such a solution should be able to handle the complexity of the following:
- Creating a unique identifier across a distributed system
- Propagating the unique identifier across each service.
- Capturing important metrics like the response time of each method, service calls, and database calls.
Building such a solution is not easy and is very costly. This is when modern tracing solutions such as Zipkin and Jaeger gained popularity. It not only helps to capture the flow of requests but also helps identify how long each request took, which components and services it interacted with, and the latency created during each step.
Types of Tracing
There are generally two types of tracing.
- Code Level Tracing — In this approach, a trace log is generated and stored in a system that can be used to visualize the flow of requests between different services, and it also captures code-level execution traces.
- Log Tracing — In this approach, the logs from all the services are correlated by injecting a TraceId, which is unique for any request. The TraceId is propagated across services and also spit out in every log statement for correlating the logs in an automated way. This concept is further evolved to collect log statements from all the services and store them centrally for easier viewing and troubleshooting, also called Centralized Logging or Log Aggregation.
How does the modern Tracing solution work?
To understand this, first, understand some important keywords.
Observability is the ability to measure the internal states of a system by examining its outputs. It more of a white-box approach to knowing what is happening inside the system.
But how will you generate outputs to measure a system? You will need to write additional code to observe a system. This process is called Instrumentation.
Instrumentation is the process of measuring events in software using code, i.e., code must be added to a system to expose its inner state. Like unit testing - we write code to test if the code works. Instrumentation is the code we write to measure different metrics like response times, etc.
Telemetry is the automatic recording and transmission of data from remote or inaccessible sources to an IT system in a different location for monitoring and analysis.
It encompasses instrumenting the system under observation and sending telemetry data to a visualization tool.
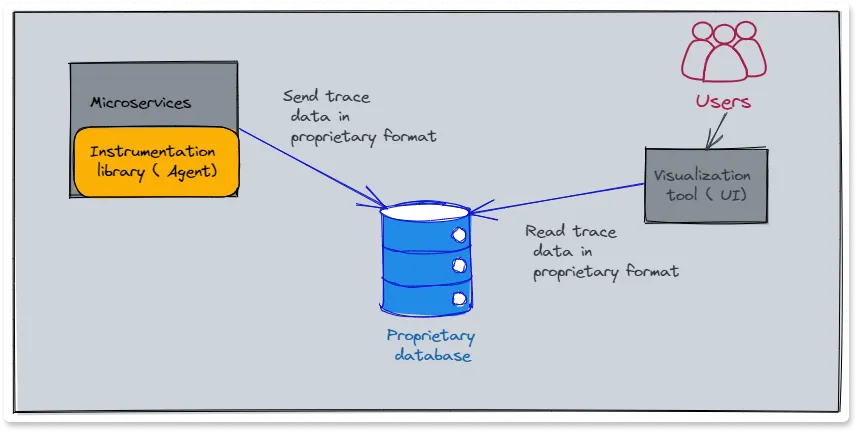
A typical tracing tool has the following high-level architecture:
It has the following high-level components, i.e., instrumentation libraries(agent), a database, a query service, and a visualization tool.
- Instrumentation libraries have the code to inject or generate code that can auto-instrument the code under observation.
- A database is needed to store the telemetry data. The database should be efficient in storing large amounts of data and serving analytical queries.
- A query service is an interface between the frontend and the database.
- The instrumentation library sends the trace data that gets stored in a database. The visualization tool loads the trace data from the database and shows a web UI that shows trace information in a graphical format.
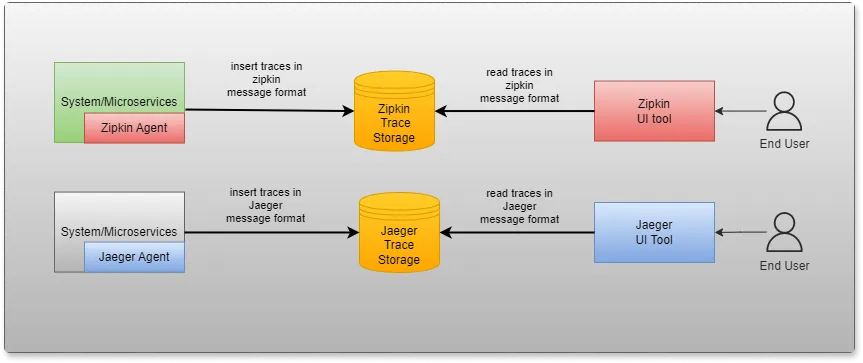
For example, Zipkin and Jaeger also have similar architecture.
Problems with current observability tools
Most of the APM tool vendors provide a "black box” approach to telemetry and observability. They force customers to install their agents (for instrumentation) on the customer's infrastructure, which provides no details about the implementation. It also tightly couples a client to a vendor, as changing a vendor now means doing everything new from front to back.
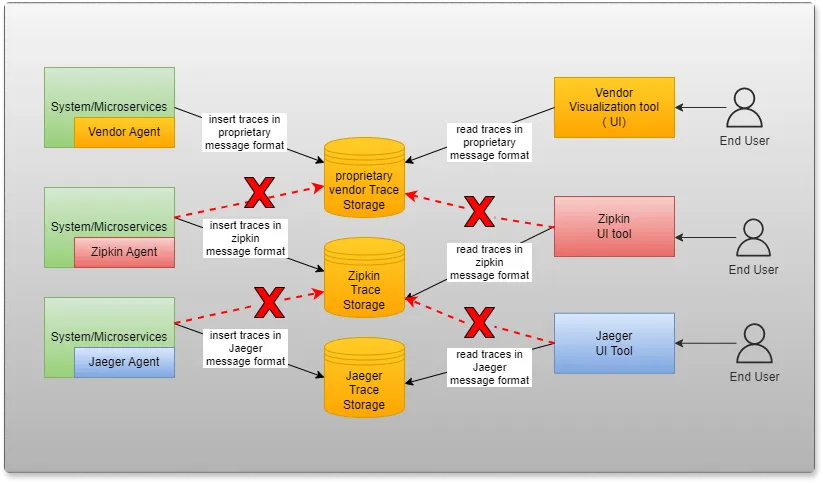
Existing solutions have following problems:
- Vendor-specific agents on Clients’ infrastructure.
- Proprietary protocol, message format, and database used.
- Switching to other tools is very expensive because of the tight coupling of vendor agents.
- Even FOSS tools have their own agent, which introduces coupling. You cannot use Zipkin agent and work with a Jaeger front-end tool.
- Overall, the architecture tightly couples the Telemetry collection and Telemetry Storage aspects of the solution.
What do we really want?
We want a solution that has:
- Instrumentation tools that can do AutoInstrumentation and produce rich Telemetry data.
- Go away from Black box solutions and make Telemetry easy to understand and configure.
- Adopt or establish Industry standards to achieve high interoperability between competing vendors and technologies.
- Removing vendor coupling due to proprietary agents
- Segregation of concerns - treat the concern of Telemetry Collection vs telemetry Storage as independent components, not tied to each other.
And that’s where OpenTelemetry comes into the picture.
Introducing OpenTelemetry - A new Standard for Observability
OpenTelemetry is a standard for implementing telemetry in your applications. It provides a specification, containing the requirements that all implementations should follow as well as some implementations for major languages, including an API and a SDK to interact with it.
OpenTelemetry was born from the merger of two other standards that decided to unify forces instead of competing with each other; these projects were OpenTracing and OpenCensus.
This brings maturity to the standard, as both of the previous projects were already mature and production tested. Another important fact is that OpenTelemetry is part of the Cloud Native Computing Foundation (CNCF) and one of the most popular and active open-source projects. It has become the second-highest velocity project in the CNCF ecosystem, Kubernetes remains the top one in 2022.
From observability point of view, OpenTelemetry provides a level playing field for all Observability providers, avoiding vendor lock-in and interoperability with other OSS projects in the Telemetry and Observability ecosystem.
We will be going more deeply into OpenTelemetry in our next article, where we will be learning more about OpenTelemetry and also show you a demo with a sample application.
