Implementing OpenTelemetry in FastAPI - A Practical Guide
FastAPI is a modern Python web framework based on standard Python type hints that makes it easy to build APIs. It's a relatively new framework, having been released in 2018 but has now been adopted by big companies like Uber, Netflix, and Microsoft. Using OpenTelemetry, you can monitor your FastAPI applications for performance by collecting telemetry signals like traces.

FastAPI is one of the fastest Python web frameworks currently available and is really efficient when it comes to writing code. It is based on ASGI specification, unlike other Python frameworks like Flask, which is based on WSGI specification.
This guide will walk you through the process of implementing OpenTelemetry in your FastAPI projects, enabling you to gain deep insights into your application's performance and behavior.
Send your FastAPI traces to SigNoz Cloud in 15 minutes — auto-instrumentation, pre-built dashboards, and guided onboarding included.
Get Started - FreeWhat is OpenTelemetry and Why Use it with FastAPI?
Instrumentation is the biggest challenge engineering teams face when starting out with monitoring their application performance. OpenTelemetry is the leading open-source standard that is solving the problem of instrumentation. It is currently an incubating project under the Cloud Native Computing Foundation.
OpenTelemetry is an open-source observability framework that provides a standardized way to collect and export telemetry data. It offers a unified approach to tracing, metrics, and logging — the three pillars of observability.
OpenTelemetry's data model consists of three core components:
- Traces: Represent the journey of a request through your system.
- Metrics: Provide quantitative measurements of your application's performance.
- Logs: Offer contextual information about events in your application.
The integration of OpenTelemetry with FastAPI brings several benefits:
- Enhanced visibility: Gain insights into request flows, performance bottlenecks, and error patterns.
- Standardization: Use a vendor-neutral solution that works with various backends and tools.
- Automatic instrumentation: Leverage built-in support for common libraries and frameworks.
- Customizability: Extend and customize telemetry data collection to fit your specific needs.
One of the biggest advantages of using OpenTelemetry is that it is vendor-agnostic. It can export data in multiple formats which you can send to a backend of your choice.
In this article, we will use SigNoz as a backend. SigNoz is an open-source APM tool that can be used for both metrics and distributed tracing.
Let's get started and see how to use OpenTelemetry for a FastAPI application.
Running a FastAPI application with OpenTelemetry
OpenTelemetry is a great choice to instrument ASGI frameworks. As it is open-source and vendor-agnostic, the data can be sent to any backend of your choice.
Setting up SigNoz
You need a backend to which you can send the collected data for monitoring and visualization. SigNoz is an OpenTelemetry-native APM that is well-suited for visualizing OpenTelemetry data.
SigNoz cloud is the easiest way to run SigNoz. You can sign up here for a free account and get 30 days of unlimited access to all features.

You can also install and self-host SigNoz yourself. Check out the docs for installing self-host SigNoz.
Instrumenting a sample FastAPI application with OpenTelemetry
Prerequisites
- Python 3.8 or newer
Download the latest version of Python.
Step 1. Running sample FastAPI app
We will be using the FastAPI app at this Github repo. All the required OpenTelemetry packages are contained within the requirements.txt file under app folder in this sample app. Go to the app folder first.
git clone <https://github.com/SigNoz/sample-fastAPI-app.git>
cd sample-fastapi-app/
cd app
It’s a good practice to create virtual environments for running Python apps, so we will be using a virtual python environment for this sample fastAPI app.
Create a Virtual Environment
python3 -m venv .venv
source .venv/bin/activate
Step 2. Run instructions for sending data to SigNoz
The requirements.txt file contains all the necessary OpenTelemetry Python packages needed for instrumentation. In order to install those packages, run the following command:
python -m pip install -r requirements.txt
The dependencies included are briefly explained below:
opentelemetry-distro - The distro provides a mechanism to automatically configure some of the more common options for users. It helps to get started with OpenTelemetry auto-instrumentation quickly.
opentelemetry-exporter-otlp - This library provides a way to install all OTLP exporters. You will need an exporter to send the data to SigNoz.
💡 The opentelemetry-exporter-otlp is a convenience wrapper package to install all OTLP exporters. Currently, it installs:
- opentelemetry-exporter-otlp-proto-http
- opentelemetry-exporter-otlp-proto-grpc
- (soon) opentelemetry-exporter-otlp-json-http
The opentelemetry-exporter-otlp-proto-grpc package installs the gRPC exporter which depends on the grpcio package. The installation of grpcio may fail on some platforms for various reasons. If you run into such issues, or you don't want to use gRPC, you can install the HTTP exporter instead by installing the opentelemetry-exporter-otlp-proto-http package. You need to set the OTEL_EXPORTER_OTLP_PROTOCOL environment variable to http/protobuf to use the HTTP exporter.
Step 3. Install application specific packages
This step is required to install packages specific to the application. This command figures out which instrumentation packages the user might want to install and installs it for them:
opentelemetry-bootstrap --action=install
Please make sure that you have installed all the dependencies of your application before running the above command. The command will not install instrumentation for the dependencies which are not installed.
Step 4. Configure environment variables to run app and send data to SigNoz
You're almost done. In the last step, you just need to configure a few environment variables for your OTLP exporters. Environment variables that need to be configured:
OTEL_RESOURCE_ATTRIBUTES=service.name=<service_name> \\
OTEL_EXPORTER_OTLP_ENDPOINT="<https://ingest>.{region}.signoz.cloud:443" \\
OTEL_EXPORTER_OTLP_HEADERS="signoz-ingestion-key=SIGNOZ_INGESTION_KEY" \\
OTEL_EXPORTER_OTLP_PROTOCOL=grpc \\
opentelemetry-instrument <your_run_command>
<service_name>is the name of the service you want<your_run_command>can bepython3 app.pyorpython manage.py runserver --noreload- Replace
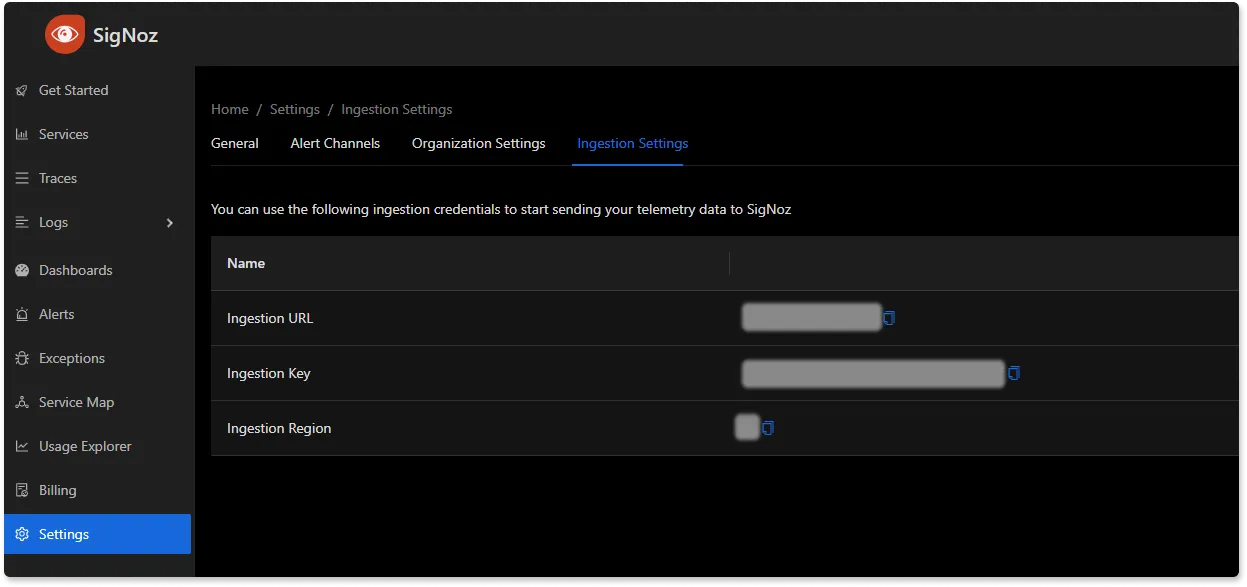
SIGNOZ_INGESTION_KEYwith the api token provided by SigNoz. You can find it in the email sent by SigNoz with your cloud account details.
You will be able to get ingestion details in SigNoz cloud account under settings --> ingestion settings.

Don’t run app in reloader/hot-reload mode as it breaks instrumentation. For example, if you use --reload or reload=True, it enables the reloader mode which breaks OpenTelemetry isntrumentation.
For our sample FastAPI application, the run command will look like:
OTEL_RESOURCE_ATTRIBUTES=service.name=sample-fastapi-app \\
OTEL_EXPORTER_OTLP_ENDPOINT="<https://ingest>.{region}.signoz.cloud:443" \\
OTEL_EXPORTER_OTLP_HEADERS="signoz-ingestion-key=SIGNOZ_INGESTION_KEY" \\
OTEL_EXPORTER_OTLP_PROTOCOL=grpc \\
opentelemetry-instrument uvicorn main:app --host localhost --port 5002
The uvicorn run command with multiple workers is yet to be supported. Alternatively, you can use gunicorn with the worker class uvicorn.workers.Uvicorn[H11]Worker
In that case, the final command will be:
OTEL_RESOURCE_ATTRIBUTES=service.name=sample-fastapi-app \\
OTEL_EXPORTER_OTLP_ENDPOINT="<https://ingest>.{region}.signoz.cloud:443" \\
OTEL_EXPORTER_OTLP_HEADERS="signoz-ingestion-key=SIGNOZ_INGESTION_KEY" \\
OTEL_EXPORTER_OTLP_PROTOCOL=grpc \\
opentelemetry-instrument gunicorn main:app --workers 2 --worker-class uvicorn.workers.UvicornWorker --bind 0.0.0.0:8000
And, congratulations! You have instrumented your sample FastAPI app. You can check if your app is running or not by hitting the endpoint at http://localhost:5002/.
You need to generate some load on your app so that there is data to be captured by OpenTelemetry. You can use locust for this load testing.
pip3 install locust
locust -f locustfile.py --headless --users 10 --spawn-rate 1 -H <http://localhost:5002>
Or you can also hit the endpoint http://localhost:5002/ manually to generate some load.
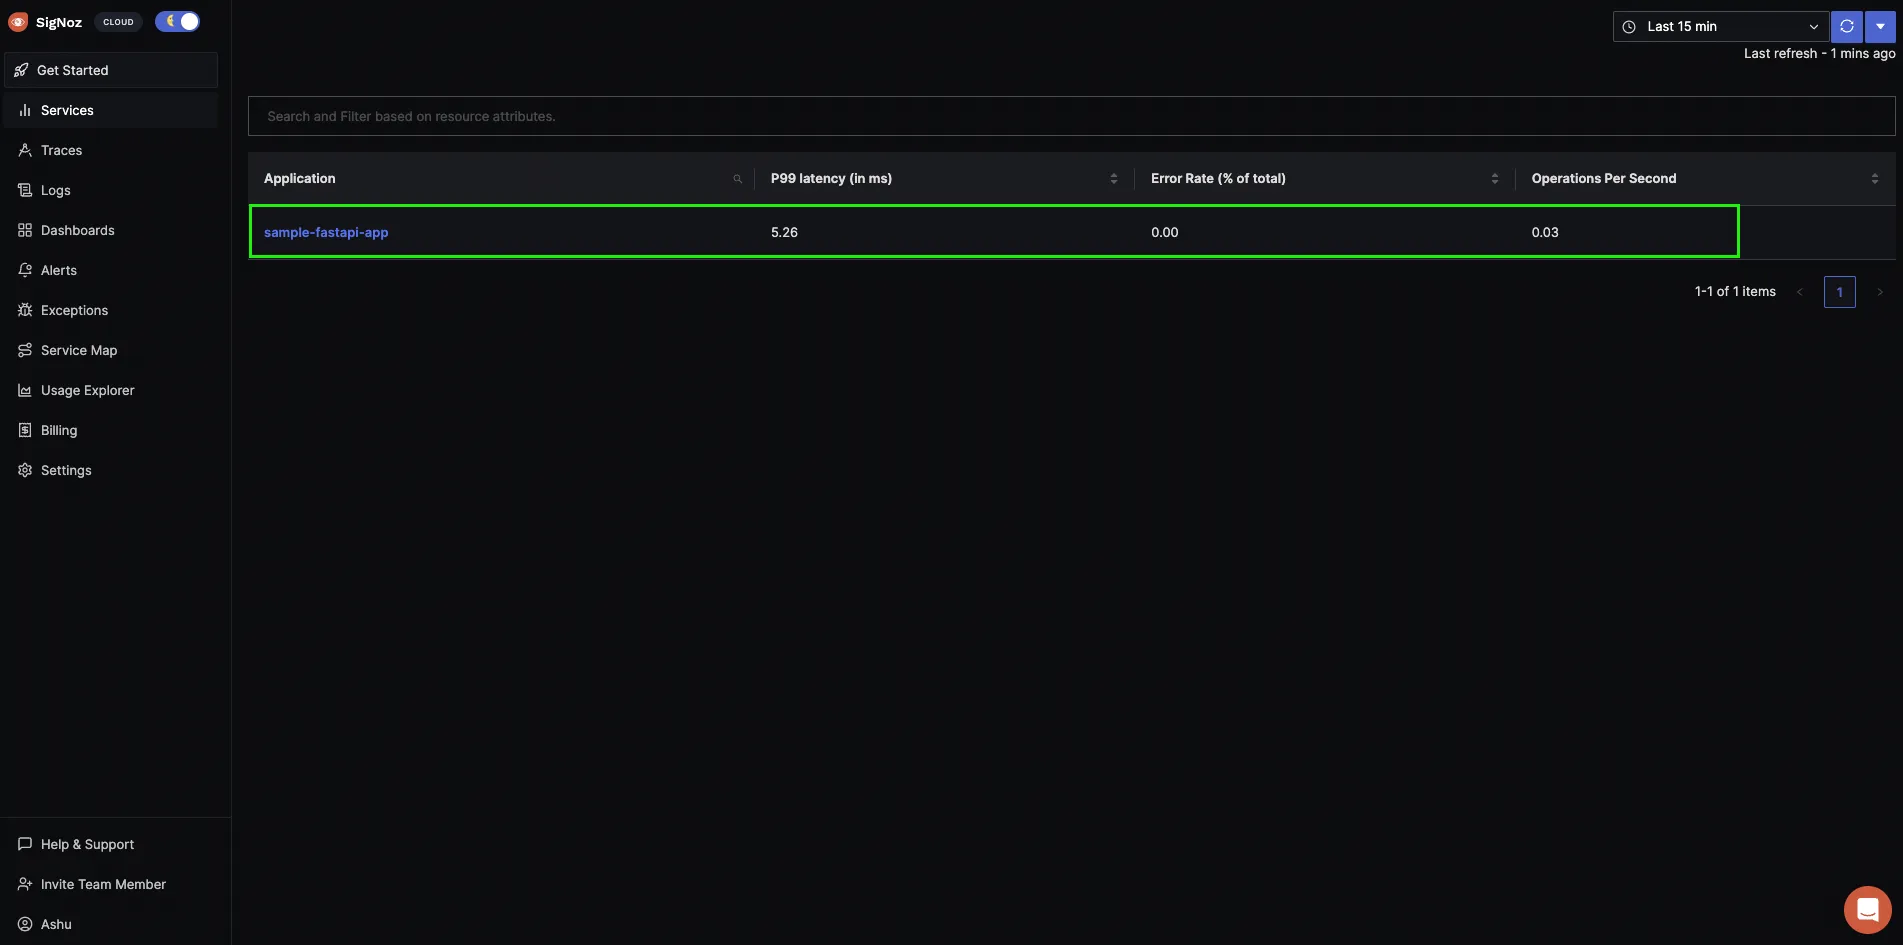
You will find sample-fastapi-app in the list of sample applications being monitored by SigNoz.

If you want to run the application with a Docker image, refer to the section below for instructions.
Run with Docker
You can use the below instructions if you want to run your app as a Docker image, below are the instructions.
Build Docker image
docker build -t sample-fastapi-app .
Setting environment variables
You need to set some environment variables while running the application with OpenTelemetry and send collected data to SigNoz. You can do so with the following commands at the terminal:
# If you have your SigNoz IP Address, replace <IP of SigNoz> with your IP Address.

docker run -d --name fastapi-container \\
-e OTEL_METRICS_EXPORTER='none' \\
-e OTEL_RESOURCE_ATTRIBUTES='service.name=fastapiApp' \\
-e OTEL_EXPORTER_OTLP_ENDPOINT="<https://ingest>.{region}.signoz.cloud:443" \\
-e OTEL_EXPORTER_OTLP_HEADERS="signoz-ingestion-key=SIGNOZ_INGESTION_KEY" \\
-e OTEL_EXPORTER_OTLP_PROTOCOL=grpc \\
-p 5002:5002 sample-fastapi-app
If you're using Docker Compose setup:
# If you are running SigNoz through official Docker Compose setup, run `docker network ls` and find ClickHouse network ID. It will be something like this `clickhouse-setup_default`
# and pass network ID by using `--net <network ID>`

docker run -d --name fastapi-container \\
--net clickhouse-setup_default  \\
--link clickhouse-setup_otel-collector_1 \\
-e OTEL_METRICS_EXPORTER='none' \\
-e OTEL_RESOURCE_ATTRIBUTES='service.name=fastapiApp' \\
-e OTEL_EXPORTER_OTLP_ENDPOINT="<https://ingest>.{region}.signoz.cloud:443" \\
-e OTEL_EXPORTER_OTLP_HEADERS="signoz-ingestion-key=SIGNOZ_INGESTION_KEY" \\
-e OTEL_EXPORTER_OTLP_PROTOCOL=grpc \\
-p 5002:5002 sample-fastapi-app
Monitor FastAPI application with SigNoz
SigNoz makes it easy to visualize metrics and traces captured through OpenTelemetry instrumentation.
SigNoz comes with out of box RED metrics charts and visualization. RED metrics stands for:
- Rate of requests
- Error rate of requests
- Duration taken by requests

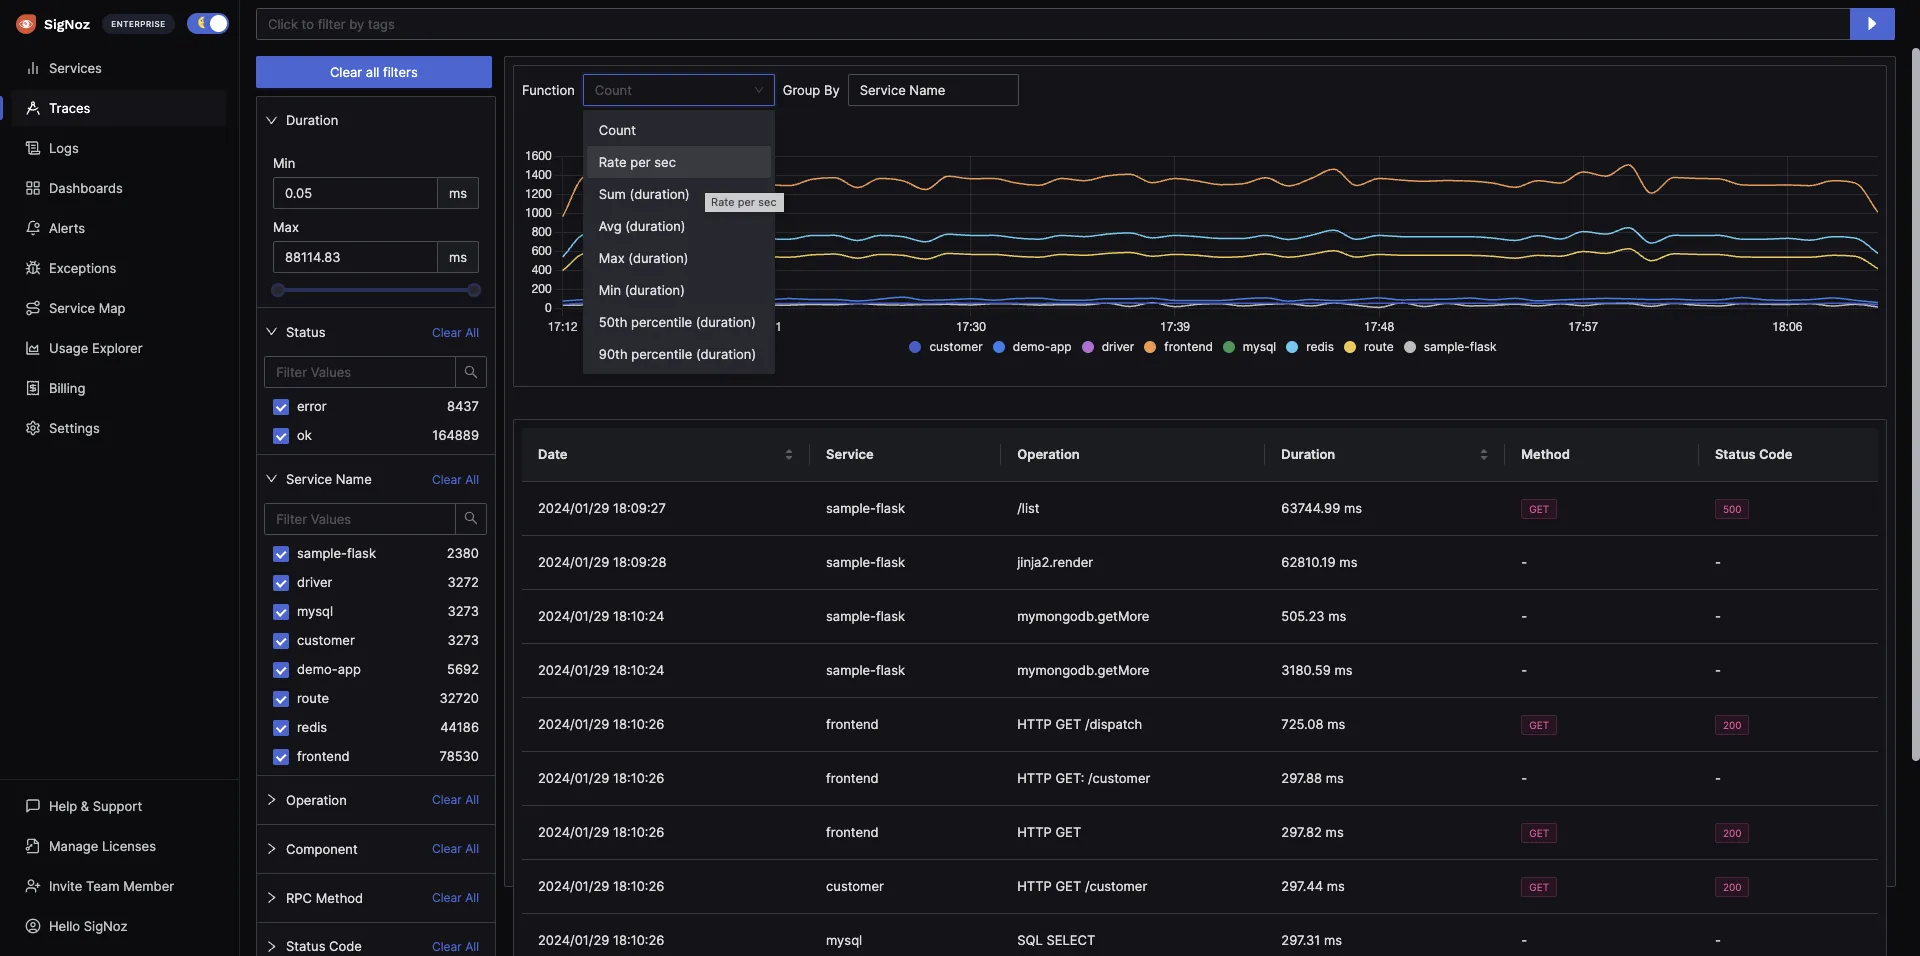
You can then choose a particular timestamp where latency is high to drill down to traces around that timestamp.

You can use flamegraphs to exactly identify the issue causing the latency.

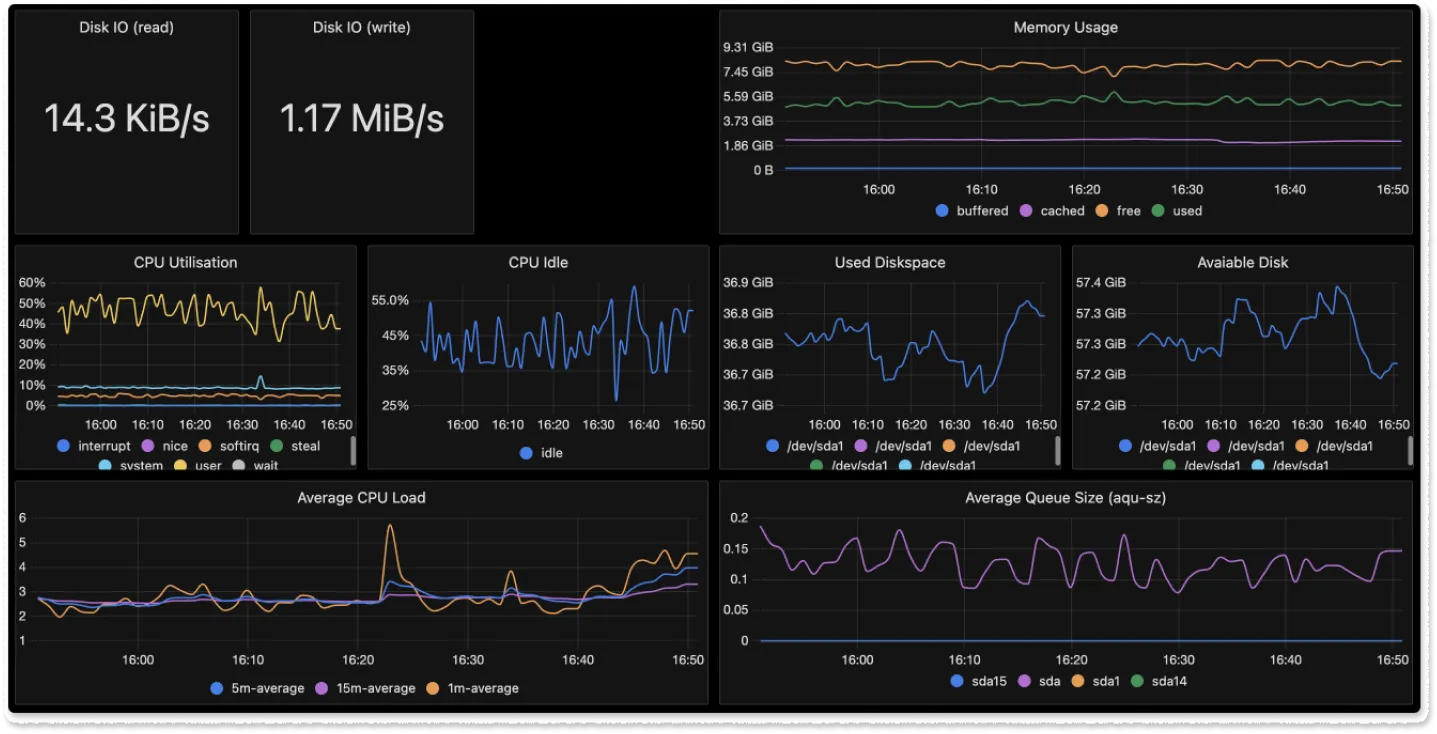
You can also build custom metrics dashboard for your infrastructure.

Advanced OpenTelemetry Techniques for FastAPI
As you become more comfortable with OpenTelemetry, consider these advanced techniques:
- Custom processors: Modify or filter spans before they're exported:
from opentelemetry.sdk.trace import SpanProcessor

class CustomProcessor(SpanProcessor):
    def on_start(self, span, parent_context):
        span.set_attribute("custom.attribute", "value")

    def on_end(self, span):
        if span.name == "sensitive_operation":
            span.set_attribute("sensitive_data", "[REDACTED]")

trace.get_tracer_provider().add_span_processor(CustomProcessor())
- Error tracking: Capture and analyze exceptions:
from fastapi import HTTPException

@app.exception_handler(HTTPException)
async def http_exception_handler(request, exc):
    span = trace.get_current_span()
    span.set_status(trace.Status(trace.StatusCode.ERROR, str(exc)))
    span.record_exception(exc)
    return JSONResponse(status_code=exc.status_code, content={"detail": exc.detail})
- Integrating with FastAPI's dependency injection:
from fastapi import Depends
from opentelemetry import trace

async def get_traced_db():
    with trace.get_tracer(__name__).start_as_current_span("database_operation"):
        # Your database connection logic here
        yield db

@app.get("/items")
async def read_items(db = Depends(get_traced_db)):
    # Use the traced database connection
    return await db.fetch_all(query)
- Optimizing OpenTelemetry overhead: For high-traffic applications, consider:
- Using a more aggressive sampling strategy.
- Batching span exports to reduce network overhead.
- Monitoring the performance impact of OpenTelemetry itself.
These advanced techniques allow you to fine-tune OpenTelemetry's behavior, ensuring that you collect the most relevant data while minimizing overhead.
OpenTelemetry Best Practices for FastAPI Microservices
Implementing OpenTelemetry in a FastAPI microservices architecture requires special considerations to ensure effective observability across your distributed system. This section covers best practices and strategies to optimize your OpenTelemetry implementation in a FastAPI microservices environment.
1. Correlating Traces Across Microservices
Distributed tracing is crucial in a microservices architecture. To effectively correlate traces across multiple FastAPI microservices:
a) Use consistent service names:
from opentelemetry import trace
from opentelemetry.sdk.resources import Resource

resource = Resource(attributes={"service.name": "user-service"})
tracer = trace.get_tracer(__name__, resource=resource)
b) Propagate context in HTTP headers:
from fastapi import FastAPI, Request
from opentelemetry.propagate import extract, inject
import httpx

app = FastAPI()

@app.get("/user/{user_id}")
async def get_user(request: Request, user_id: int):
    ctx = extract(request.headers)
    with tracer.start_as_current_span("get_user", context=ctx):
        async with httpx.AsyncClient() as client:
            headers = {}
            inject(headers)
            response = await client.get(f"<http://auth-service/validate/{user_id}>", headers=headers)
        # Process response
2. Optimizing OpenTelemetry Performance
In a microservices architecture, the overhead of telemetry can accumulate. To optimize performance:
a) Use sampling to reduce data volume:
from opentelemetry.sdk.trace.sampling import ParentBased, TraceIdRatioBased

sampler = ParentBased(root=TraceIdRatioBased(0.1))  # Sample 10% of traces
trace.get_tracer_provider().set_sampler(sampler)
b) Batch span exports:
from opentelemetry.sdk.trace.export import BatchSpanProcessor

exporter = OTLPSpanExporter(endpoint="<http://collector:4317>")
span_processor = BatchSpanProcessor(exporter)
trace.get_tracer_provider().add_span_processor(span_processor)
3. Configuring Sampling and Data Retention
Effective sampling and data retention strategies are crucial in a microservices environment:
a) Use adaptive sampling:
from opentelemetry.sdk.trace.sampling import ParentBased, RateLimitingSampler

sampler = ParentBased(root=RateLimitingSampler(100))  # 100 samples per second
trace.get_tracer_provider().set_sampler(sampler)
b) Implement trace-based sampling decisions:
class CustomSampler(Sampler):
    def should_sample(self, context, trace_id, name, kind, attributes, links, trace_state):
        if "high_priority" in attributes:
            return SamplingResult(SamplingDecision.RECORD_AND_SAMPLE)
        return SamplingResult(SamplingDecision.DROP)

sampler = CustomSampler()
trace.get_tracer_provider().set_sampler(sampler)
4. Custom Metrics and Spans for FastAPI Microservices
Implement custom metrics and spans that provide valuable insights for FastAPI microservices:
a) Track inter-service communication:
from opentelemetry import metrics

meter = metrics.get_meter(__name__)
request_counter = meter.create_counter(
    name="inter_service_requests",
    description="Number of requests between services",
    unit="1",
)

async def call_service(service_name: str):
    with tracer.start_as_current_span(f"call_{service_name}"):
        # Make the service call
        request_counter.add(1, {"target_service": service_name})
b) Monitor FastAPI route performance:
from fastapi import FastAPI, Request
from time import time

app = FastAPI()

@app.middleware("http")
async def add_process_time_header(request: Request, call_next):
    start_time = time()
    response = await call_next(request)
    process_time = time() - start_time
    with tracer.start_as_current_span("http_request"):
        tracer.add_event("process_time", {"value": process_time})
    return response
c) Track database operations:
from opentelemetry.instrumentation.sqlalchemy import SQLAlchemyInstrumentor
from sqlalchemy import create_engine

engine = create_engine("postgresql://user:password@localhost/dbname")
SQLAlchemyInstrumentor().instrument(engine=engine)
By implementing these best practices, you'll be able to effectively monitor and optimize your FastAPI microservices using OpenTelemetry. This approach provides deep insights into your distributed system's performance and helps identify bottlenecks and issues across service boundaries.
Conclusion
OpenTelemetry makes it very convenient to instrument your FastAPI application. You can then use an open-source APM tool like SigNoz to analyze the performance of your app. As SigNoz offers a full-stack observability tool, you don't have to use multiple tools for your monitoring needs.
You can try out SigNoz by visiting its GitHub repo 👇

If you have any questions or need any help in setting things up, join our slack community and ping us in #support channel.

Read more about OpenTelemetry 👇
Things you need to know about OpenTelemetry tracing
OpenTelemetry collector - architecture and configuration guide
FAQs
How does OpenTelemetry impact FastAPI application performance?
OpenTelemetry adds minimal overhead to your FastAPI application. The exact impact depends on factors like sampling rate and export frequency. In most cases, the performance hit is negligible compared to the insights gained. However, for high-traffic applications, careful tuning may be necessary.
Can OpenTelemetry be used with FastAPI in a serverless environment?
Yes, OpenTelemetry can be used with FastAPI in serverless environments. However, you may need to adjust your configuration to account for the stateless nature of serverless functions. Consider using batch exporters and ensuring that your telemetry data is exported before the function terminates.
What are the best practices for securing sensitive data in OpenTelemetry traces?
To secure sensitive data:
- Use custom processors to redact or mask sensitive information before export.
- Implement proper access controls on your telemetry data storage.
- Avoid logging sensitive data as span attributes or events.
- Use sampling strategies to reduce the amount of data collected for sensitive operations.
How does OpenTelemetry compare to other monitoring solutions for FastAPI?
OpenTelemetry offers several advantages:
- Vendor-neutral: Works with multiple backends and tools.
- Comprehensive: Covers traces, metrics, and logs in a single framework.
- Standardized: Provides a consistent approach across different languages and frameworks.
- Extensible: Allows for custom instrumentation and exporters.
While other solutions may offer easier setup or more specialized features, OpenTelemetry's flexibility and standardization make it a strong choice for many FastAPI applications.
What is OpenTelemetry and why should I use it with FastAPI?
OpenTelemetry is an open-source observability framework that provides a standardized way to collect and export telemetry data (traces, metrics, and logs). It's beneficial for FastAPI applications because it offers enhanced visibility into request flows, standardization across different backends, automatic instrumentation, and customizability to fit specific needs.
How do I implement OpenTelemetry in my FastAPI application?
To implement OpenTelemetry in your FastAPI app:
- Install necessary packages (opentelemetry-distro, opentelemetry-exporter-otlp)
- Use opentelemetry-bootstrap to install application-specific instrumentation
- Configure environment variables for OTLP exporters
- Run your FastAPI app with the opentelemetry-instrument command
What are the key components of OpenTelemetry's data model?
OpenTelemetry's data model consists of three core components:
- Traces: Represent the journey of a request through your system
- Metrics: Provide quantitative measurements of your application's performance
- Logs: Offer contextual information about events in your application
Can I use OpenTelemetry with FastAPI in a Docker environment?
Yes, you can use OpenTelemetry with FastAPI in a Docker environment. You'll need to set the appropriate environment variables in your Docker run command or docker-compose file to configure OpenTelemetry exporters and other settings.
How can I visualize the data collected by OpenTelemetry from my FastAPI application?
You can use various backends to visualize OpenTelemetry data. The article recommends using SigNoz, an open-source APM tool that provides out-of-the-box RED (Rate, Error, Duration) metrics charts and distributed tracing visualization. It allows you to monitor application latency, requests per second, error percentage, and analyze individual traces using flamegraphs.
What are some advanced OpenTelemetry techniques for FastAPI?
Advanced OpenTelemetry techniques for FastAPI include:
- Using custom processors to modify or filter spans
- Implementing error tracking to capture and analyze exceptions
- Integrating with FastAPI's dependency injection system
- Optimizing OpenTelemetry overhead for high-traffic applications through sampling strategies and batching span exports
How does OpenTelemetry impact the performance of my FastAPI application?
OpenTelemetry generally adds minimal overhead to FastAPI applications. The exact impact depends on factors like sampling rate and export frequency. For most applications, the performance hit is negligible compared to the insights gained. However, high-traffic applications may require careful tuning to optimize performance.
