OpenTelemetry Java Tutorial | Auto-Instrument Java App with OpenTelemetry
OpenTelemetry stands at the forefront of modern observability practices, revolutionizing how developers gain insights into their applications' performance and behavior. As a powerful distributed tracing framework, it empowers engineers to effortlessly instrument their applications, providing comprehensive visibility into the intricacies of microservices architectures.
This tutorial discusses how OpenTelemetry can be used to get insights from a Java application.
What is OpenTelemetry?
OpenTelemetry is an open-source collection of tools, APIs, and SDKs that aims to standardize the way we generate and collect telemetry data. It follows a specification-driven development. The OpenTelemetry specification has design and implementation guidelines for how the instrumentation libraries should be implemented. In addition, it provides client libraries in all the major programming languages that follow the specification.
OpenTelemetry was formed after the merger of two open-source projects - OpenCensus and OpenTracing in 2019. Since then, it has been the go-to open-source standard for instrumenting cloud-native applications.
The specification is designed into distinct types of telemetry known as signals. Presently, OpenTelemetry has specifications for these three signals:
- Logs
- Metrics and
- Traces
Together, these three signals form the three pillars of observability. OpenTelemetry is the bedrock for setting up an observability framework. The application code is instrumented using OpenTelemetry client libraries, which enables the generation of telemetry data. Once the telemetry data is generated and collected, you need to configure the OpenTelemetry exporter to send data to a backed analysis tool like SigNoz.
Instrumenting a sample Java app for traces
In this section, you will learn to instrument a Java application with OpenTelemetry to get traces.
Prerequisite
- A SigNoz Cloud account
- Java 8 or newer (full JDK, not a JRE)
- OpenTelemetry Jar agent, latest version.
You need a backend to which you can send the collected data for monitoring and visualization. SigNoz is an OpenTelemetry-native APM that is well-suited for visualizing OpenTelemetry data.
SigNoz cloud is the easiest way to run SigNoz. You can sign up here for a free account and get 30 days of unlimited access to all features.
You can also install and self-host SigNoz yourself. Check out the docs for installing self-host SigNoz.
Install the OpenTelemetry Jar agent
To instrument your Java application, the OpenTelemetry Java Jar agent will be utilized. The JAR agent can be attached to any Java 8+ application. It can detect a number of popular libraries and frameworks and instrument them right out of the box. You don't need to add any code for that.
To download the Java Jar agent, run the below command in your terminal:
wget https://github.com/open-telemetry/opentelemetry-java-instrumentation/releases/latest/download/opentelemetry-javaagent.jar
The path to where the Jar file was downloaded will be used later, so note it down somewhere.
Set up the Java application
A sample Java application has been provided. Run the below commands to set it up:
# Clone the Spring PetClinic repository from SigNoz's GitHub
git clone https://github.com/SigNoz/spring-petclinic

# Change into the cloned directory
cd spring-petclinic

# Use Maven Wrapper to package the Spring PetClinic application
./mvnw package

# Run the Spring PetClinic application using the generated JAR file
`java -jar target/*.jar`
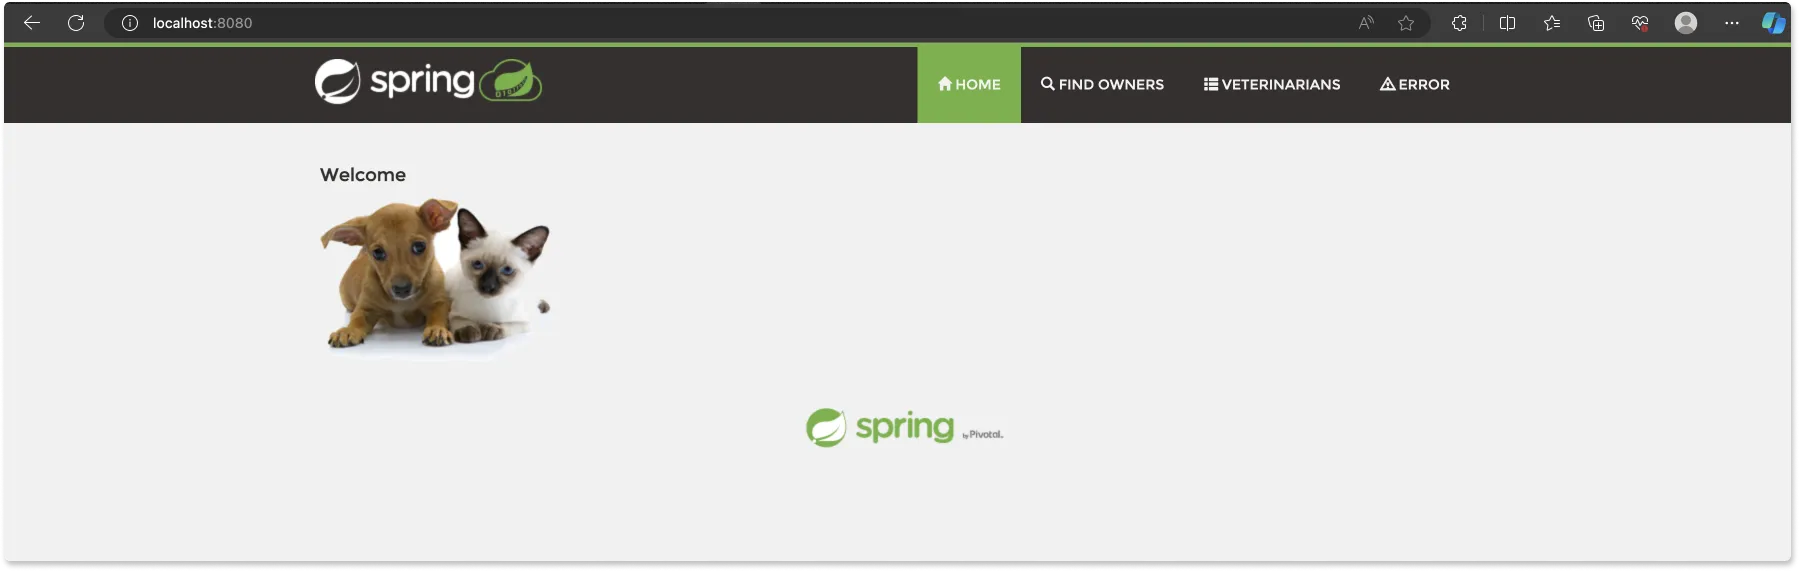
You can access the running app at http://localhost:8090
Setting up auto-instrumentation for Java application
To auto-instrument the application, the Jar agent for instrumentation needs to be enabled. This helps in generating traces from the application, and the generated traces need to be sent to a backend for visualization. Here, the SigNoz cloud will serve as the backend for visualization.
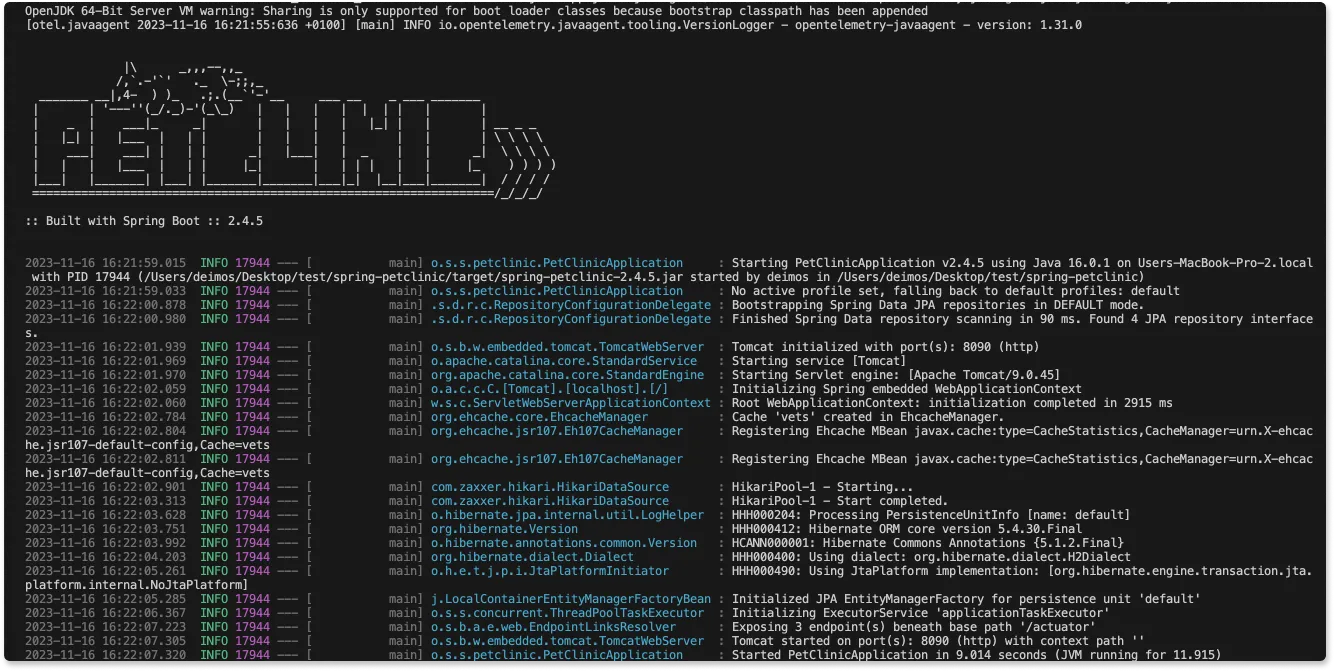
To enable auto instrumentation, run the below command:
OTEL_LOGS_EXPORTER=otlp OTEL_EXPORTER_OTLP_ENDPOINT="https://ingest.{region}.signoz.cloud:443" OTEL_EXPORTER_OTLP_HEADERS=signoz-ingestion-key={your-ingestion-key} OTEL_RESOURCE_ATTRIBUTES=service.name=java-app java -javaagent:/path/opentelemetry-javaagent.jar -jar target/*.jar
- Replace
/path/opentelemetry-javaagent.jarwith the path from which the OpenTelemetry Java Jar agent was downloaded. - Replace
{region}with the region you selected when creating your SigNoz Cloud account. - Replace
{your-ingestion-key}with the ingestion key sent to your email address after the creation of your SigNoz Cloud account.
| Region | Endpoint                   |
| ------ | -------------------------- |
| US     | ingest.us.signoz.cloud:443 |
| IN     | ingest.in.signoz.cloud:443 |
| EU     | ingest.eu.signoz.cloud:443 |
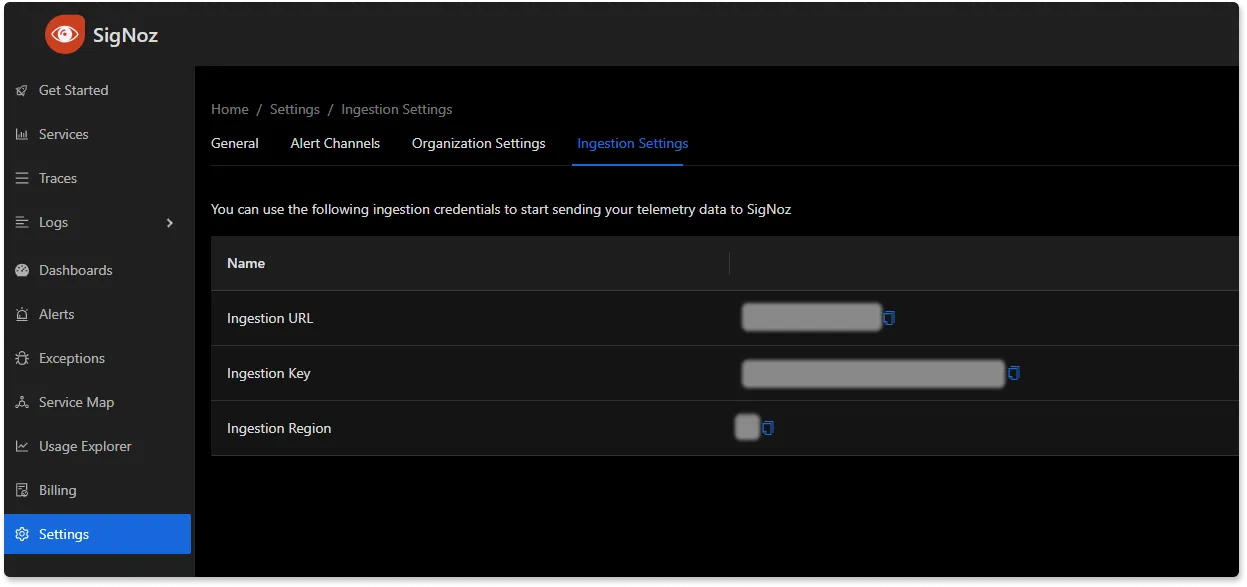
You can also find the ingestion details in SigNoz dashboard under the Settings tab.
The application will be started again on the same address, localhost:8090, but this time, it will be able to send telemetry data to your SigNoz cloud account.
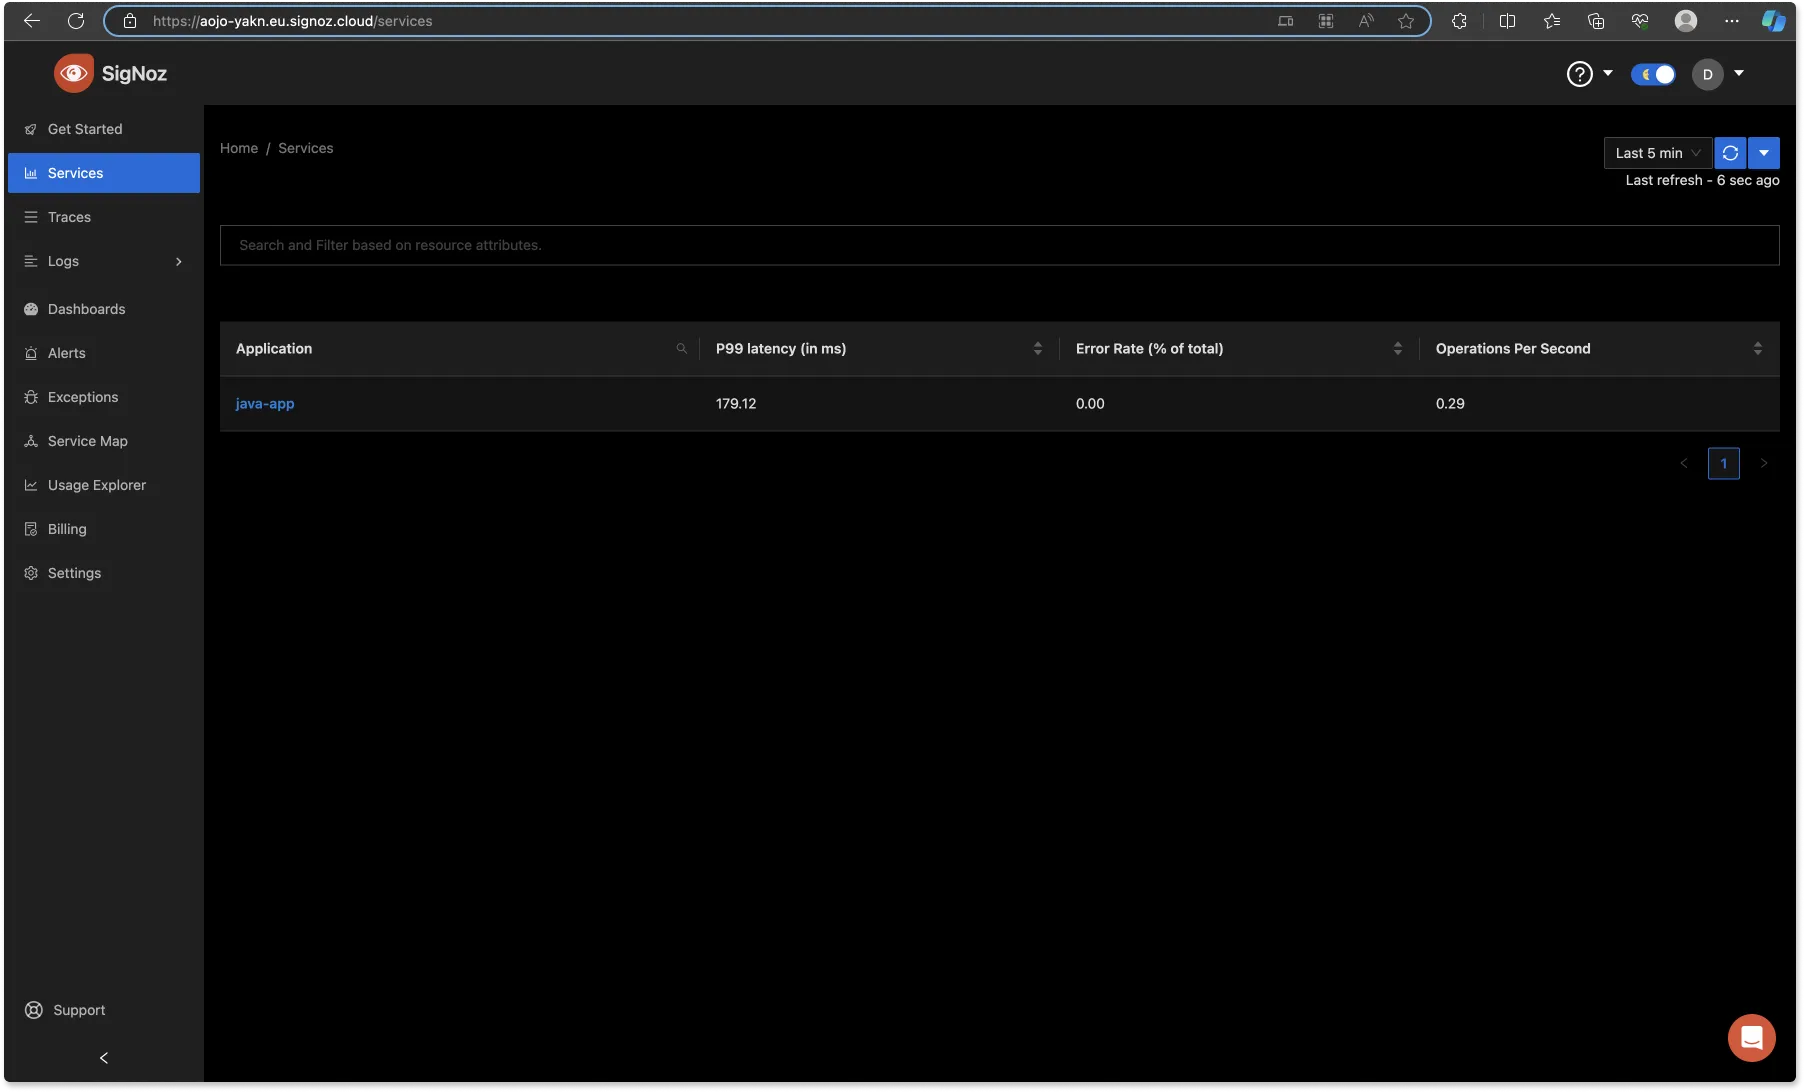
To see the application running in SigNoz, load the URL provided in the email sent to you during your SigNoz cloud account creation.
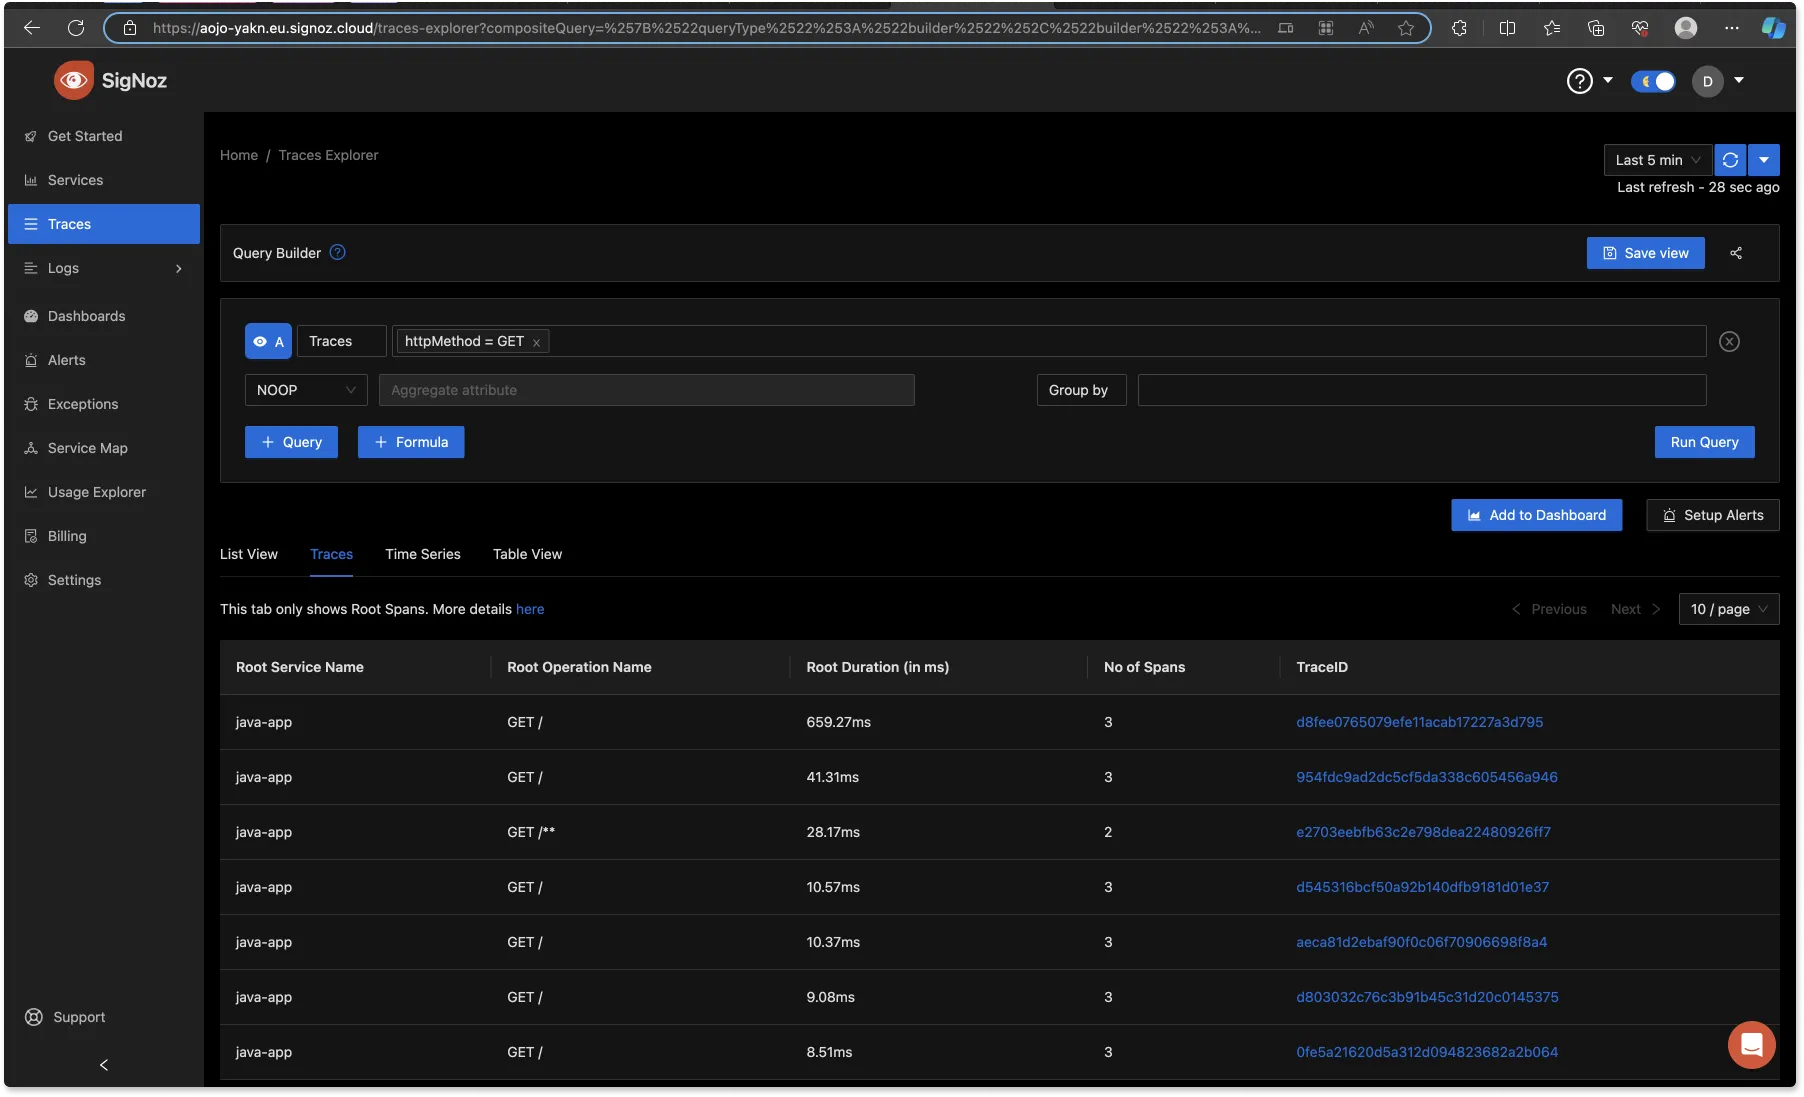
From the left side bar, click on the “Traces” tab to see traces from the application. Click on the “Try new Traces Explorer” button to use the new Traces Explorer.
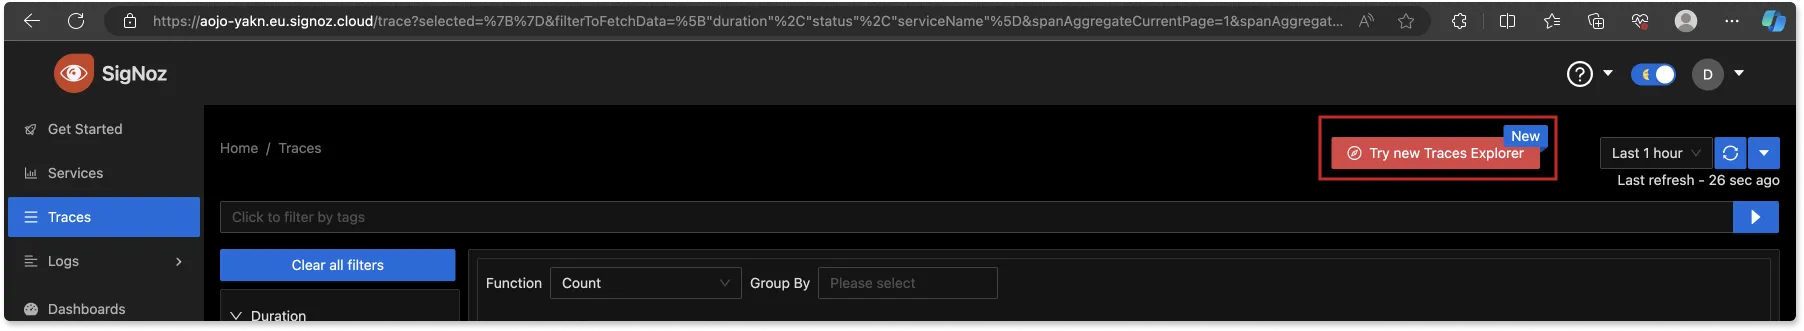
With this, you can run queries against your traces using the query builder.
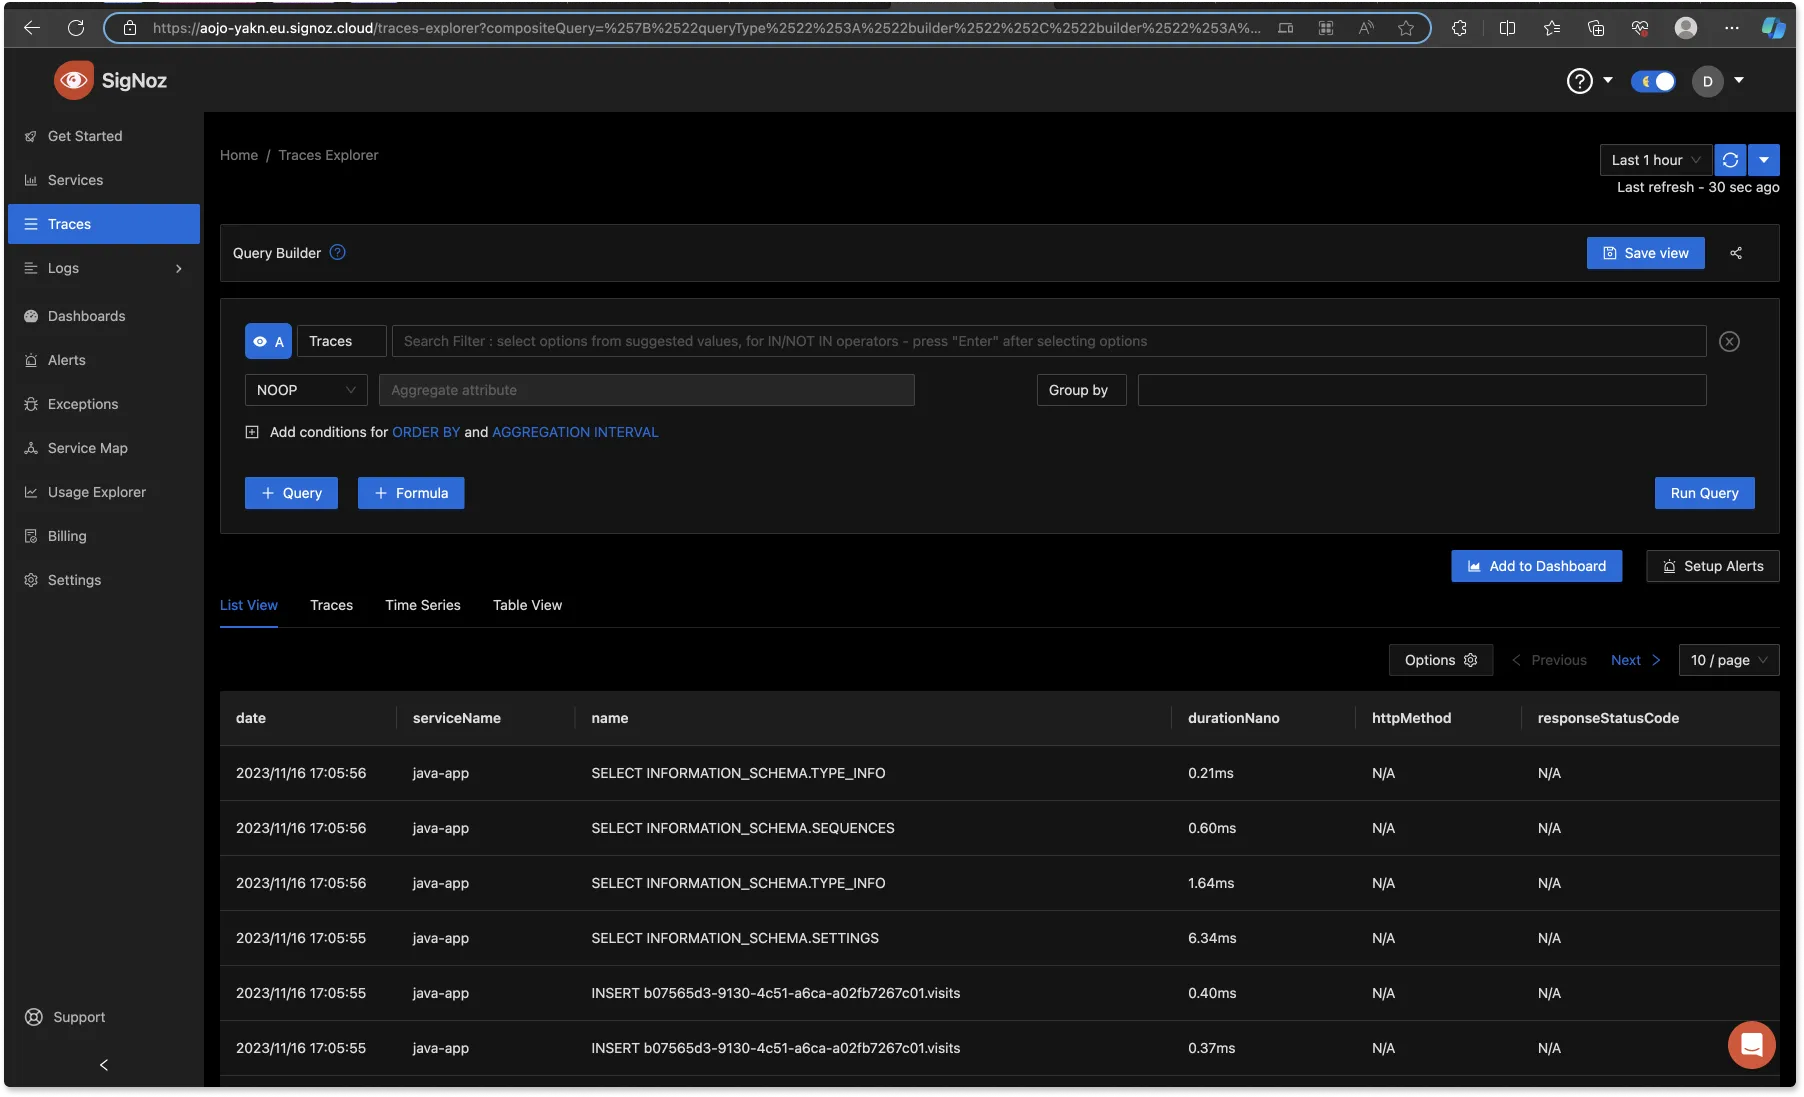
In the ‘Search Filter” input box, set your filter to ‘httpMethod=GET’ with the duration at 1hr and run the query. This will return every GET request that was generated within the last 1hr.
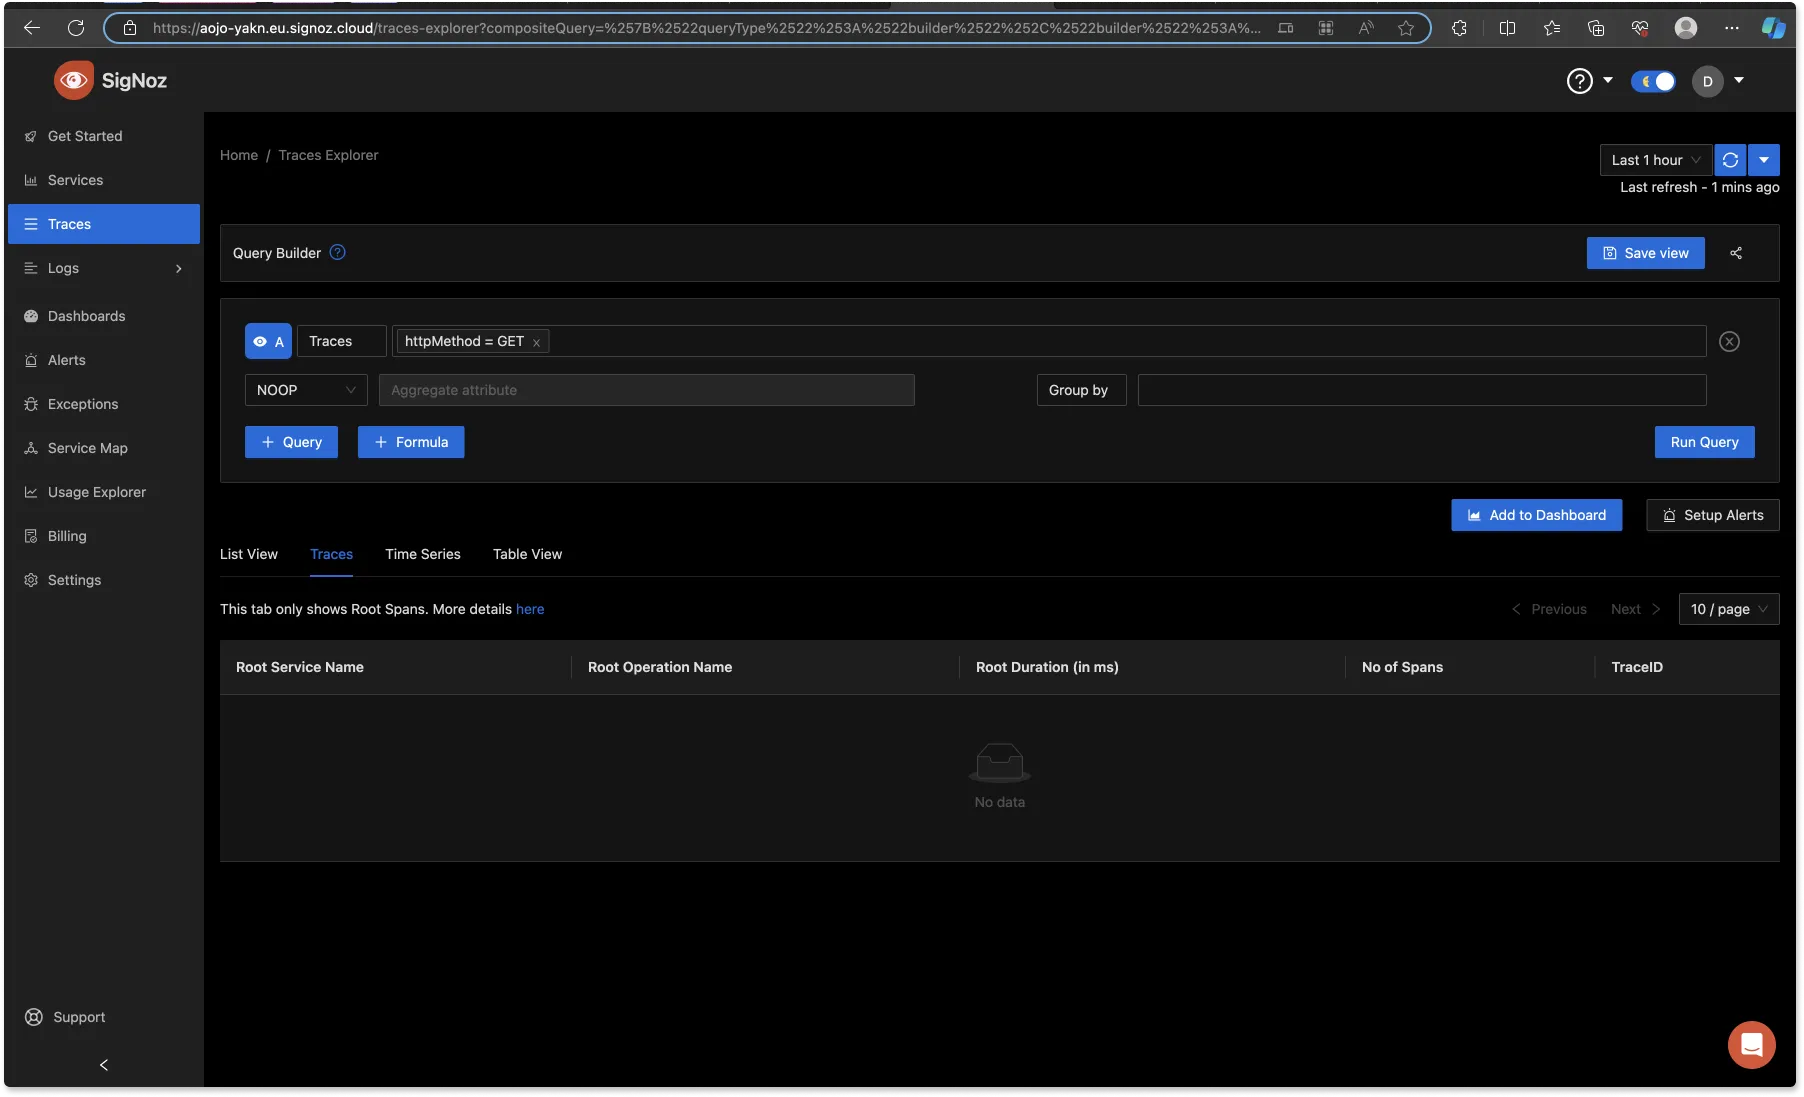
From the above image, no GET request was returned. This is because the Java application hasn’t been accessed at http://localhost:8090 yet. To generate an HTTP GET request, visit the application at http://localhost:8090 and try to refresh it one or two times. After that, on your SigNoz dashboard, still on the Traces Explorer page, change the duration to the ‘Last 5 min’, give it some time, and then run the same query again. You should see the GET requests you generated.
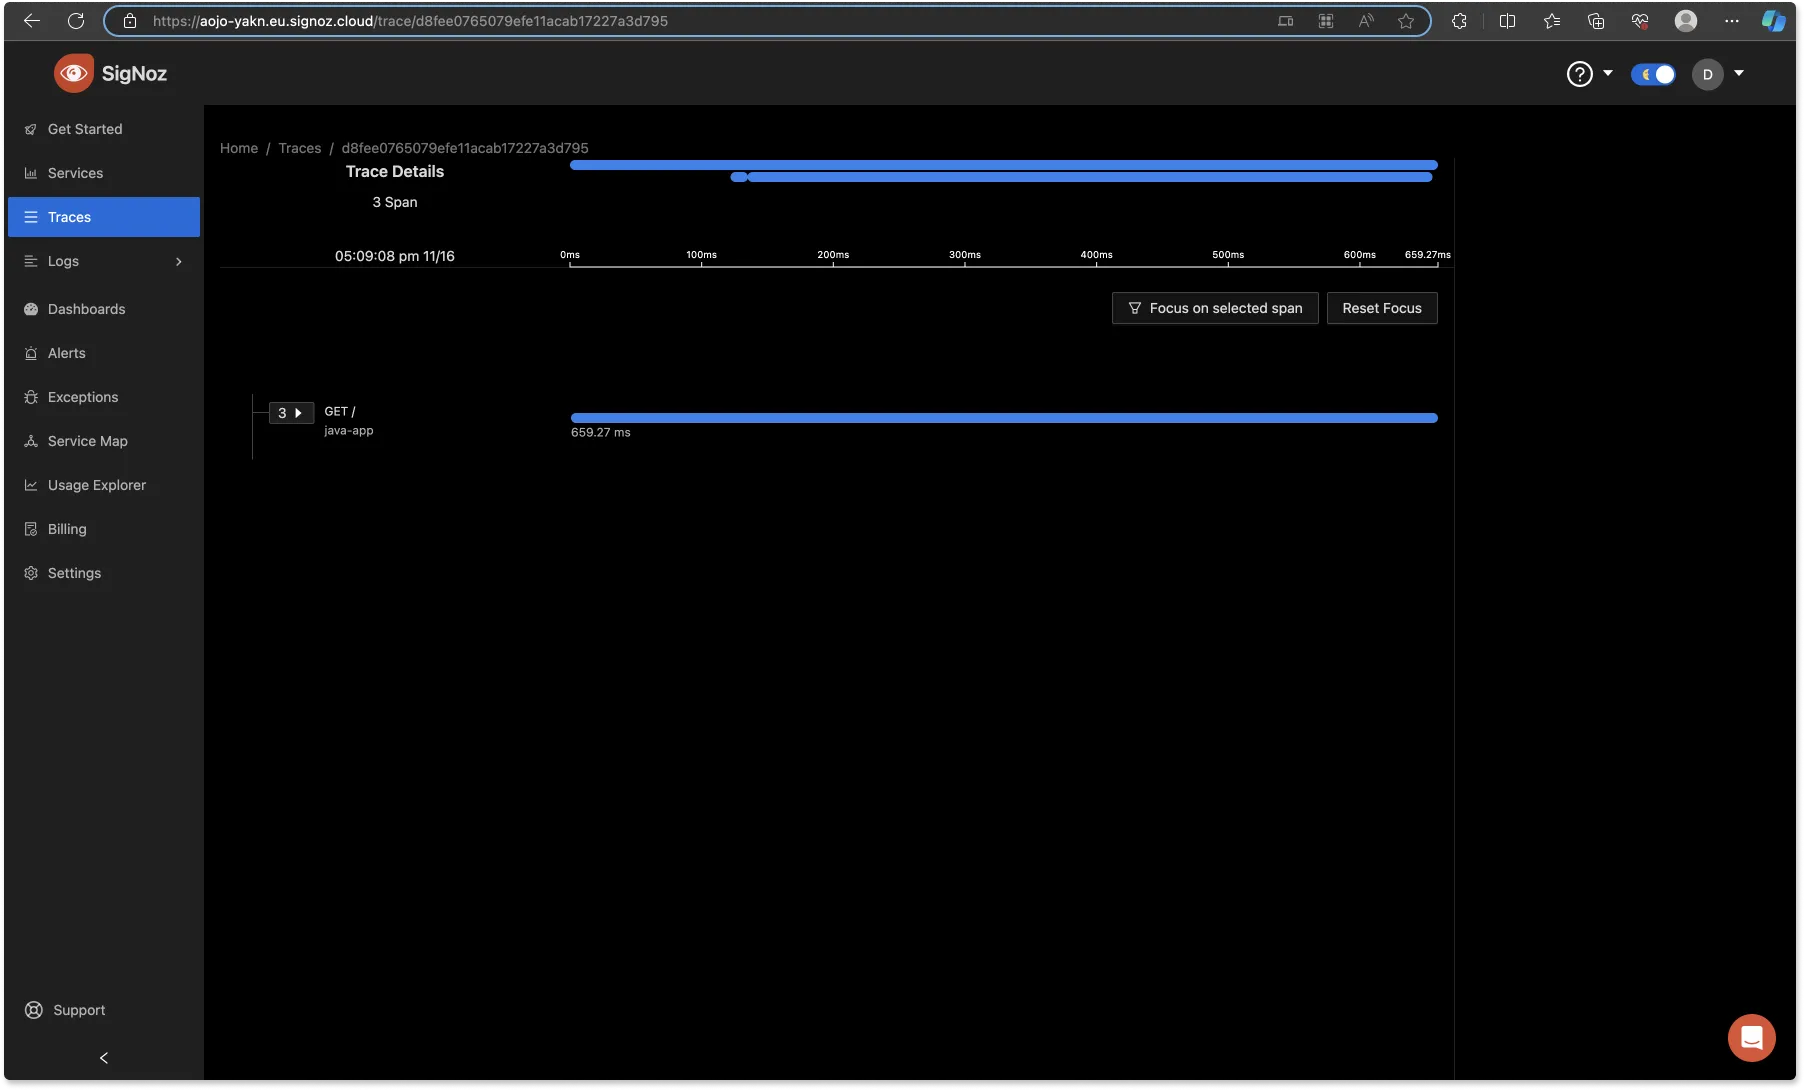
Click on the ‘Trace ID’ of any of the traces. From the below image, at the top, you can see the ‘Trace Details’ of that particular trace, showing that it has three spans, which were the GET requests.
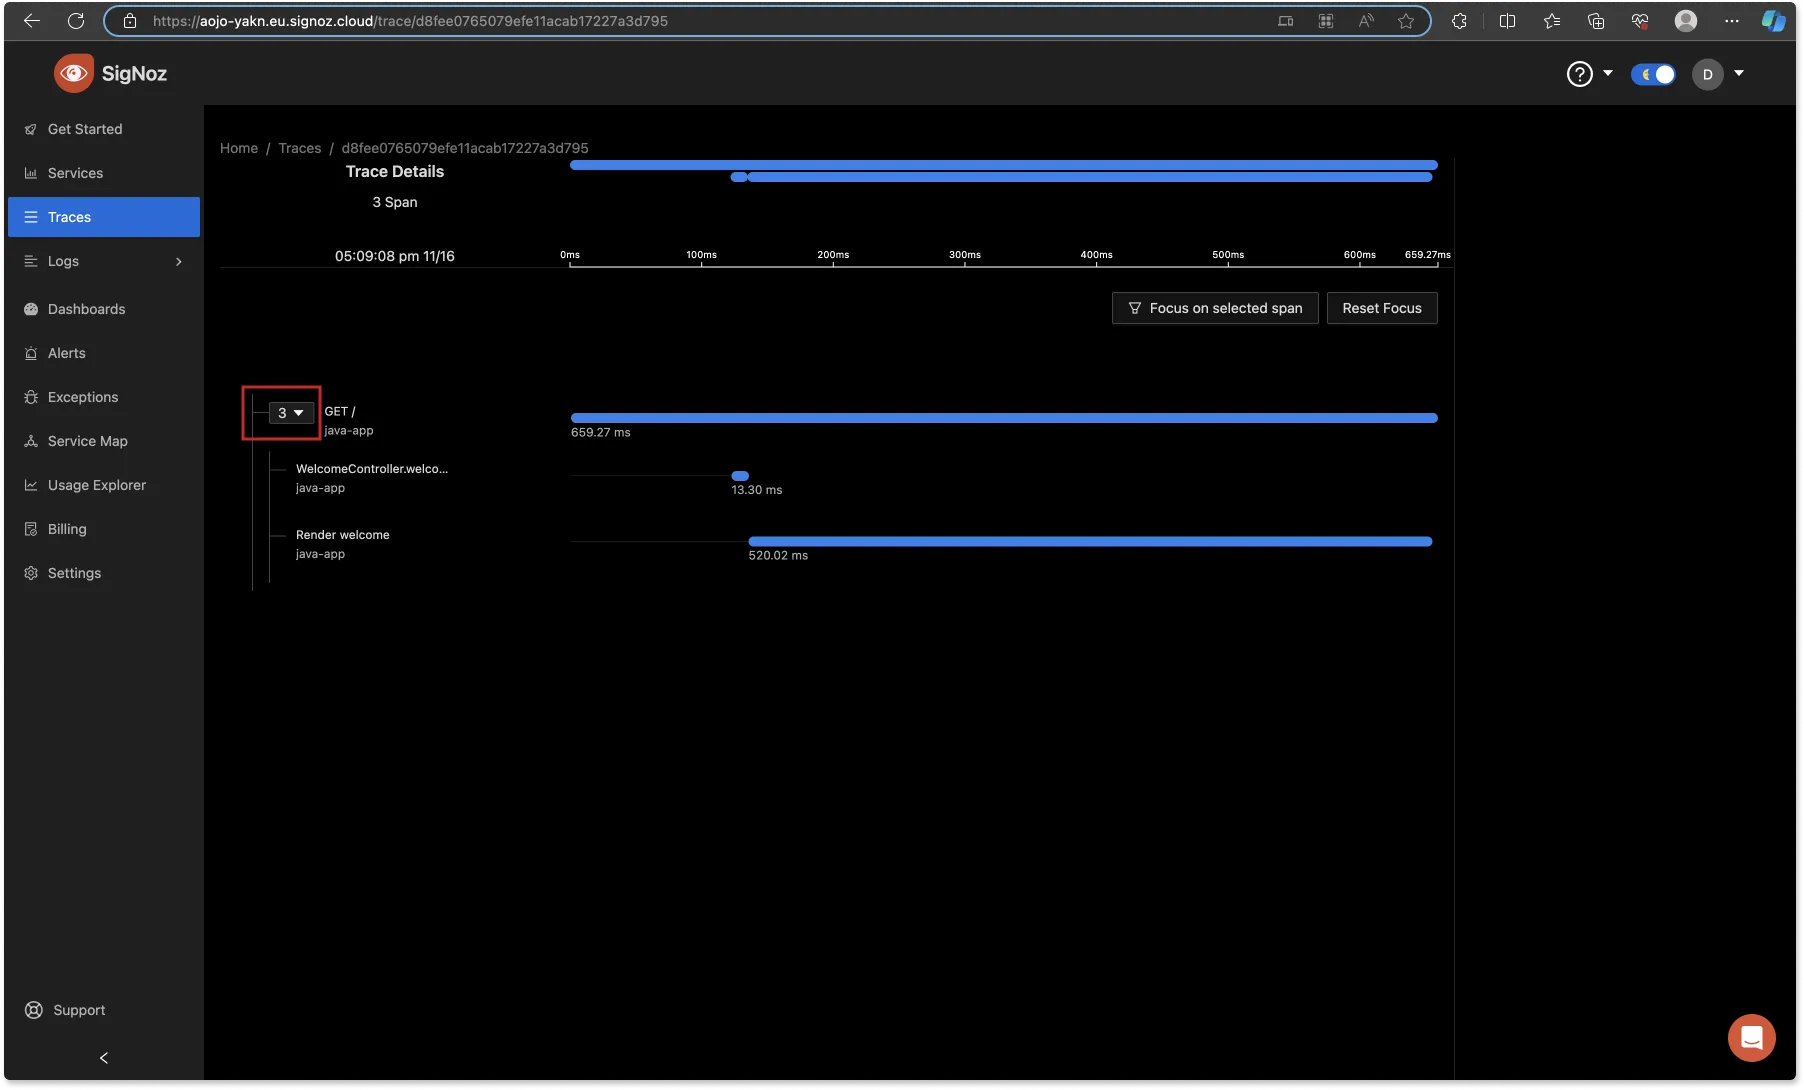
Click on the ‘drop-down’ arrow to see each span and the duration.
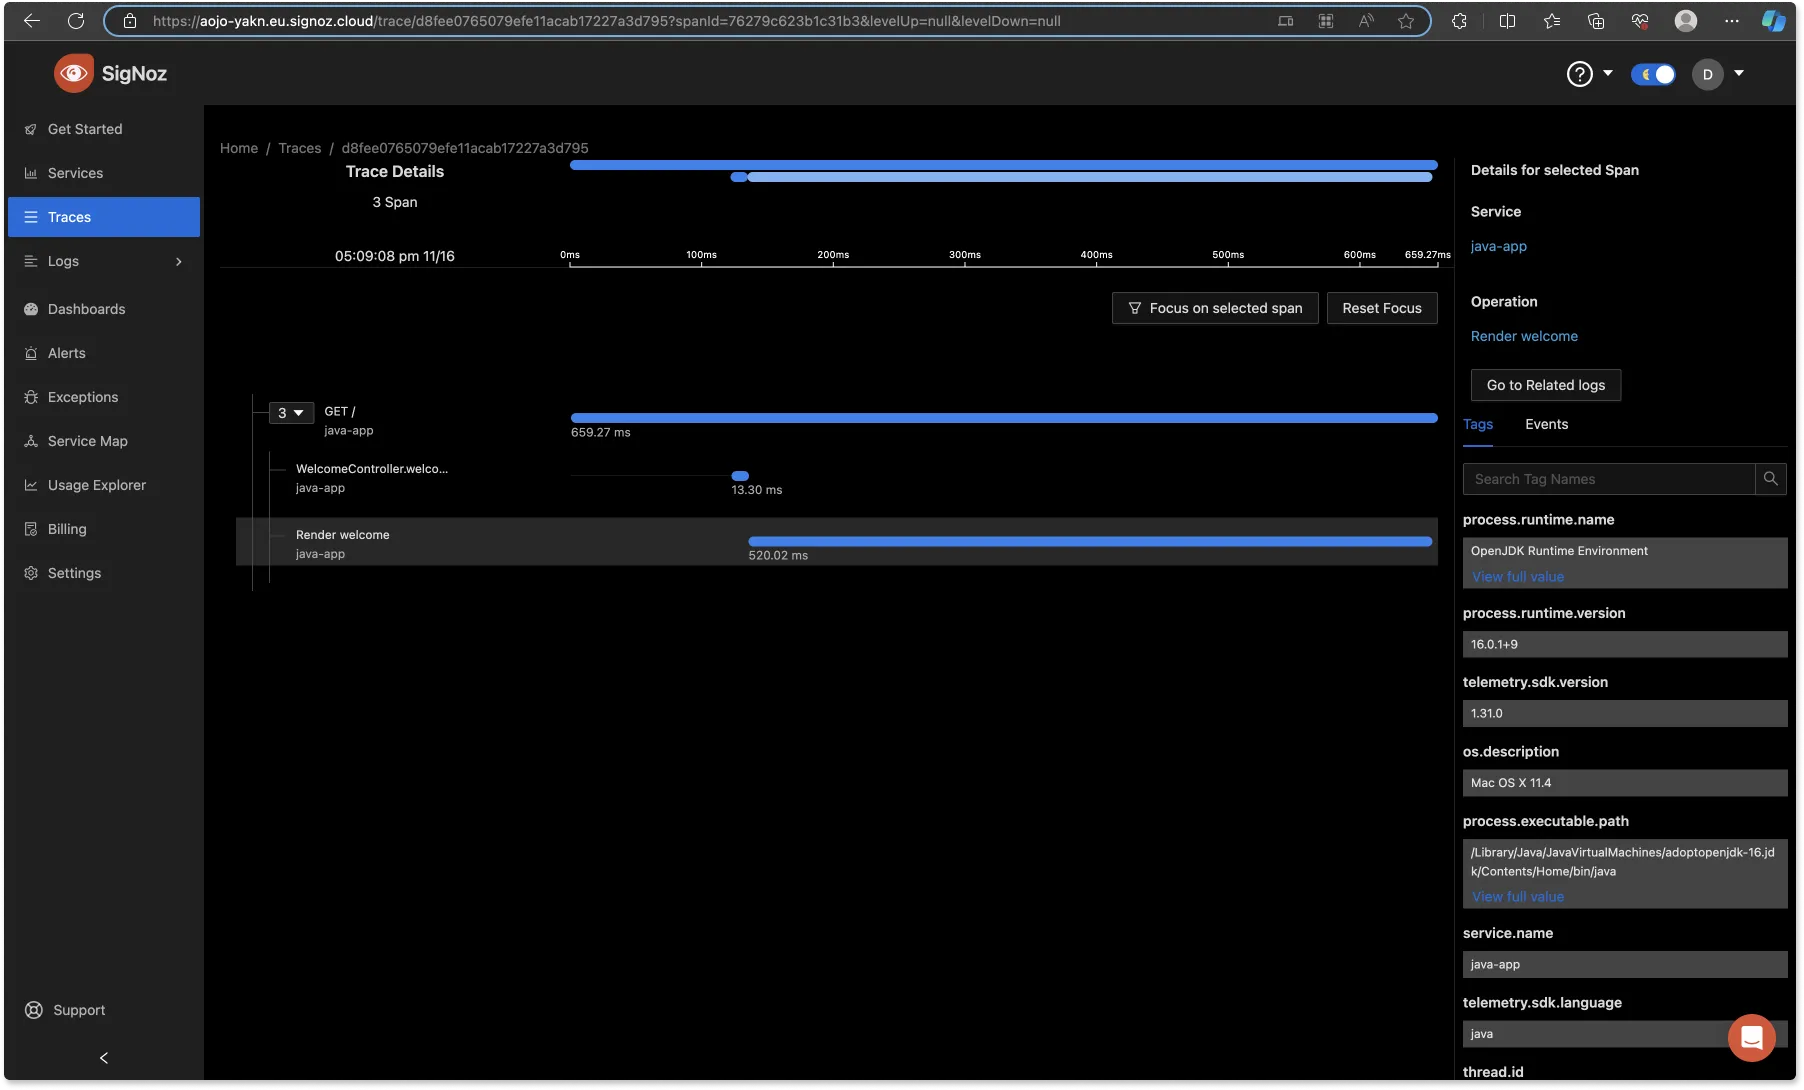
To get more information from a span, you can click on it. This provides you with the name of the Service that the span came from, the operation, and resource attributes.
SigNoz also uses the trace data to report key application metrics like p99 latency, request rates, and error rates with out-of-box charts and visualization.
Conclusion
In this article, you learned to instrument a Java application with OpenTelemetry and visualize traces from the application using SigNoz, a full-stack observability backend solution. SigNoz stands out as an excellent choice for robust observability needs, providing powerful tools to visualize telemetry data and address various observability requirements seamlessly.
Some of the things SigNoz can help you track:
- Application overview metrics like RPS, 50th/90th/99th Percentile latencies, and Error Rate
- Slowest endpoints in your application
- See exact request trace to figure out issues in downstream services, slow DB queries, call to 3rd party services like payment gateways, etc.
- Filter traces by service name, operation, latency, error, tags/annotations.
- Run aggregates on trace data
- Unified UI for both metrics and traces
Further Reading
