Implementing OpenTelemetry with Nginx - Instrument and visualize traces
OpenTelemetry is an open-source standard for instrumenting cloud-native applications for generating different types of telemetry data. A robust observability framework set up using OpenTelemetry can help tremendously while troubleshooting software in production.
Nginx is one of the most widely adopted web servers. Most often, nginx is used as a reverse proxy. It serves the frontend or backend applications behind the reverse proxy. In this tutorial, we will learn how to instrument nginx web servers with OpenTelemetry for traces. We will illustrate how to use the OpenTelemetry module, build an nginx container image, deploy it to Kubernetes, and view the traces using SigNoz.
What is OpenTelemetry and Why Use it with Nginx?
OpenTelemetry is an open-source observability framework that provides a standardized way to collect and export telemetry data. It combines distributed tracing, metrics collection, and logging into a single, cohesive system.
Nginx, a high-performance web server and reverse proxy, plays a critical role in many web architectures. By integrating OpenTelemetry with Nginx, you gain:

Quick Start Guide: OpenTelemetry with Nginx
Follow these steps to quickly set up OpenTelemetry with Nginx:
-
Install OpenTelemetry module for Nginx
apt-get update && apt-get install -y nginx-otel-module -
Configure Nginx with OpenTelemetry Add the following to your
nginx.conf:load_module modules/ngx_http_opentelemetry_module.so; http { opentelemetry_config /etc/nginx/opentelemetry_config.yaml; } -
Create OpenTelemetry configuration In
/etc/nginx/opentelemetry_config.yaml:service_name: nginx-service sampler: type: always_on exporter: otlp: endpoint: http://localhost:4317 -
Start OpenTelemetry Collector
otelcol --config=/etc/otel-collector-config.yaml -
Restart Nginx
systemctl restart nginx -
Verify setup Check Nginx error logs for OpenTelemetry initialization messages:
tail -f /var/log/nginx/error.log
You should now see OpenTelemetry data being collected from your Nginx server!
The architecture of the setup
The architecture of the setup used for the tutorial is given below.
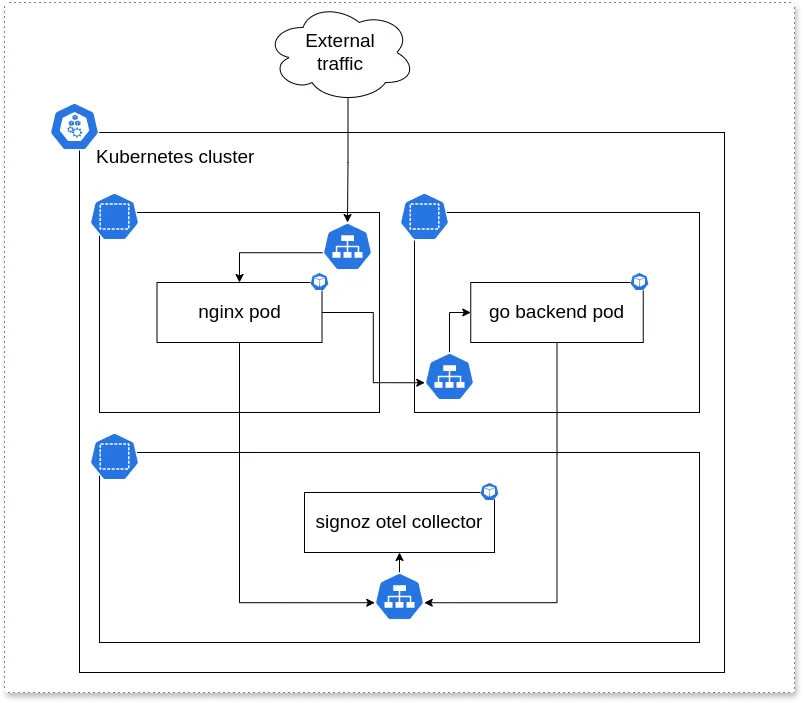
The setup consists of:
- Three namespaces: nginx, backend, and platform (SigNoz)
- Nginx serves as a reverse proxy (nginx namespace)
- Go backend which does real work (go-backend namespace)
- SigNoz collector collecting the traces (platform namespace)
At the end of the tutorial, setup will be able to track the request from nginx to Go backend.
Installing SigNoz
SigNoz Cloud is the easiest way to run SigNoz. Sign up for a free account and get 30 days of unlimited access to all features.

You can also install and self-host SigNoz yourself since it is open-source. With 24,000+ GitHub stars, open-source SigNoz is loved by developers. Find the instructions to self-host SigNoz.
We will install SigNoz by deploying it with Helm charts.

- Running Kubernetes cluster (>= 1.21 version)
- 8GB of memory
- 4 CPU cores
- 30 GB of storage
If you have your own cluster, you can use it. Otherwise, you can follow the instructions from the repository itself to run a fully functional cluster using multipass and k3s.
GitHub: Demo for OpenTelemetry using Nginx, Go and Signoz.
In the README you can find detailed instructions on how to install the local Kubernetes cluster. Navigate to the root of the repository and hit the next commands (for Linux).
snap install multipass
git clone <https://github.com/SigNoz/opentelemetry-nginx-tutorial.git>
cd opentelemetry-nginx-tutorial
./start.sh
After a while, you will have a fully functional SigNoz platform installed on Kubernetes in the multipass machine.
ubuntu@k3s:~/opentelemetry-nginx-tutorial$ k get pods -n platform
NAME                                                READY   STATUS    RESTARTS   AGE
signoz-clickhouse-operator-774d4d6cc-xhf2t          2/2     Running   0          38h
signoz-k8s-infra-otel-deployment-5dfdd7899d-9d9kd   1/1     Running   0          38h
signoz-zookeeper-0                                  1/1     Running   0          38h
signoz-k8s-infra-otel-agent-tnlpj                   1/1     Running   0          38h
chi-signoz-clickhouse-cluster-0-0-0                 1/1     Running   0          38h
signoz-query-service-0                              1/1     Running   0          38h
signoz-otel-collector-d69d59d68-nqx48               1/1     Running   0          38h
signoz-otel-collector-metrics-789475976f-w86bz      1/1     Running   0          38h
signoz-alertmanager-0                               1/1     Running   0          38h
signoz-frontend-57bb96c66f-ch22x                    1/1     Running   0          38h
Now let's see how to build the nginx container image with the OpenTelemetry module.
Building nginx with the OpenTelemetry module
All the container images are located in package/docker directory. Let's inspect the nginx Dockerfile.
FROM nginx:1.23.1
RUN apt-get update ; apt-get install unzip
ADD <https://github.com/open-telemetry/opentelemetry-cpp-contrib/releases/download/webserver%2Fv1.0.3/opentelemetry-webserver-sdk-x64-linux.tgz> /opt
RUN cd /opt; tar xvzf opentelemetry-webserver-sdk-x64-linux.tgz
RUN cd /opt/opentelemetry-webserver-sdk; ./install.sh
ENV LD_LIBRARY_PATH=$LD_LIBRARY_PATH:/opt/opentelemetry-webserver-sdk/sdk_lib/lib
RUN echo "load_module /opt/opentelemetry-webserver-sdk/WebServerModule/Nginx/1.23.1/ngx_http_opentelemetry_module.so;\\n$(cat /etc/nginx/nginx.conf)" > /etc/nginx/nginx.conf
COPY opentelemetry_module.conf /etc/nginx/conf.d
COPY nginx.conf /etc/nginx/conf.d/default.conf
This is the example taken from the OpenTelemetry docs on how to instrument nginx with OpenTelemetry.
The lines we are interested in are:
COPY opentelemetry_module.conf /etc/nginx/conf.dCOPY nginx.conf /etc/nginx/conf.d/default.conf
The first copy is referring to the configuration of the OpenTelemetry module of the nginx. This is where you can tweak all the config options of the instrumentation itself.
NginxModuleEnabled ON;
NginxModuleOtelSpanExporter otlp;
NginxModuleOtelExporterEndpoint signoz-otel-collector.platform:4317;
NginxModuleServiceName NginxService;
NginxModuleServiceNamespace nginx;
NginxModuleServiceInstanceId NginxInstanceId;
NginxModuleResolveBackends ON;
NginxModuleTraceAsError ON;
We are using otlp exporter and exporting the traces to the SigNoz collector already installed in the platform namespace at signoz-otel-collector.platform:4317. That's the place where the SigNoz collector is living in our setup.
Building this docker image is easy as a docker build. If you want to build an nginx docker image with enabled opentelemetry support you can run the next command in the shell. Nginx configuration file nginx.conf and opentelemetry_module.conf must be located in the same directory where Dockerfile is located. See the package/docker/nginx directory for reference.
docker build --tag nginx-otel:latest .
Otherwise, to be able to use it in our local Kubernetes instance, you can run build.sh and then deploy.sh from the multipass machine.
It will deploy the custom-built docker nginx image to the nginx namespace.
ubuntu@k3s:~/opentelemetry-nginx-tutorial$ k get pods -n nginx
NAME                     READY   STATUS    RESTARTS   AGE
nginx-845947d9f8-g2rhc   1/1     Running   0          3s
Building Go backend with tracing enabled
We will build a simple GO API to handle multiple endpoints. Tracing will be enabled on the /getEntry/{id} endpoint.
Same as for the nginx, the whole solution is located in the package directory at the root of the repository.
In the internal/config/config.go, the setupTracing function will create a tracing exporter to be used globally in the application. The configuration of the traces is configured here, and you can tweak the options.
In the internal/handler/handler.go in the function GetEntry() we will refer to this exporter and export span to the SigNoz otel collector.
The endpoint of the SigNoz collector is configured in the config/env-default COLLECTOR=signoz-otel-collector.platform:4317.
You can tweak the endpoint there.
So basically, what happens next:
- The user hits the endpoint /getEntry/1 for eg.
- The service will trigger the handler function GetEntry()
- Span will be started using a global tracer exporter
- At the end of the method, the span will be closed, and traces will be exported to the SigNoz otel collector.
After deploying both nginx and go backend we can inspect the traces directly on the SigNoz frontend.
Inspecting traces with SigNoz
Since Kubernetes is using multipass and k3s for the running cluster itself additional tweak is needed to expose the SigNoz frontend.
➜  ~ multipass list
Name                    State             IPv4             Image
k3s                     Running           10.117.145.50    Ubuntu 22.04 LTS
                                          172.17.0.1
                                          10.42.0.0
                                          10.42.0.1
➜  ~ sudo -- /bin/sh -c ' echo "10.117.145.50 signoz.local" >> /etc/hosts'
Since we are using Traefik and ingresses for the distinction on the cluster we will expose signoz.local as the entry point for the SigNoz frontend.
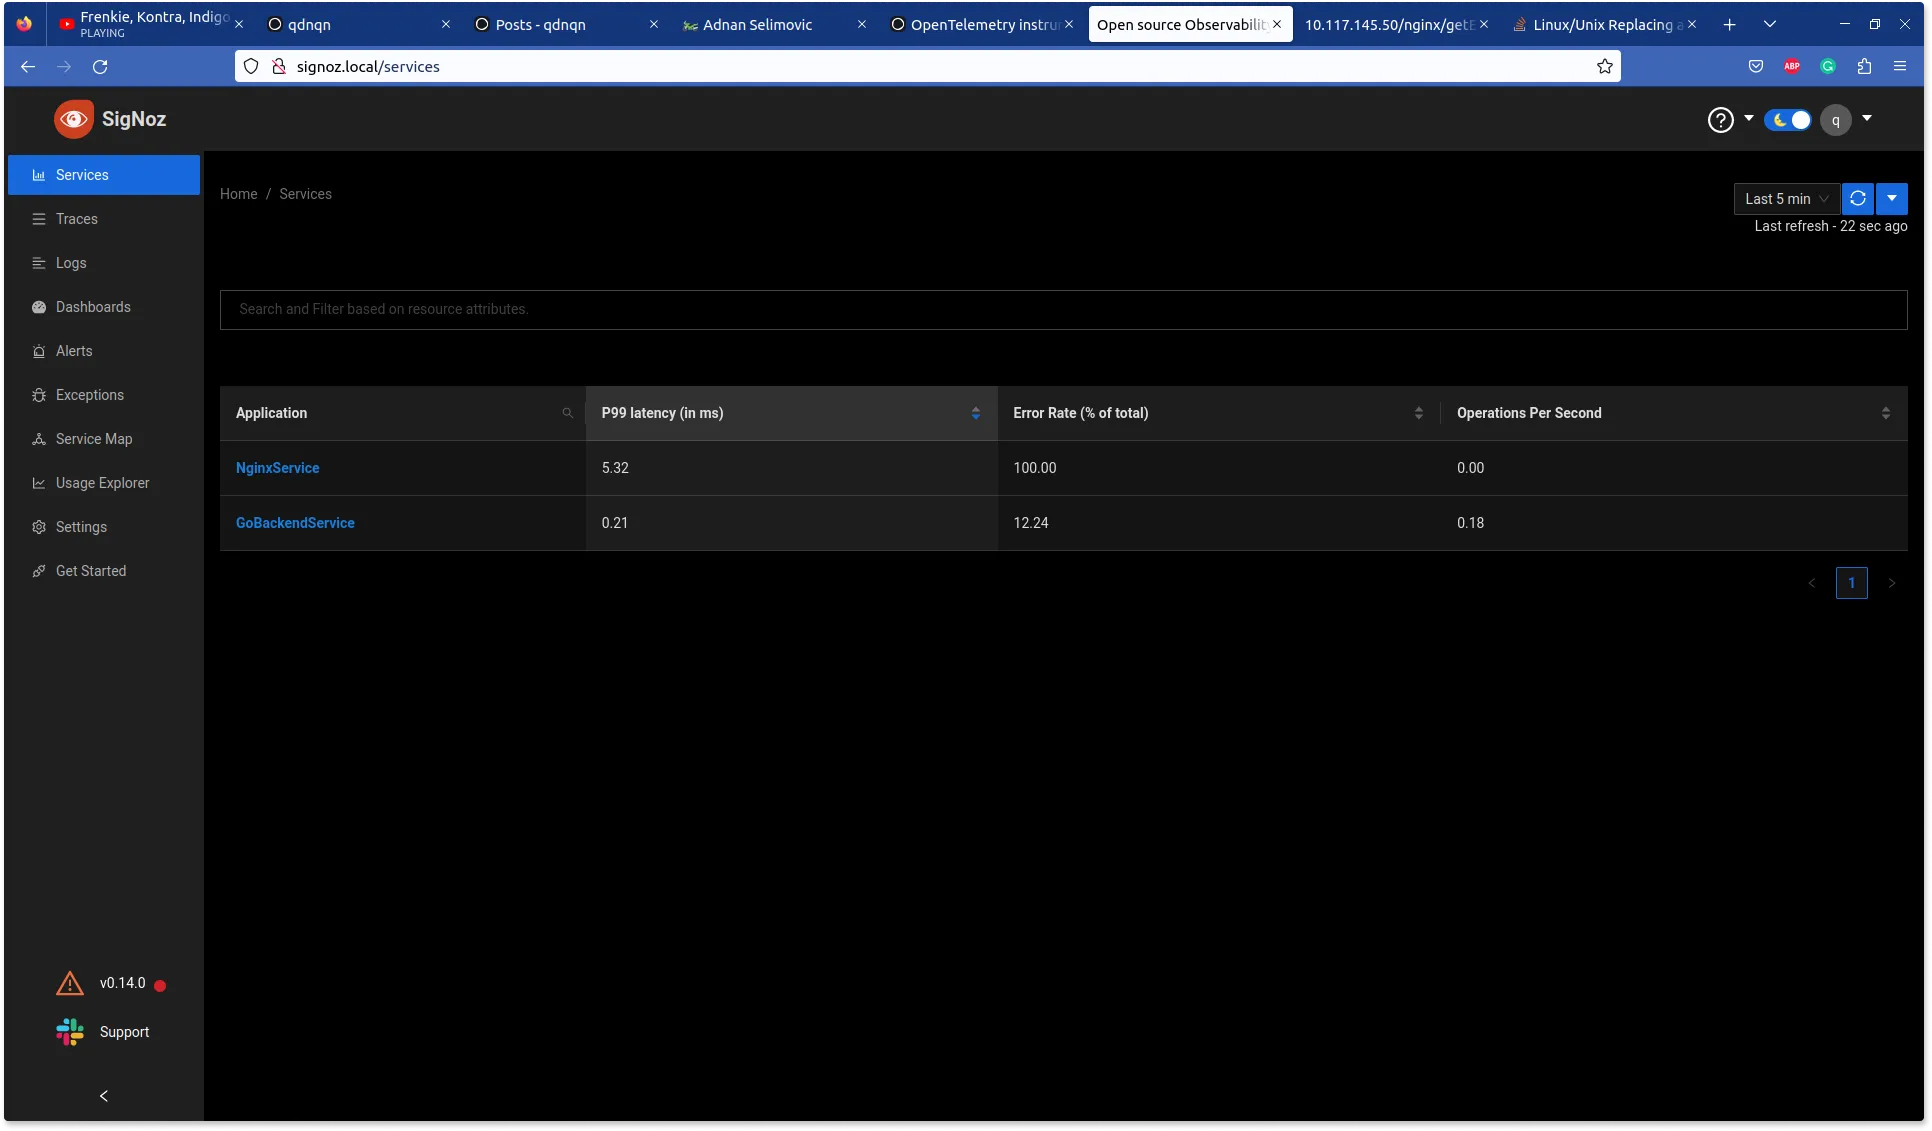
As you can see on the SigNoz UI we have two services:
- Our nginx
- And GO backend
So SigNoz was able to detect those services great. Let's hit the endpoint to get entry 1.
➜  ~ multipass list
Name                    State             IPv4             Image
k3s                     Running           10.117.145.50    Ubuntu 22.04 LTS
                                          172.17.0.1
                                          10.42.0.0
                                          10.42.0.1
➜  ~ curl 10.117.145.50/nginx/getEntries/1
Entry doesn't exists.
Let's inspect the traces on the SigNoz UI.
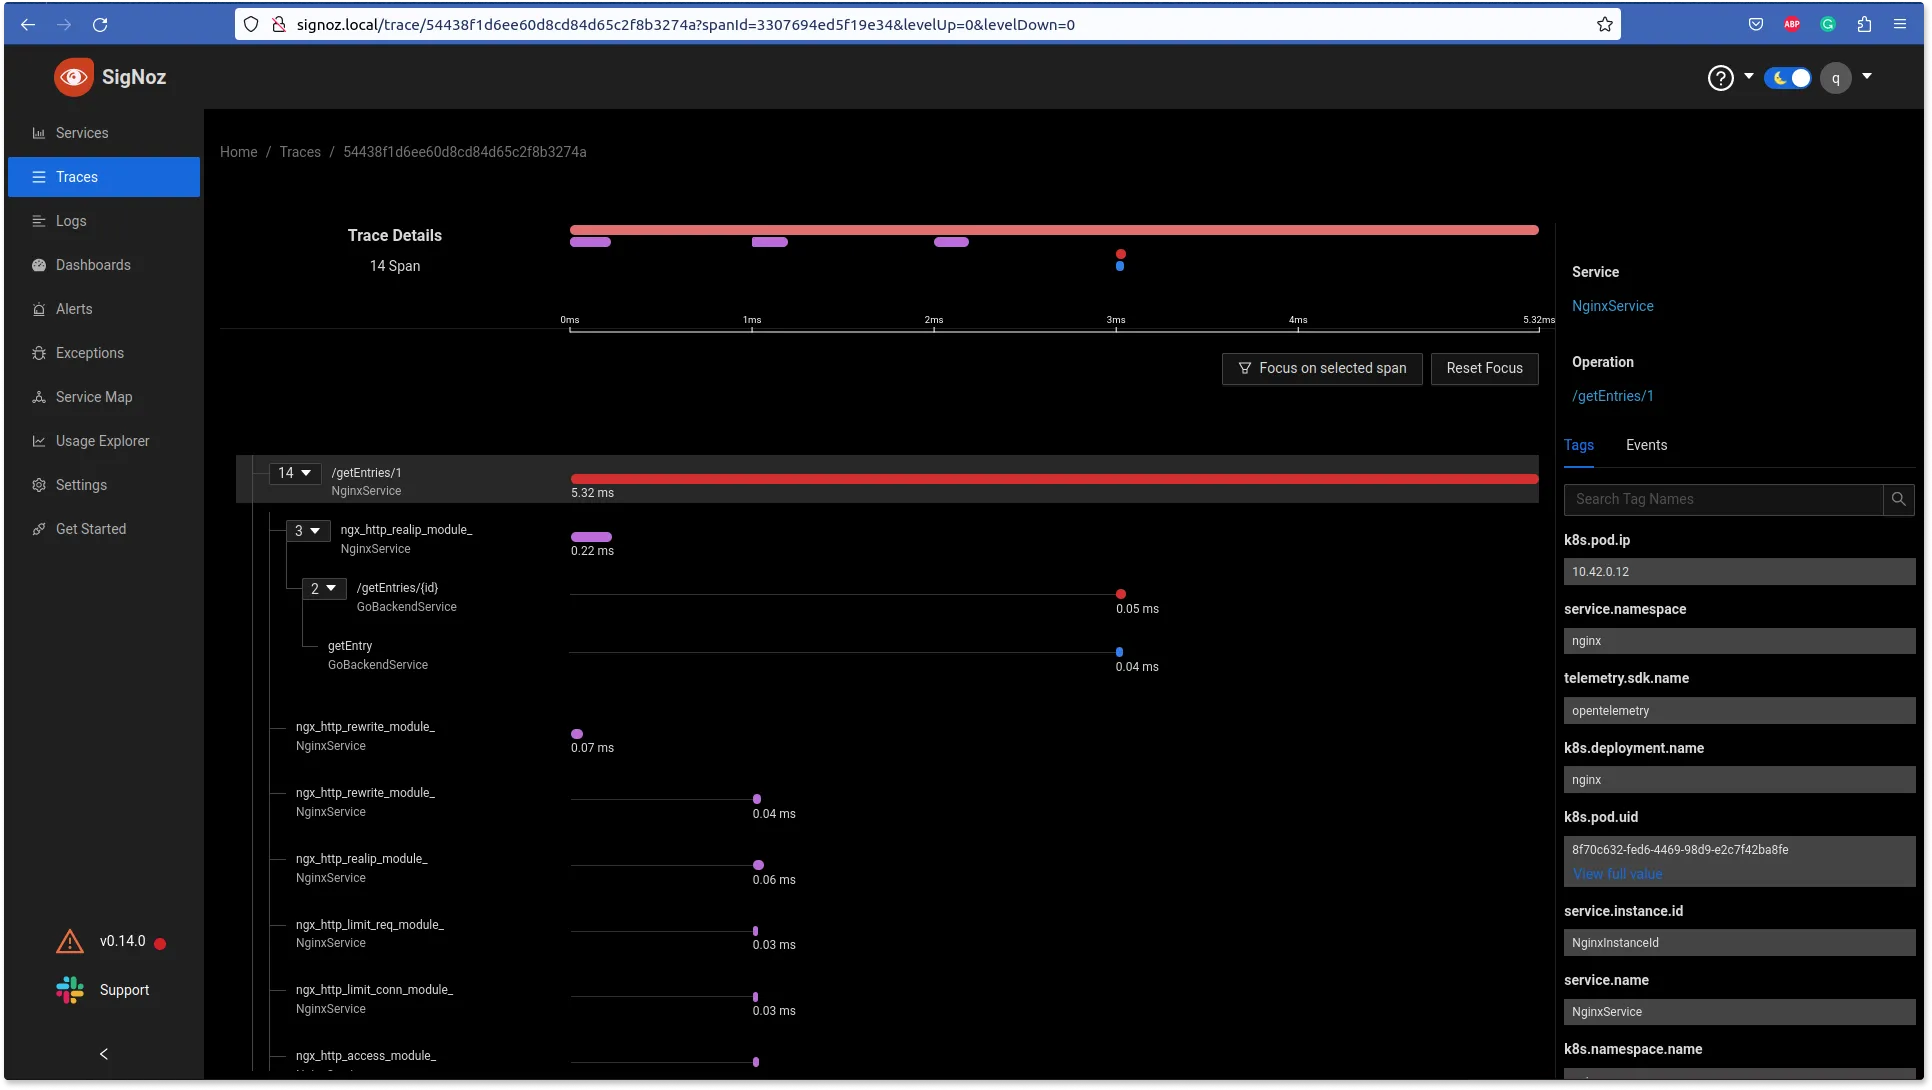
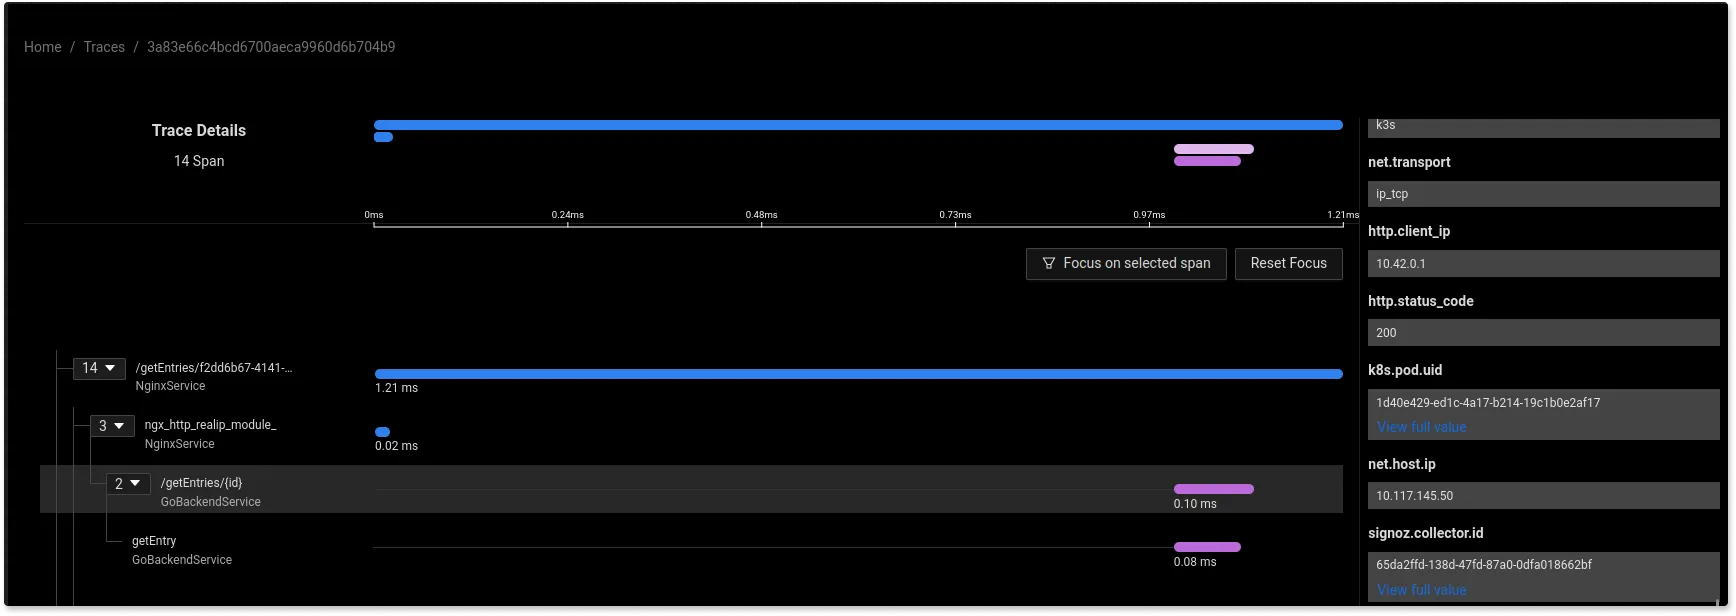
As can be seen in the picture, the requests are traveling through the nginx to the backend application. The distributed tracing shows 14 spans for a single request. Spans are fundamental building blocks of distributed tracing. A single trace in distributed tracing consists of a series of tagged time intervals known as spans.
It returns the 500 error since the API returns 500 for nonexistent entries.
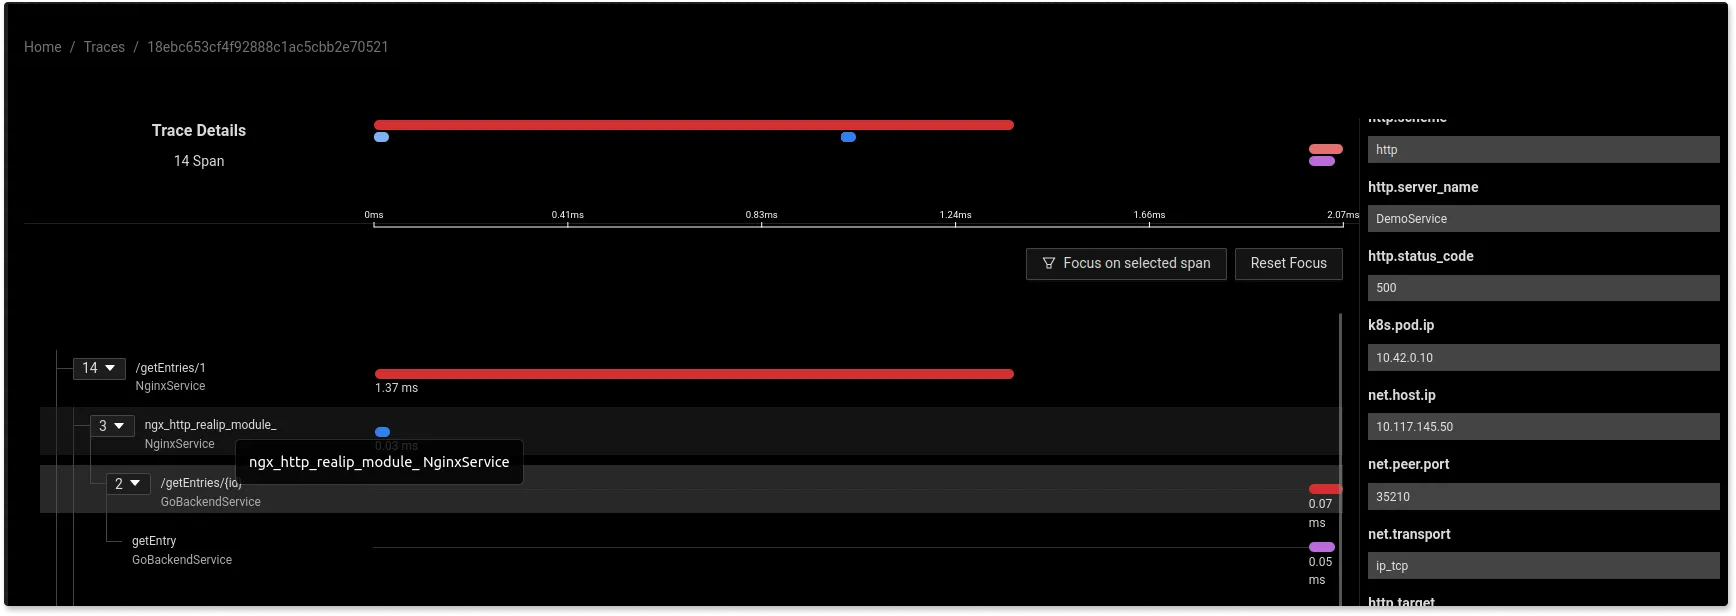
If we’re hitting the right endpoint, the http_status_code shows 200.
Traces give you a detailed view of how requests are performing across each
As you can see you can easily navigate and find your traces in the UI to inspect the outcome of the steps you have an interest in.
Troubleshooting Common Issues in OpenTelemetry Nginx Setup
When implementing OpenTelemetry with Nginx, you might encounter some challenges. Here are solutions to common issues:
- Module compatibility problems: Ensure your Nginx version is compatible with the OpenTelemetry module. If you're using a custom-built Nginx, rebuild it with the
-add-dynamic-moduleoption pointing to the OpenTelemetry module source. - Configuration errors: Double-check your
nginx.confand OpenTelemetry configuration files for syntax errors. Usenginx -tto test your Nginx configuration before restarting the service. - Trace context propagation issues: Verify that the
opentelemetry_propagatedirective is correctly set in your Nginx configuration. Ensure that your backend services are properly extracting and injecting trace context headers. - Performance optimization: For high-traffic scenarios, consider:
- Adjusting the sampling rate in your OpenTelemetry configuration
- Using batch processing for trace and metric exports
- Optimizing your Nginx configuration for performance (e.g., worker processes, keepalive connections)
Best Practices for OpenTelemetry Implementation with Nginx
To ensure a robust and effective OpenTelemetry setup with Nginx:
- Secure your implementation:
- Use TLS for all communications between Nginx, the OpenTelemetry Collector, and your backend
- Implement proper access controls for your observability data
- Scale for large deployments:
- Use a distributed tracing backend that can handle your data volume
- Consider using a separate OpenTelemetry Collector cluster for data processing and forwarding
- Implement effective sampling strategies:
- Use tail-based sampling for more representative trace collection
- Adjust sampling rates based on your traffic patterns and observability needs
- Continuously monitor and improve:
- Regularly review your traces and metrics to identify optimization opportunities
- Keep your OpenTelemetry components and configurations up to date
By following these practices, you'll create a robust, scalable observability solution that provides deep insights into your Nginx-based infrastructure.
OpenTelemetry vs Other Observability Solutions for Nginx
When choosing an observability solution for Nginx, it's important to consider various factors. Here's a comparison of OpenTelemetry with other popular options:
| Feature | OpenTelemetry | Nginx Plus | Datadog | ELK Stack |
|---|---|---|---|---|
| Open Source | Yes | No | No | Yes |
| Vendor Neutral | Yes | No | No | Partially |
| Distributed Tracing | Yes | Limited | Yes | Yes (with APM) |
| Metrics Collection | Yes | Yes | Yes | Yes |
| Log Management | Yes | Yes | Yes | Yes |
| Custom Instrumentation | Yes | Limited | Yes | Yes |
| Language Support | Extensive | N/A | Extensive | Extensive |
| Ease of Integration | Moderate | Easy | Easy | Moderate |
| Scalability | High | Moderate | High | High |
| Community Support | Strong | Limited | Strong | Strong |
| Cloud-Native Support | Excellent | Good | Excellent | Good |
| Cost | Free (excl. backend) | Paid | Paid | Free (self-hosted) |
Key Takeaways:
- OpenTelemetry offers the most flexibility and vendor neutrality
- SigNoz, an open-source APM built on OpenTelemetry, provides powerful visualization and analysis capabilities for Nginx monitoring
- Nginx Plus provides tight integration but is limited to Nginx-specific monitoring
- Datadog offers a comprehensive SaaS solution but at a higher cost
- ELK Stack provides a powerful open-source alternative but requires more setup
Choose the solution that best fits your specific needs, considering factors like existing infrastructure, budget, and required features.
Key Takeaways
- OpenTelemetry provides a unified approach to observability for Nginx
- Proper setup and configuration are crucial for effective monitoring
- Distributed tracing offers insights into complex microservices architectures
- Metrics collection helps in performance monitoring and capacity planning
- SigNoz simplifies visualization and analysis of OpenTelemetry data
FAQs
What are the system requirements for implementing OpenTelemetry with Nginx?
OpenTelemetry with Nginx requires:
- Nginx version 1.18.0 or higher
- A compatible OpenTelemetry Collector
- Sufficient system resources to handle the additional processing (exact requirements depend on your traffic volume)
How does OpenTelemetry impact Nginx performance?
The performance impact is generally minimal, typically less than 3% overhead. However, this can vary based on your configuration and traffic volume. Use sampling and optimize your setup to minimize any performance impact.
Can OpenTelemetry be used with Nginx in containerized environments?
Yes, OpenTelemetry works well in containerized environments. You can include the OpenTelemetry module in your Nginx container image and configure it to send data to a Collector running as a separate service in your container orchestration platform.
How does OpenTelemetry compare to other observability solutions for Nginx?
OpenTelemetry provides a more comprehensive and standardized approach compared to traditional solutions. It offers:
- A unified framework for traces, metrics, and logs
- Vendor-neutral data collection and export
- Extensive language and framework support
- A growing ecosystem of tools and integrations
This makes OpenTelemetry a more flexible and future-proof choice for Nginx observability.
Related Posts
