Did OpenTelemetry deliver on its promise in 2023?
OpenTelemetry has brought a sea change in the world of observability. The idea of the project was to standardize the instrumentation needed for generating telemetry. Teams shouldn’t need to change how they collect data if they want to try a new visualization/backend for the telemetry data. That was the vision.

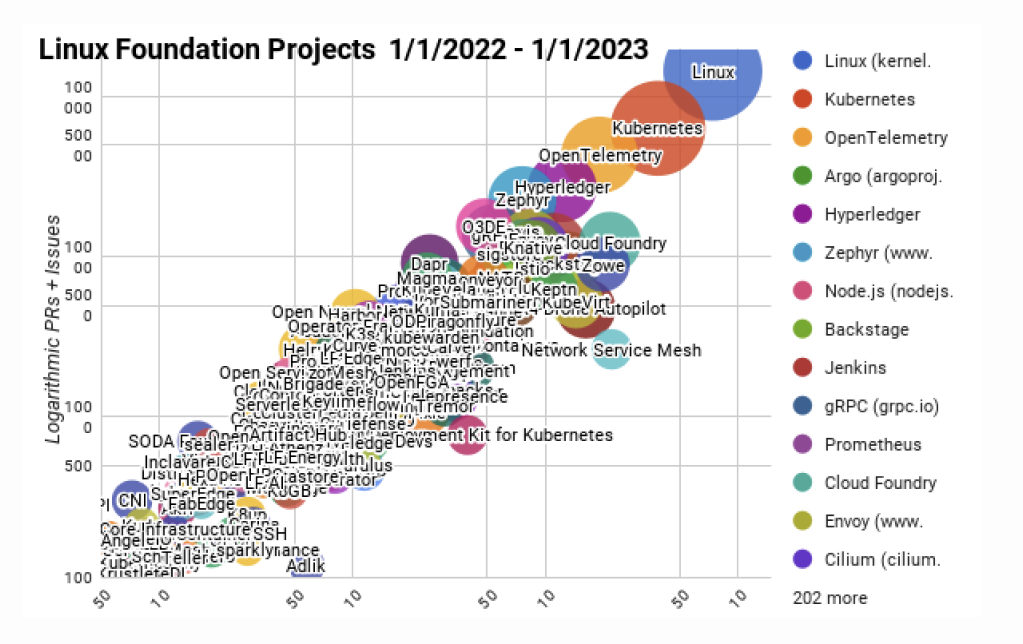
This idea seems to have resonated with the developer and devops communities. OpenTelemetry has become the 2nd most active CNCF project after Kubernetes and is seeing participation from many big companies like AWS, Google, Microsoft, Splunk, etc.
If you think about it, it makes sense. It helps companies be more future-proof and prevent scenarios like this, where users are left scrambling for alternatives when a proprietary product, which is a core part of their infrastructure, is suddenly shut down.
As a founder and maintainer of an OpenTelemetry native project (SigNoz) we are part of many conversations with users and customers trying to implement OpenTelemetry in the wild. I thought I would sit down and note the current state of OpenTelemetry as we enter 2024.
We also run OTEL APAC End user group meetup, so we hear many user stories on challenges they face as they try to adopt OpenTelemetry in their orgs.
OpenTelemetry is getting more adoption & becoming more mature
-
Enterprise-scale companies like EBay, Canva are moving to OpenTelemetry
-
People are able to handle massive scale with OpenTelemetry. Even with our experience with SigNoz customers and users, we have seen users easily send in the order of ~10-50TB/day logs and traces via OpenTelemetry SDKs and collectors, and it scales seamlessly.
-
Logs was announced to be GA in Kubecon NA 2023 (Nov 2023), which marks a big step for the project. Many organizations start their journey with observability with logs and this would help more companies adopt OTel at scale.
Learnings from OpenTelemetry APAC End Users meetup group
As I mentioned, we also run OpenTelemetry APAC meetup group. Some of the key themes users have:
-
How to setup OpenTelemetry at scale
The current OTel documentation is focused on sending logs/traces/metrics data from individual applications to a backend. But when someone is deploying OpenTelemetry in their organizations - they need an understanding of the best practices to deploy it. e.g.
-
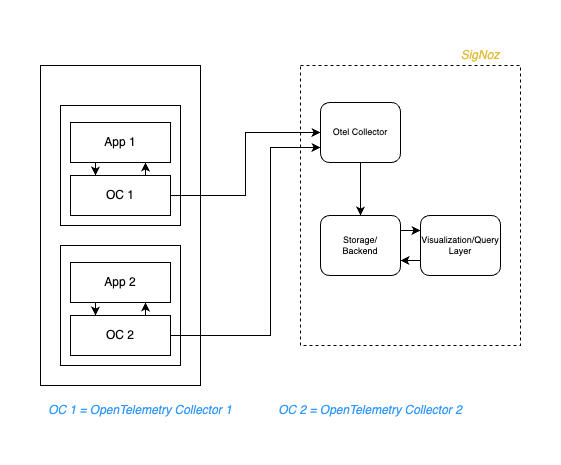
Should you send data directly to the o11y backend or via an OTel collector?
-
How many instances of otel-collectors should be run to handle their scale?
-
Should telemetry data be sent directly to OTel collector or should there be a queueing mechanism like Kafka in front? Here's a discussion on using Apache Kafka with OTel collector.
-
How should OTel collector be deployed in a k8s environment? What are the tradeoffs between having it as a daemonset or a sidecar?
Example Sidecar Pattern for collecting telemetry data in Kubernetes with SigNoz & OTel collectors -
-
Optimizing the value generated and cost involved
Once the applications are instrumented, the next question is how to optimize between the value generated and the cost involved. Generally, people want to implement some filtering mechanism of logs (e.g excluding healthcheck endpoints) or do sampling for traces. Esp. for tail based sampling for traces, people have many questions around how to do it correctly.
-
Evagelization within the org
Since Opentelemetry is still a new-ish project, people need more help in evangelizing it in their org. Questions like what are the advantages compared to the current solution, as introducing OpenTelemetry is an org-wide change in how people are doing observability. It would need buy-in from multiple stakeholders with their own concerns and vantage points.
As a community, we need to publish more success stories of organizations becoming successful with OTel and how they achieved it.
Other common questions were around confusion in understanding that OTel is just focused on getting telemetry data, and you still need a backend/visualization tool to get insight from this data. Here's a video trying to address the question of the difference between OpenTelemetry and observability backends.
Learnings from SigNoz users and customers
As we encounter many users and customers using SigNoz as the backend and visualization layer for OpenTelemetry data, we see many interesting use cases for OpenTelemetry. Some such use cases powered by Otel which SigNoz users find helpful are:
-
Leveraging OpenTelemetry semantic conventions
- At SigNoz, we deeply leverage OTel semantic conventions for showing views that would not be possible in non-otel native products. e.g. Something that many of our users and customers like a lot is the exceptions monitoring view created directly from traces data.
- Linking traces and logs is more easily possible by inserting and using
traceidfields in logs to show related logs to traces. This helps in correlating logs and traces easily and debugging issues faster.
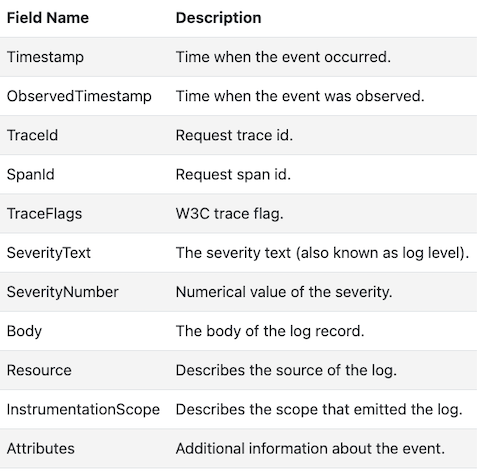
OpenTelemetry Logs Data Model -
Users are comfortable in doing manual instrumentation Since OpenTelemetry semantic conventions are GA, users are very comfortable doing manual instrumentation for parts of code which don’t get automatically instrumented. Being an open standard, they have the guarantee that any other backend vendor they choose will also support these manual instrumentations by default.
-
Switching to new o11y backends becomes very easy
We had an interesting incident where teams sending TBs of data per day were able to change the observability backend in a matter of few minutes as their code was already instrumented with OTel and the new backend also supported OTel. This is only possible because of the open source standards that OTel has developed. Otherwise just changing the observability backend would have been a 3-month project taking a lot of bandwidth from the team.
-
Willingness to invest time learning about OpenTelemetry
We see many teams being comfortable with learning Otel fundamentals, as they know once their teams gets understanding of the basics they can use any vendors taht support OTel and the basic constructs will remain the same. This is very different from the earlier era where each tool would have its own proprietary conventions, and changing backends would mean retraining the whole team
-
Better Control and Optimization with OTel
We have seen many customers use
filterprocessorin OTel collector to optimise their metrics cost. This was seamless and gave better control to users on which metrics to send. Also, OTel collector gives more controls over metrics and spans they want to send. For example, you can choose which type of metrics you want to send forhostmetricsreceiver. Most proprietary agents don’t give this flexibility to users.Better control: We have seen customers use include and exclude instrumentation of Java classes using annotation very easily.
-
Using Tracing for performance testing
We have seen some organizations use trace data to test the performance of their system to periodically test the end-to-end flow of the data and analyse performance. People deeply instrument their code and enable it for performance analysis only for a specific time when they want to do performance testing
-
More and more projects emitting telemetry in OTLP format
Open source products have started support for emitting telemetry data in OTLP format so that it can be used to better understand their performance. Some examples of such projects are ClickHouse, Hasura, Traefik, etc.
-
Using OTEL OpAMP framework for logs pipeline
We are amongst the early adopters of the OpAMP. It enables our customers to do operations with logs attributes from the UI. The logs pipelines UI provides the ability to create and manage the processors. SigNoz provides an easy-to-use UI to create and manage the processors which our users love, and OpAMP was a big part of successfully implementing it.
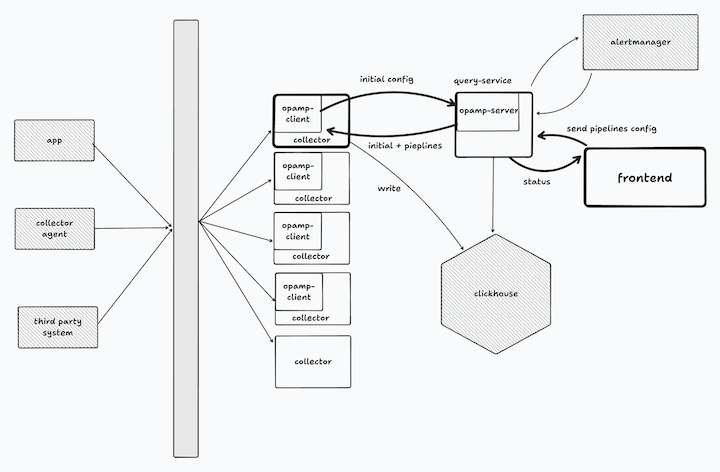
Logs Pipeline architecture using OpAMP in SigNoz
What was achieved in OpenTelemetry in 2023?
-
Logs becoming GA
This was announced in Kubecon NA ( Nov 2023)
-
New tools coming up leveraging OpenTelemetry data format
Tools like Tracetest & OpenLLMetry were released, which leverage standardised data model of OTel to derive insights. We think the standardization of data formats will lead to an ecosystem of tools that go beyond observability into other areas like testing, performance, security, etc.
-
Stable release of the Metrics API and SDK in the Go implementation
-
OpAMP
Open Agent Management Protocol (OpAMP) is a network protocol for remote management of large fleets of data collection Agents. The spec is currently in Beta stage but lots of progress was made in 2023 to make it ready for production usage. As mentioned above, we at SigNoz have also leveraged it to make our logs pipelines module.
-
14 new receivers and 8 exporters were added in OTel Collector in 2023
Some interesting ones are:
datadog-receiver: Famous receiver merged after it was sabotaged by DataDog.gitproviderreceiver: Allows receiving git events. This way users can measure dev productivity, aligning with DORA.webhookeventreceiver: Allows receiving events of any webhook style data source. User can also use transform extension to convert those events to logs.apachesparkreceiver: Allows monitoring of Apache Spark applications and jobs.azuremonitorreceiver: Allows to collect Azure Monitor metrics per a subscription/resource group(s) by using Azure REST API.cloudflarereceiver: Allows collecting Cloudflare logs.
What we are excited about OpenTelemetry in 2024
- Profiling as a new signal
A new repo for profiling was created with details like the vision doc and some example code. The progress is slow with last PR merged ~4 months back, but it would be exciting to have profiling added as a signal in Otel so that it could be easily correlated with metrics, traces and logs.
- Query Standardization working group
There is a WG under TAG observability in CNCF, which is working on query standardization. The working group is not specifically under OpenTelemetry project, as the scope of Otel is confined to generating telemetry data - but how this working group progresses would be interesting to see. If successful, this would help standardize the query language different observability backends use for creating dashboards and alerts, and potentially enable porting of queries across backends.
- CI/CD Observability working group
The OpenTelemetry proposal focuses on enhancing CI/CD observability by establishing standard semantic conventions for telemetry data from CI/CD tools. This initiative aims to reduce the Lead Time for Changes, a critical DevOps metric. It suggests a four-stage observability process: Collect, Store, Visualize, and Alert, with OpenTelemetry providing a unified approach for data collection.
- OpenTelemetry Protocol with Apache Arrow
There have been some efforts in Opentelemetry community to include Apache Arrow as the data format for OTLP. This integration reduces telemetry data traffic by a factor of 10 after compression, offering a 40% improvement over the best existing OpenTelemetry Protocol (OTLP) configurations with Zstandard (zstd) compression enabled. As a result, this new protocol emerges as an optimal choice for transporting telemetry data over the Internet. This project is currently in Beta stage, with some active development happening.
- OpenTelemetry Transform Language (OTTL)
The OpenTelemetry Collector is a convenient place to transform data before sending it to a vendor or other systems. This is frequently done for data quality, governance, cost, and security reasons.
Processors available in Otel Collector support dozens of different transformations on metric, span and log data. The OTTL is a language for transforming open telemetry data. This will help users in writing processing operations in a SQL-like declarative language in transform processor rather than specific syntaxes.
Conclusion
OpenTelemetry has come a long way in 2023, and we are excited to see what 2024 brings. It would be fascinating to see more and more companies adopt OpenTelemetry and the ecosystem of tools around it growing.
