Understanding OpenTelemetry Spans in Detail
Debugging errors in distributed systems can be a challenging task, as it involves tracing the flow of operations across numerous microservices. This complexity often leads to difficulties in pinpointing the root cause of performance issues or errors.
OpenTelemetry provides instrumentation libraries in most programming languages for tracing.
Using tracing, you can break down the operations into smaller parts or pieces by identifying what happened, where, when, and how it happened, along with every other relevant information. This structured approach significantly enhances the effectiveness and efficiency of the debugging process.
This article discusses OpenTelemetry, OpenTelemetry spans, and the processes involved in creating and utilizing them.
What is OpenTelemetry?
OpenTelemetry, often abbreviated as Otel, is an open-source observability framework designed to generate, gather, and export telemetry data (logs, metrics, and traces) that can be used to troubleshoot performance issues in applications.
It is incubated under Cloud Native Computing Foundation, the same foundation that incubated Kubernetes.
OpenTelemetry follows a specification-driven development and provides client libraries to instrument applications in most programming languages. Once you have instrumented with OpenTelemetry, you should be able to collect various telemetry signals like logs, metrics, and traces from it.
OpenTelemetry is also vendor-agnostic and contributes to standardization by allowing data to be exported to a wide range of backend systems and observability platforms, for example, SigNoz.
SigNoz is an OpenTelemetry-native APM that you can use to visualize OpenTelemetry data.
What is an OpenTelemetry span?
As requests flow through distributed systems, it's important to keep track of how it travels, as this can be useful for monitoring and troubleshooting.
Tracing allows you to track the journey of a request as it moves through different services in a distributed environment. It provides a way to understand the flow of operations across these services, making it easier to pinpoint performance issues or errors.
Tracing is a fundamental aspect of observability. A trace is a collection of spans, providing a high-level view of how a specific request or transaction moves through various services within a distributed environment. Imagine a trace as a comprehensive map that outlines the path a request takes through the system. While traces and spans are closely related, they serve different purposes. For a detailed comparison, see our guide on OpenTelemetry trace vs span.
An OpenTelemetry span represents a single unit of work within a system. It encapsulates information about a specific operation, including its start time, duration, associated attributes, and any events or errors during its execution.
To illustrate, consider an e-commerce application where customers place orders for products. A trace would represent the entire process of a customer's order, from the moment they click "checkout" to the point of order confirmation.
Within this trace, we have multiple spans, each signifying a crucial step in the order processing. For instance, one span might mark the moment the order was placed, recording when it began, how long it took, and any essential details about the order itself. Another span could denote the payment processing, while another might represent the inventory check. Any noteworthy events or errors, such as a payment failure or a product being out of stock, would be recorded as part of these spans within the trace.
What are Span attributes?
A span attribute is a key-value pair that provides additional context or metadata about a span. These attributes provide more information about the operation being performed within the span. They can be extremely useful for understanding and diagnosing issues in complex distributed systems.
From the illustration of traces and spans, we can liken that to span attributes. In our e-commerce application scenario, when a customer places an order, there are various details that can be associated with the processing steps. These details are captured as span attributes in the system.
For example:
- Order ID:
- Key:
order_id - Value:
12345 - This attribute helps uniquely identify the specific order being processed.
- Key:
- Payment Method:
- Key:
payment_method - Value:
Credit Card - This attribute indicates the payment method chosen by the customer.
- Key:
- Inventory Status:
- Key:
inventory_status - Value:
In Stock - This attribute informs whether the product is currently available in the inventory.
- Key:
The above can also be written as:
- Key: "Order ID"
	- Value: "12345"

- Key: "Payment Method"
  - Value: "Credit Card"

- Key: "Inventory Status"
  - Value: "In Stock"
Knowing the order ID, payment method, and inventory status associated with each step of an order helps in precise identification and tracking. Later, when you're examining traces, these attributes become invaluable. You can use them to filter and search for specific orders based on their unique IDs and payment methods or even check the availability of items in the inventory.
Here's a Go snippet that demonstrates how to add span attributes:
import (
    "go.opentelemetry.io/otel/attribute"
    "go.opentelemetry.io/otel/trace"
)

// ... inside a function with an active span
span.SetAttributes(attribute.String("order_id", "12345"), attribute.String("payment_method", "Credit Card"), attribute.String("inventory_status", "In Stock"))
What are Span Kinds?
Span Kind is a crucial attribute that defines a span's role in a distributed interaction. It tells visualization tools whether the span represents a client making a request, a server handling it, an asynchronous producer/consumer, or a simple internal function. This is essential for correctly understanding the topology of your system.
There are five kinds:
SERVER: For the server-side handling of a request, like an incoming API call.CLIENT: For the client-side making of a request, like calling an external API.PRODUCER: For sending a message to a queue, like publishing to Kafka.CONSUMER: For receiving and processing a message from a queue.INTERNAL: For operations that don't cross service boundaries (the default).
Correctly setting the kind like CLIENT on an outgoing call and SERVER on the corresponding incoming call is what allows observability platforms to build an accurate graph of your services.
What are Span events?
While attributes describe the overall properties of a span (like labels attached to the span itself), events are point-in-time markers inside the span’s timeline. Think of events as structured log entries attached directly to a span. They help capture when something significant happened within an operation, along with contextual metadata.
For example, in a payment processing span, you might record:
- when the external gateway was contacted
- when the response came back
- whether the payment succeeded or failed
This adds granular visibility into critical steps, without creating separate spans.
import (
    "go.opentelemetry.io/otel/attribute"
    "go.opentelemetry.io/otel/trace"
)

// ... inside a function with an active span
span.AddEvent("Contacting payment gateway", trace.WithAttributes(
    attribute.String("gateway.name", "Stripe"),
    attribute.String("request.id", "req-98231"),
))

// ... external API call happens ...

span.AddEvent("Gateway response received", trace.WithAttributes(
    attribute.Int("http.status_code", 200),
    attribute.Bool("payment.successful", true),
))
How to Create OpenTelemetry Spans
In this section, we will look at how spans are created and how to get the current span as well as nested spans.
To create a span, it's essential first to create a trace, as spans are inherently dependent on traces for their foundation.
Traces are created through a process known as instrumentation. In software development and observability, instrumentation involves adding code or hooks to an application. This allows for the collection of data about its performance, usage, and other runtime characteristics.
There are two approaches to incorporating tracing with OpenTelemetry: manual and automatic.
-
Manual Instrumentation:
In this approach, developers explicitly control creating and managing spans in their code. They determine when spans begin and end, as well as what information is added to them.
-
Automatic Instrumentation:
Here, a library or agent is used to trace specific frameworks, libraries, or services automatically. This process occurs without the need for manual intervention. The agents or libraries integrate seamlessly into your application's code, capturing spans effortlessly.
We will be looking at how to create a trace using the manual instrumentation technique using Golang. More information can be found in the documentation and the implementation for other languages.
Creation of Traces
Step 1. Firstly, the OpenTelemetry packages need to be installed:
go get go.opentelemetry.io/otel \
  go.opentelemetry.io/otel/trace \
  go.opentelemetry.io/otel/sdk \
What each line means:
go get go.opentelemetry.io/otel: This line fetches and installs the main OpenTelemetry package. It is the entry point for working with OpenTelemetry in your Go application.go.opentelemetry.io/otel/trace: This line fetches and installs the OpenTelemetry package related to distributed tracing. It includes functionality for creating and managing traces, spans, and exporting trace data.go.opentelemetry.io/otel/sdk: This line fetches and installs the OpenTelemetry software development kit (SDK). The SDK provides the core implementation for OpenTelemetry and manages traces, spans, and other telemetry data.
Step 2. To start tracing your application, you'll need to initialize an exporter of your choice, resources, a tracer provider, and finally, a tracer. This process involves setting up the necessary components for your application to collect and transmit trace data to your preferred backend.
package app

import (
	"context"
	"fmt"
	"log"

	"go.opentelemetry.io/otel"
	"go.opentelemetry.io/otel/exporters/otlp/otlptrace"
	"go.opentelemetry.io/otel/sdk/resource"
	sdktrace "go.opentelemetry.io/otel/sdk/trace"
	semconv "go.opentelemetry.io/otel/semconv/v1.34.0"
	"go.opentelemetry.io/otel/trace"
)

var tracer trace.Tracer

func newExporter(ctx context.Context)  /* (someExporter.Exporter, error) */ {
	// Your preferred exporter: console, jaeger, zipkin, OTLP, etc.
}

func newTraceProvider(exp sdktrace.SpanExporter) *sdktrace.TracerProvider {
	// Ensure default SDK resources and the required service name are set.
	r, err := resource.Merge(
		resource.Default(),
		resource.NewWithAttributes(
			semconv.SchemaURL,
			semconv.ServiceName("ExampleService"),
		),
	)

	if err != nil {
		panic(err)
	}

	return sdktrace.NewTracerProvider(
		sdktrace.WithBatcher(exp),
		sdktrace.WithResource(r),
	)
}

func main() {
	ctx := context.Background()

	exp, err := newExporter(ctx)
	if err != nil {
		log.Fatalf("failed to initialize exporter: %v", err)
	}

	// Create a new tracer provider with a batch span processor and the given exporter.
	tp := newTraceProvider(exp)

	// Handle shutdown properly so nothing leaks.
	defer func() { _ = tp.Shutdown(ctx) }()

	otel.SetTracerProvider(tp)

	// Finally, set the tracer that can be used for this package.
	tracer = tp.Tracer("ExampleService")
}
Once the tracer has been set up, you can access it and manually instrument your code.
Creation of Spans
With the tracer in place, spans can be created to track specific operations within the code.
The creation of spans with tracers requires access to a context.Context instance. A context.Context instance is a way to carry request-scoped values across API boundaries and between processes. Usually, these instances are obtained from objects such as a request, and they may already have a parent span from an instrumentation library.
func httpHandler(w http.ResponseWriter, r *http.Request) {
	ctx, span := tracer.Start(r.Context(), "hello-span")
	defer span.End()

	// do some work to track with hello-span
}
The above function sets up an OpenTelemetry span named "hello-span" and associates it with an incoming HTTP request. The defer statement ensures that the span is ended correctly when the function completes. This is useful for measuring the duration of the operations within the span and visualizing the flow of requests in a distributed system.
In Go, the context package is used to manage the active span. When starting a span, the context that contains it is modified, and a handle for both the span and the modified context is obtained.
After a span has been completed, it becomes immutable, and any attempt to modify it will fail.
Getting current span
To obtain the current span, you must extract it from a context.Context instance that you have a handle on.
// This context needs contain the active span you plan to extract.
ctx := context.TODO()
span := trace.SpanFromContext(ctx)

// Do something with the current span, optionally calling `span.End()` if you want it to end
Nested Spans: Creating Parent-Child Relationships
When you need to track a specific operation within a larger one, you can create nested spans. If you start a new span from a context that already contains an active span, you create a parent-child relationship.
- The first span in a trace, which has no parent, is the root span.
- The original, outer span is the parent span.
- The new, nested span is the child span.
This hierarchy is fundamental to tracing. It allows you to see how a larger operation is broken down into smaller steps. For example, a parentSpan might track an entire API request, while several childSpan instances could track individual database queries or function calls made during that request.
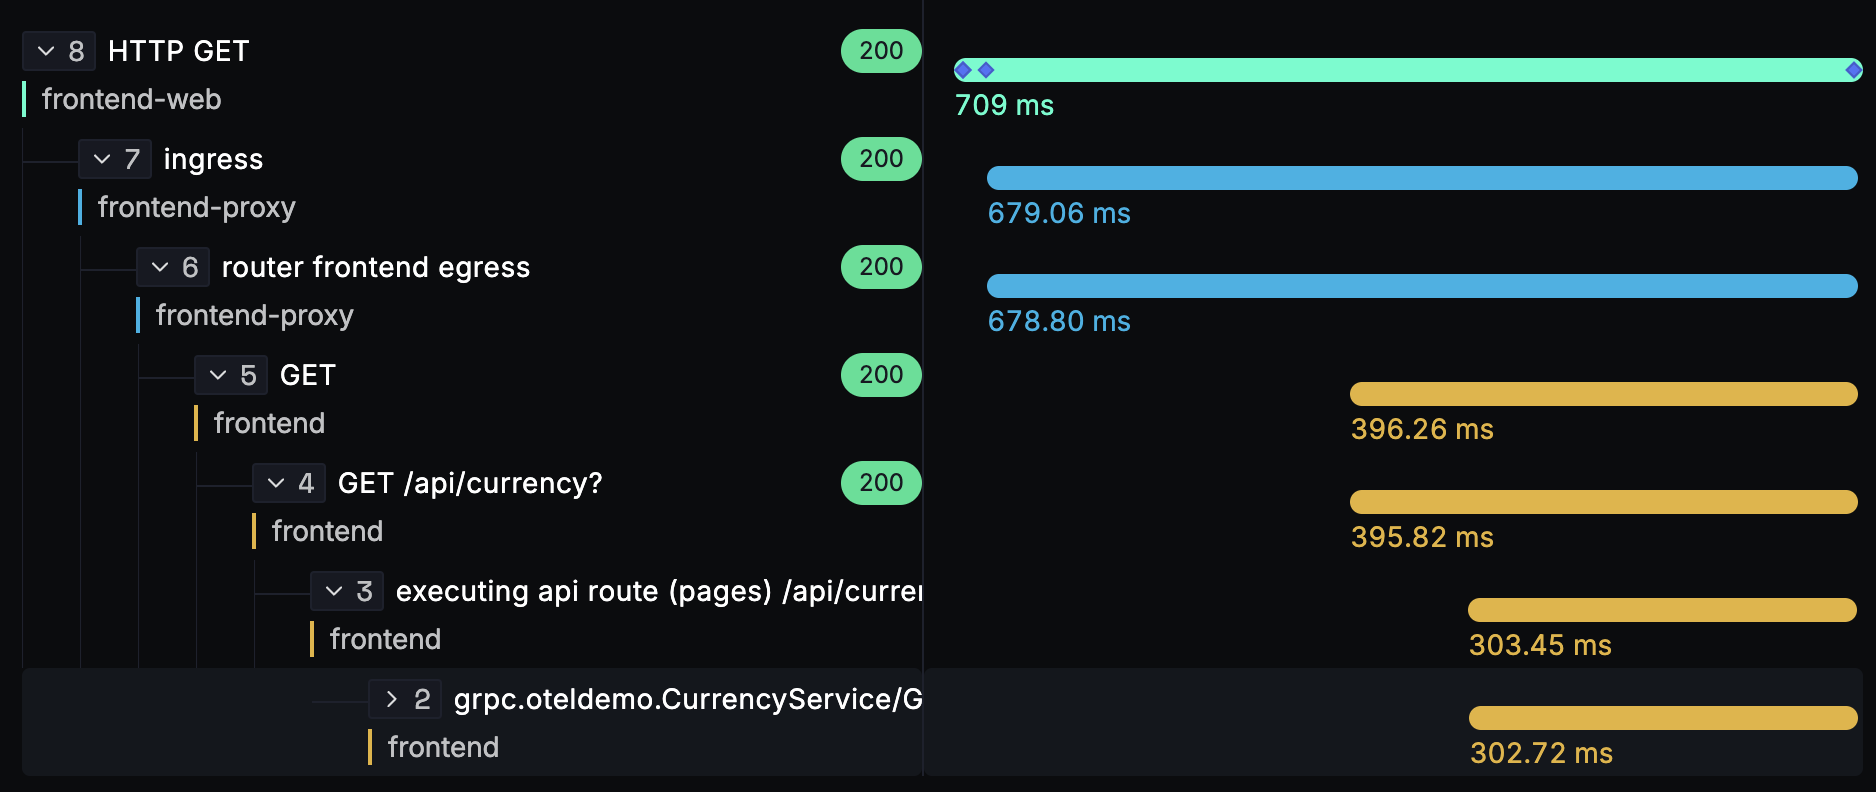
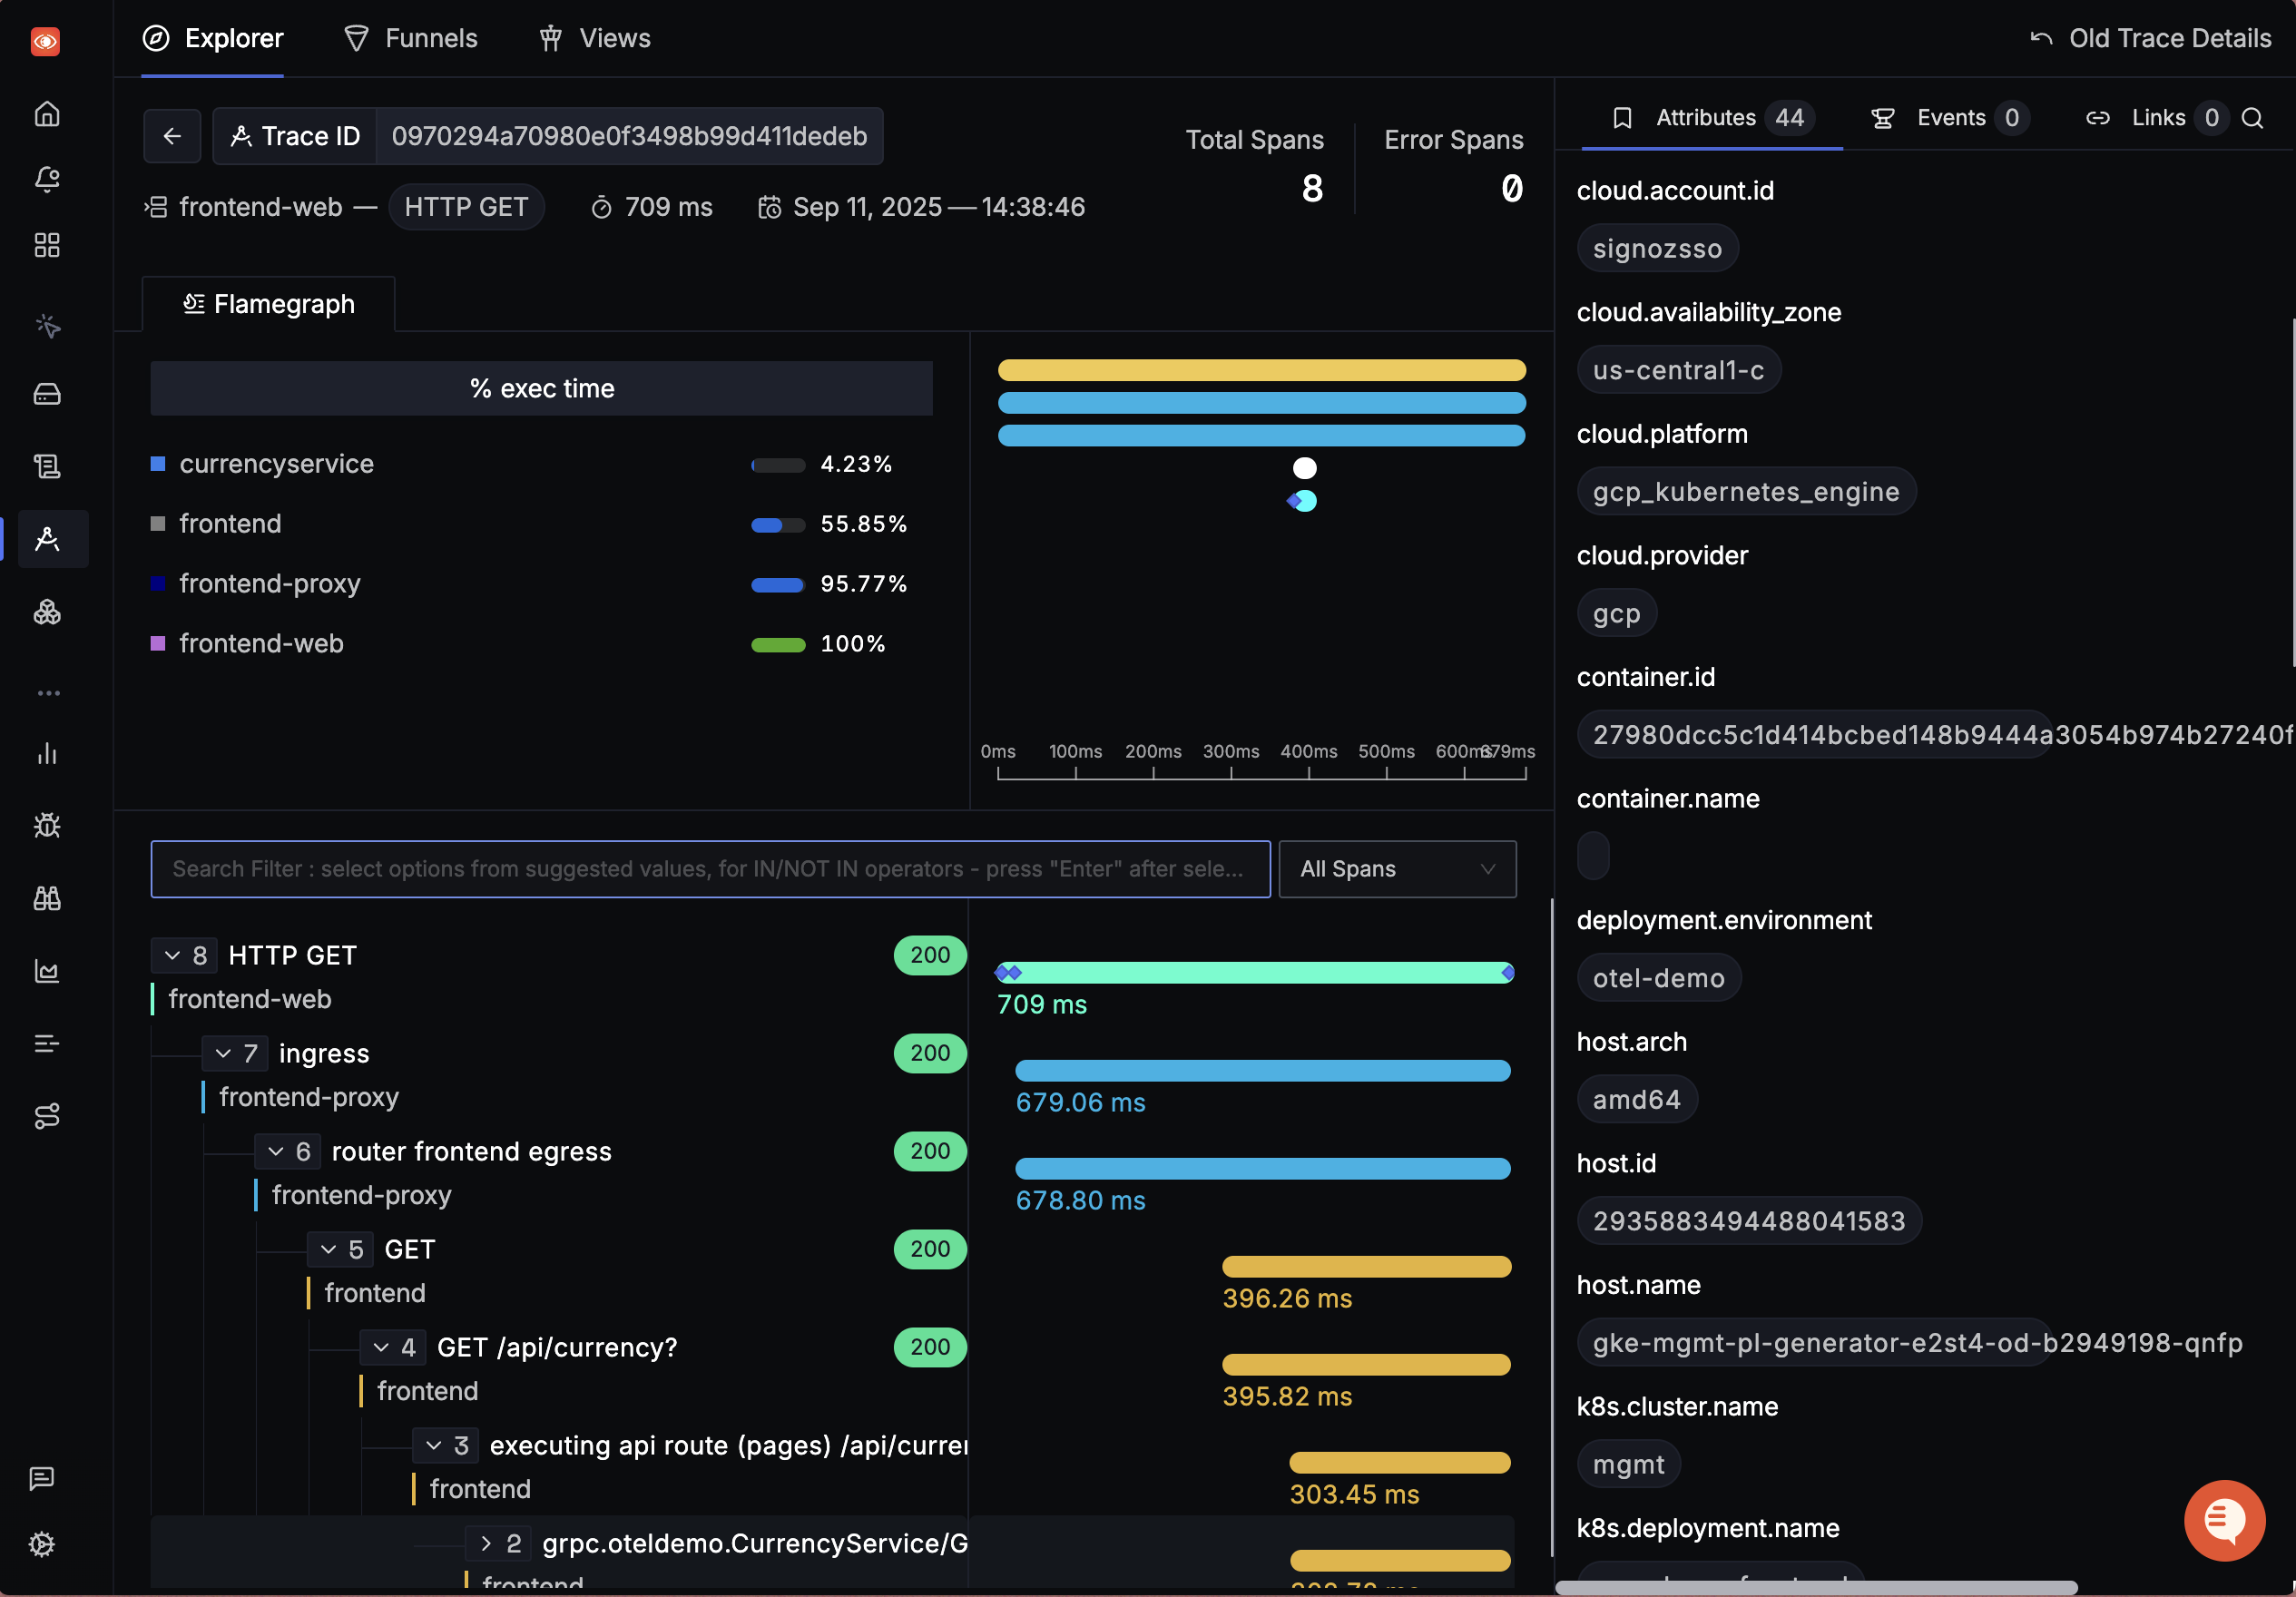
Visualization tools use this parent-child linkage to reconstruct the flow of the operation, often displaying it as a Gantt chart or flamegraph.
For example:
func parentFunction(ctx context.Context) {
	ctx, parentSpan := tracer.Start(ctx, "parent")
	defer parentSpan.End()

	// call the child function and start a nested span in there
	childFunction(ctx)

	// do more work - when this function ends, parentSpan will complete.
}

func childFunction(ctx context.Context) {
	// Create a span to track `childFunction()` - this is a nested span whose parent is `parentSpan`
	ctx, childSpan := tracer.Start(ctx, "child")
	defer childSpan.End()

	// do work here, when this function returns, childSpan will complete.
}
Remember that once a span has been completed, it becomes immutable, and any further modifications to it are not possible. This ensures that the captured data and attributes of the span remain intact and unaltered.
Span Links and Context Propagation
While a parent-child hierarchy is great for operations within a single service, traces truly shine when they cross process and network boundaries. This is made possible by span links and context propagation.
Span Links: For Asynchronous Workflows
First, let's address a common scenario that doesn't fit the parent-child model: asynchronous processing. Imagine a Producer service sends 100 messages to a queue, and later, multiple Consumer services process those messages. The producer's "send-batch" span is causally related to all the consumer spans, but it's not their direct parent.
Span Links solve this by creating an explicit pointer from one span to another, even across different traces. Each consumer's span can add a Link back to the producer's original span, creating a complete, understandable end-to-end flow for the asynchronous workflow.
Context Propagation: The Underlying Concept
This leads to a crucial question: how does the consumer know the identity of the producer's span to create that link? The answer is context propagation.
Context Propagation is the mechanism by which tracing information (the "context," including the Trace ID and Span ID) is carried across service boundaries. It works in two steps:
- Injection: Before a service sends a request or message, the OpenTelemetry library injects the current span's context into the request's headers (for HTTP) or the message's metadata (for queues).
- Extraction: When the receiving service gets the request or message, its OpenTelemetry library extracts that context.
This extracted context is the key to connecting distributed systems. It is used to:
- Create a child span if the relationship is a standard parent-child call.
- Provide the information needed to create a Span Link for asynchronous relationships.
This entire process is standardized by specifications like the W3C Trace Context (traceparent header), ensuring that traces can be seamlessly connected across services written in different languages. In essence, Context Propagation is the fundamental process that makes all distributed tracing possible.
Getting started with OpenTelemetry tracing
If you’re looking for the right distributed tracing tool that supports OpenTelemetry, then SigNoz is the right choice. SigNoz is an open-source distributed tracing tool that supports OpenTelemetry natively. It also provides metrics monitoring and logs management under a single pane of glass.
One of the key strengths of SigNoz is its native support for OpenTelemetry, which is rapidly emerging as the global standard for application instrumentation. By adopting OpenTelemetry, users can avoid vendor lock-in and gain access to a set of convenient client libraries that streamline the implementation of distributed tracing.
With SigNoz's support for OpenTelemetry, users can easily integrate their applications with SigNoz's observability platform, enabling them to gain deeper insights into their applications and improve their overall performance.

One of the standout features of SigNoz is its intuitive visualization capabilities. It enables users to generate insightful visual representations like flamegraphs and Gantt charts based on the tracing data collected through OpenTelemetry.
These visualizations provide valuable insights into the performance and behavior of applications, making troubleshooting and performance optimization significantly more efficient.
Getting started with SigNoz
SigNoz Cloud is the easiest way to run SigNoz. Sign up for a free account and get 30 days of unlimited access to all features.

You can also install and self-host SigNoz yourself since it is open-source. With 24,000+ GitHub stars, open-source SigNoz is loved by developers. Find the instructions to self-host SigNoz.
Related Posts
