Unlocking Observability - Dive into OpenTelemetry's Top Use Cases
OpenTelemetry can be used for generating and collecting telemetry signals like logs, metrics, and traces. The advantage of using OpenTelemetry for observability is that it is open-source and frees you from vendor lock-in. You can use OpenTelemetry for multiple use cases
OpenTelemetry is an open-source project which has emerged as the standard for achieving comprehensive observability in modern applications. It is a vendor-agnostic instrumentation library providing a set of tools, APIs, and SDKs to create and manage telemetry data(logs, metrics, and traces).
The top use cases of OpenTelemetry are:
- Distributed Tracing
- Application Performance Monitoring
- Metrics Monitoring
- Logging and Event Collection
- Context propagation
- Exceptions Monitoring
- Service Dependency Analysis
Before we discuss these use cases, let us first have a brief overview of OpenTelemetry.
What is OpenTelemetry?
OpenTelemetry is an open-source collection of tools, APIs, and SDKs that aims to standardize the way we generate and collect telemetry data (traces, metrics, and logs). Once the data is collected, it can then be exported to a variety of observability platforms, giving developers and operators insights into the performance and health of their software.
Top Use Cases of OpenTelemetry
One of the many benefits of using OpenTelemetry is that it frees you from vendor lock-in. You can switch to any OpenTelemetry-compatible observability backends for storage and further analysis. If you’re looking for an observability backend that supports OpenTelemetry data natively, you can try SigNoz.
OpenTelemetry can help you generate the following telemetry signals:
- Traces,
- Metrics, and
- Logs
You can also correlate these signals for a better understanding of your software systems. An important thing to note is that OpenTelemetry is focused on the generation and collection of telemetry data. It does not provide a storage backend or any frontend client that can help you visualize and analyze the collected data.
OpenTelemetry provides an OpenTelemetry collector that helps in collecting, processing, and sending data to different endpoints.
The data that can be generated using OpenTelemetry client library has very rich context. A good OpenTelemetry backend can enable you to use OpenTelemetry data for better insights.
Let's explore some of the top OpenTelemetry use cases in detail:
Distributed Tracing
Distributed tracing is one of OpenTelemetry's core capabilities. It allows you to track the flow of requests as they move through various services in a distributed system. This is particularly crucial in microservices architectures, where a single user request might trigger a cascade of interactions across multiple services.
OpenTelemetry provides tracing SDKs for most programming languages like Java, Python, Javascript, Golang, etc.
Trace data enables you to visualize and understand the path of a request, making it invaluable for troubleshooting and optimizing the performance of such systems.

Application Performance Monitoring
OpenTelemetry-native backends like SigNoz generate application performance monitoring charts from the trace data. You can get out-of-the-box charts for latency, request rates, error rates, etc.
OpenTelemetry also lets you create custom metrics for application-specific insights.

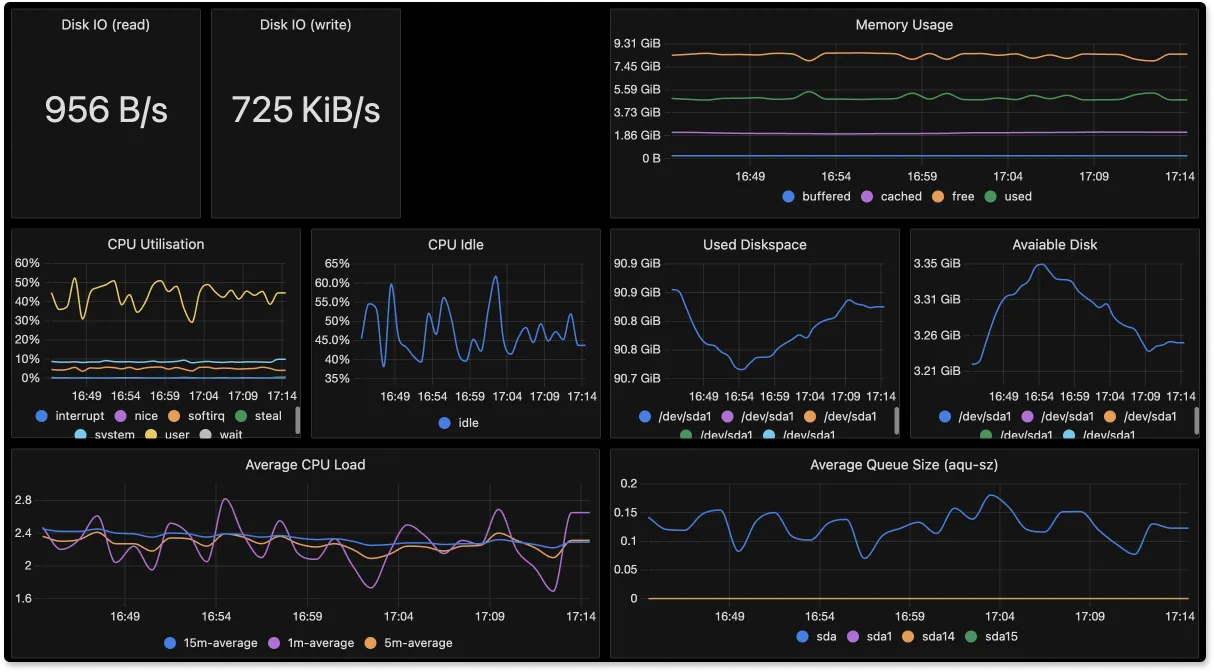
Metrics Monitoring
OpenTelemetry provides a standalone service which is called OpenTelemetry Collector(OTel collector). You can use the OTel collector to collect different types of metrics like hostmetrics, metrics about your database instances, k8s infra metrics, etc.
You can configure different kinds of receivers in the OTel collector to collect different kinds of metrics.
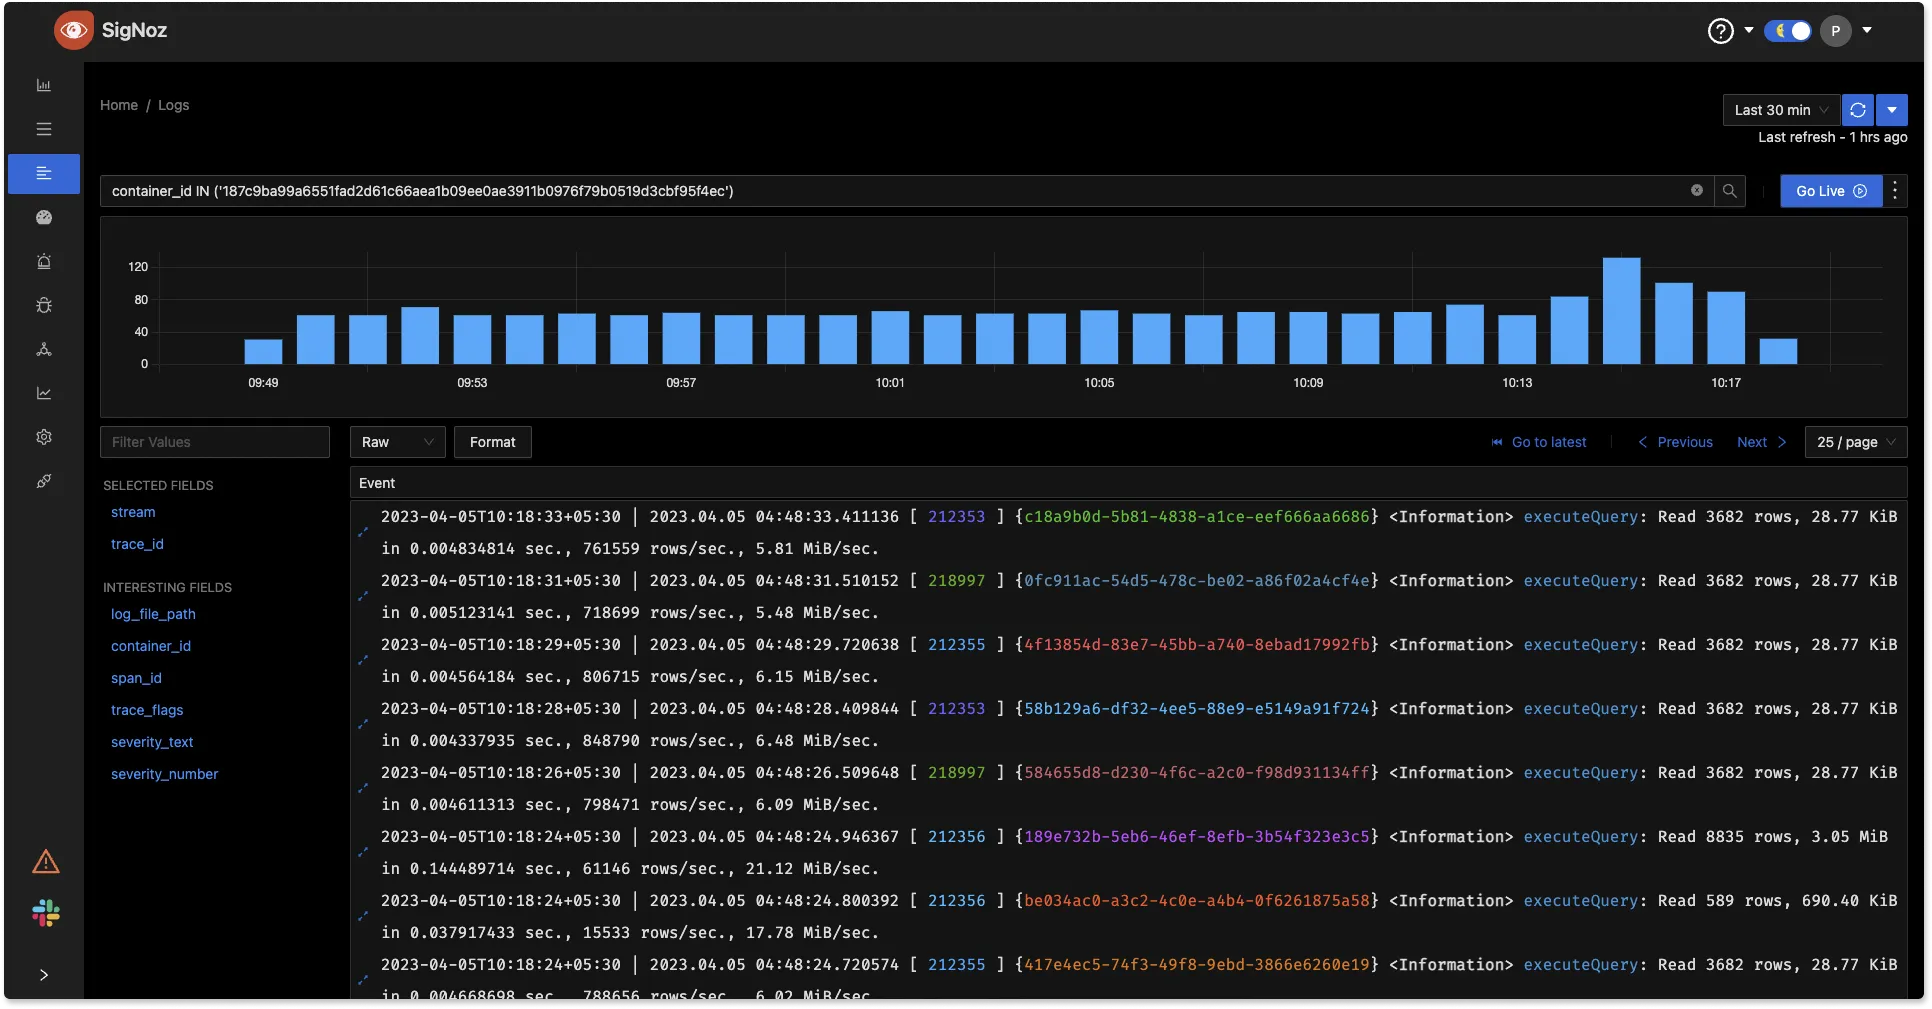
Logging and Event Collection
OpenTelemetry allows you to capture and manage logs and events generated by your applications. It provides logging SDKs in languages such as Java and Python. Using OpenTelemetry logging SDKs, you can generate structured logs which is also correlated with other signals like traces.
But logging has a lot of legacy. OpenTelemetry logs support is added with the philosophy that it should support legacy logs and logging libraries as well as provide improvements and better integration with the rest of the observability world where possible.
Context Propagation
In a distributed system, keeping track of a request's details as it moves through different services is essential. OpenTelemetry simplifies this process with context propagation, ensuring that crucial information like trace IDs (unique request identifiers) and span IDs (markers within a request's journey) travel along with the request. This feature is vital for maintaining a clear view of requests in complex, multi-service environments.
You can also pass on other important information across your services based on your use case.
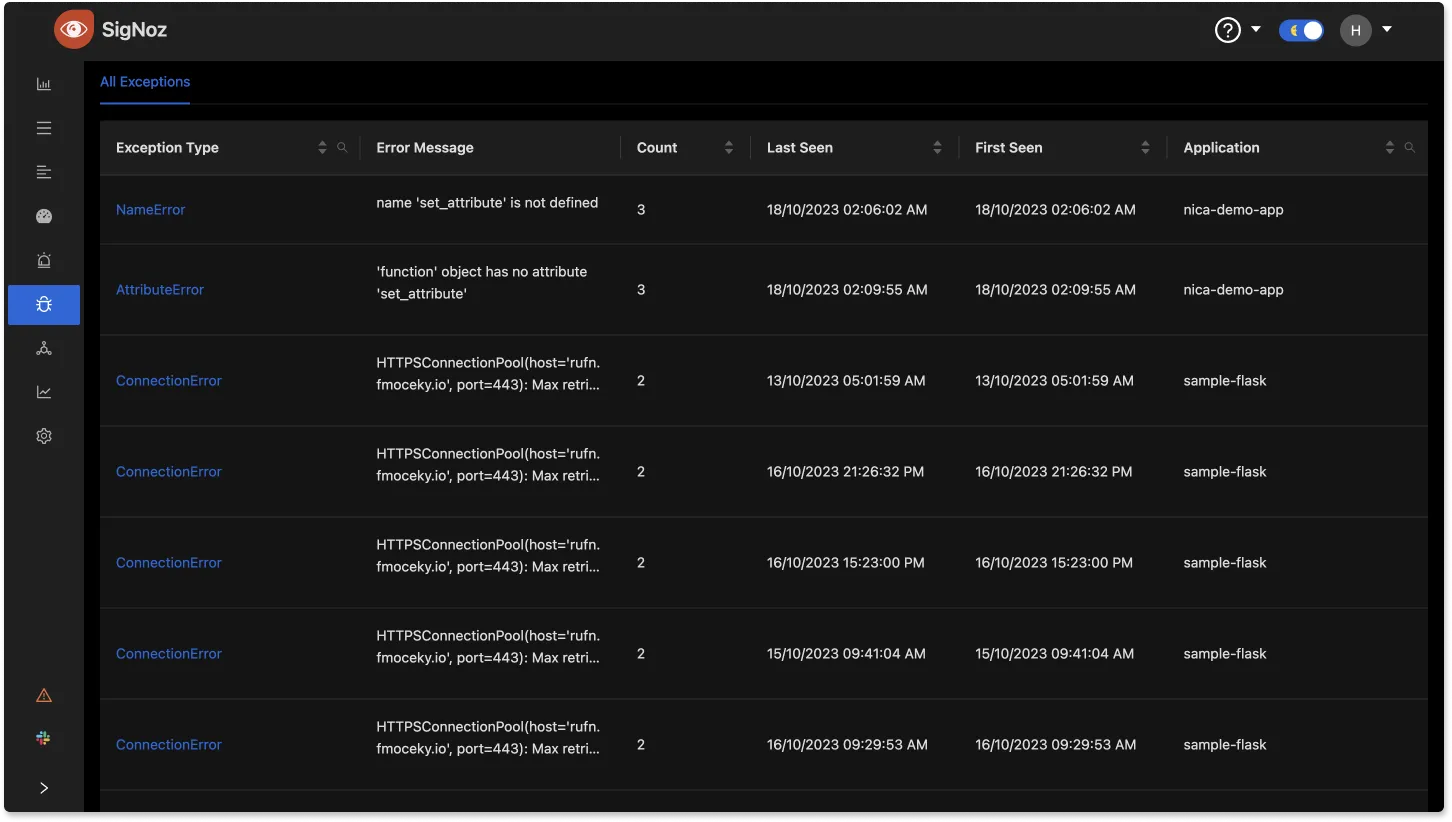
Exceptions Monitoring
Using OpenTelemetry trace data you can monitor exceptions happening in your application. Not many backend tools will let you do this. An OpenTelemetry-native backend like SigNoz allows you to monitor exceptions from your OpenTelemetry data.
Service Dependency Analysis
An OpenTelemetry-native backend like SigNoz enables you to understand the dependencies between various services in your application. By visualizing the interactions between components, you can identify critical paths, potential bottlenecks, and opportunities for optimization.
OpenTelemetry vs Vendor-based Agents for Application Instrumentation
OpenTelemetry has many advantages over vendor-based observability agents. If you are using a vendor-based agent for instrumenting your application, you will be locked-in with that vendor. Let’s see some advantages of using OpenTelemetry over a vendor-based agent:
- Flexibility: OpenTelemetry's vendor-neutral approach means you can switch observability platforms without having to re-instrument your applications. Vendor-specific agents might tie you to a particular platform.
- Standardization: OpenTelemetry aims to provide a unified standard for observability. This can simplify instrumentation, especially in polyglot environments.
- Community Support: Being open-source, OpenTelemetry benefits from a large community of contributors. Vendor-specific agents might not have as broad a community.
- Customization: While vendor-specific agents might be optimized for their respective platforms, OpenTelemetry offers more flexibility in terms of customization and extensibility.
OpenTelemetry and SigNoz
OpenTelemetry is quietly becoming the world standard for instrumenting cloud-native applications. It is the right choice for instrumentation as it future-proofs your observability set up from any vendor lock-ins. It is also beneficial for companies as onboarding becomes consistent, and with time, a good knowledge base can be built.
It is easy to get started with OpenTelemetry. You can check out instrumentation instructions. As OpenTelemetry does not provide a backend, you need to choose one that supports OpenTelemetry. An OpenTelemetry-native APM can be a good choice for your observability backend.
SigNoz is a full-stack open-source APM that you can use as your OpenTelemetry backend. It provides logs, metrics, and traces under a single pane of glass with intelligent correlation between the telemetry signals.
Getting started with SigNoz
SigNoz Cloud is the easiest way to run SigNoz. Sign up for a free account and get 30 days of unlimited access to all features.

You can also install and self-host SigNoz yourself since it is open-source. With 24,000+ GitHub stars, open-source SigNoz is loved by developers. Find the instructions to self-host SigNoz.
Further Reading
