Observing Vercel AI SDK with OpenTelemetry + SigNoz
LLM-powered apps are growing fast, and frameworks like the Vercel AI SDK make it easy to build them. But with AI comes complexity. Latency issues, unpredictable outputs, and opaque failures can impact user experience. That’s why monitoring is essential. By using OpenTelemetry for standard instrumentation and SigNoz for observability, you can track performance, detect errors, and gain insights into your AI app’s behavior with minimal setup.
What is the Vercel AI SDK? Why Monitoring Matters
The Vercel AI SDK makes it easy to build LLM-powered apps with support for providers like OpenAI, Anthropic, and Hugging Face. It handles streaming, tool use, and agent flows out of the box. But while development is simple, production observability is often overlooked. LLMs can be slow, unpredictable, and error-prone, making monitoring critical. Tracking latency, errors, and model behavior helps ensure reliability and a better user experience. In this blog, we will use OpenTelemetry and SigNoz to monitor this data, helping you gain actionable insights into your app’s performance and troubleshoot issues effectively.
Quick Overview: OpenTelemetry and SigNoz
What is OpenTelemetry?
OpenTelemetry (OTel) is an open-source observability framework that provides a unified standard for collecting telemetry data—traces, metrics, and logs—from across your application stack. It’s maintained by the CNCF and is supported by a wide range of tools and languages, making it a go-to choice for modern distributed systems. With OTel, developers can instrument their code once and export data to any observability backend, avoiding vendor lock-in.
What is SigNoz?
SigNoz is a one-stop observability platform built on top of OpenTelemetry. It provides a rich UI to visualize traces, monitor performance metrics, and set alerts, all in real time. By combining OpenTelemetry’s standardized data collection with SigNoz’s powerful analysis and dashboards, you get a robust solution for monitoring everything from traditional web services to AI-powered applications.
The Example App - A Product Support Chatbot
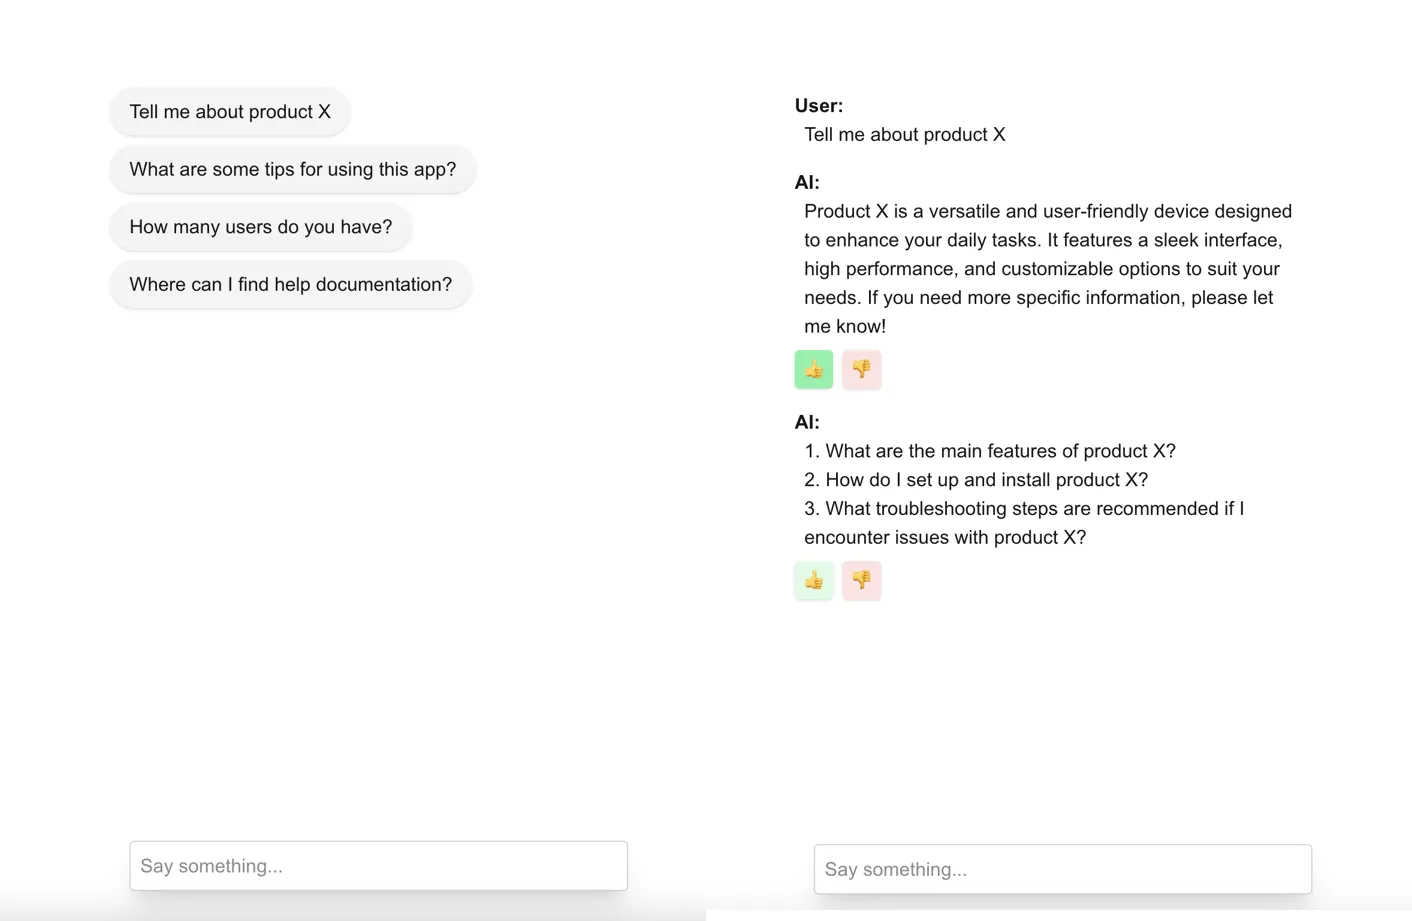
To demonstrate how monitoring works in practice, we’ve built a simple product support chatbot using the Vercel AI SDK. The app allows users to ask questions about a product, choose from suggested starter prompts, and give feedback on the chatbot’s responses. A thumbs-up triggers the bot to suggest helpful follow-up questions to deepen the conversation. If the user gives a thumbs-down, the LLM regenerates a new response in an attempt to better address the query.
The chatbot leverages streaming and LLM calls under the hood—making it a great candidate for observability. By instrumenting this app with OpenTelemetry and analyzing it in SigNoz, we can gain visibility into response times, error patterns, and user interactions. You can check out the code in the example chatbot GitHub repository.
Watch our demo video showcasing the chatbot's capabilities here:
Work With Our Demo Chatbot
If you'd like to get started quickly, you can clone our example Vercel chatbot application that already includes OpenTelemetry setup. This is a great way to explore how everything works end-to-end.
git clone https://github.com/SigNoz/vercel-ai-sdk-opentelemetry-example.git
cd vercel-ai-sdk-opentelemetry-example
pnpm install
Once you’ve cloned the example or set up your own Next.js project, follow the steps below to instrument your application and send traces to SigNoz Cloud.
Instrument your Next.js application
Check out our OpenTelemetry Next.js instrumentation guide for detailed instructions on how to set up OpenTelemetry instrumentation in your Next.js applications and view your application traces in SigNoz.
This blog covers the essential steps to get started. For the complete reference guide, including self-hosted SigNoz setup, custom tracers, and dashboard import, see our Vercel AI SDK observability documentation.
Prerequisites
- Next.js app
- Vercel AI SDK integrated into the app
- SigNoz Cloud Account
- SigNoz Ingestion Key
Send traces directly to SigNoz Cloud
Step 1. Install OpenTelemetry packages
pnpm add @vercel/otel @opentelemetry/api
Step 2. Update next.config.mjs to include instrumentationHook
This step is only needed when using NextJs 14 and below
/** @type {import('next').NextConfig} */
const nextConfig = {
	// include instrumentationHook experimental feature
	experimental: {
		instrumentationHook: true,
	},
};
export default nextConfig;
Step 3. Create instrumentation.ts file(in root project directory)
import { registerOTel, OTLPHttpJsonTraceExporter } from '@vercel/otel';
// Add otel logging
import { diag, DiagConsoleLogger, DiagLogLevel } from '@opentelemetry/api';
diag.setLogger(new DiagConsoleLogger(), DiagLogLevel.ERROR); // set diaglog level to DEBUG when debugging
export function register() {
  registerOTel({
    serviceName: '<service_name>',
    traceExporter: new OTLPHttpJsonTraceExporter({
        url: 'https://ingest.<region>.signoz.cloud:443/v1/traces',
        headers: { 'signoz-ingestion-key': '<your-ingestion-key>' },
    }),
  });
}
<service_name>is the name of your service- Set the
<region>to match your SigNoz Cloud region - Replace
<your-ingestion-key>with your SigNoz ingestion key
The instrumentation file should be in the root of your project and not inside the app or pages directory. If you're using the src folder, then place the file inside src alongside pages and app.
Your Next.js app should be properly instrumented now.
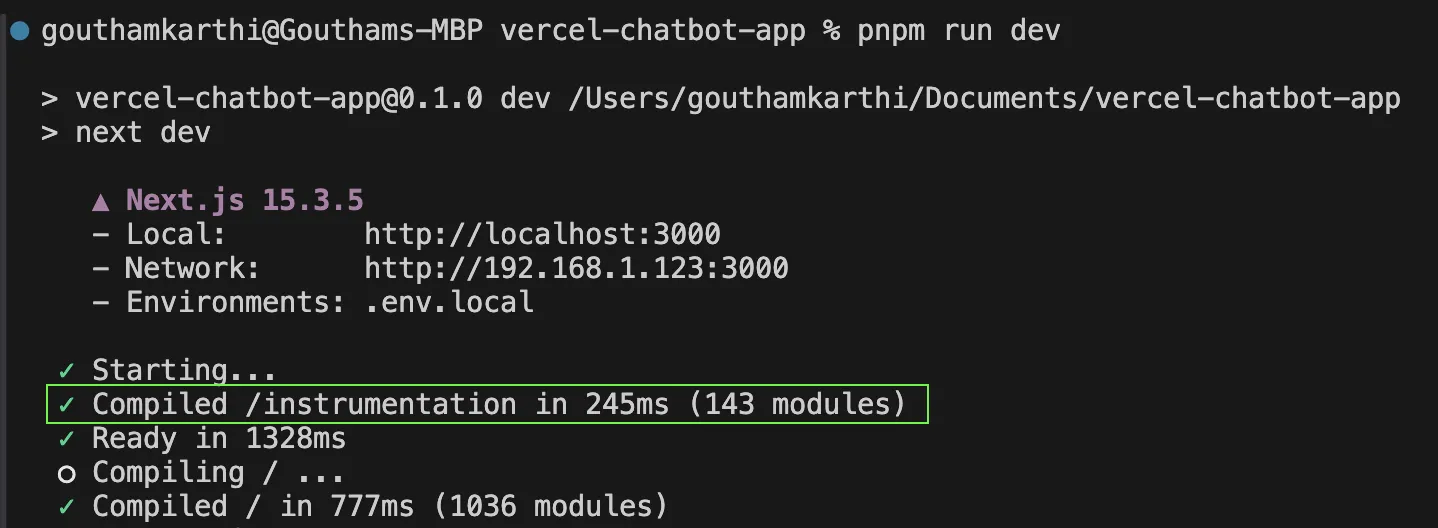
Step 4. Verify Instrumentation Locally
Run your Next.js application in development mode:
npm run dev
In your terminal, you should see output from OpenTelemetry when the application starts, confirming that the instrumentation.ts file was loaded correctly.
To see detailed trace export logs, you can temporarily set the DiagLogLevel to DEBUG in instrumentation.ts:
diag.setLogger(new DiagConsoleLogger(), DiagLogLevel.DEBUG);
Enable Telemetry for Vercel AI SDK
The Vercel AI SDK uses OpenTelemetry to collect telemetry data.
Enabling Telemetry
Check out the Vercel AI SDK telemetry options documentation for more detailed information.
You can then use the experimental_telemetry option to enable telemetry on specific function calls while the feature is experimental:
const result = await generateText({
  model: openai('gpt-4-turbo'),
  prompt: 'Write a short story about a cat.',
  experimental_telemetry: { isEnabled: true },
});
When telemetry is enabled, you can also control whether you want to record the input values and the output values for the function. By default, both are enabled. You can disable them by setting the recordInputs and recordOutputs options to false.
experimental_telemetry: { isEnabled: true, recordInputs: false, recordOutputs: false}
Disabling the recording of inputs and outputs can be useful for privacy, data transfer, and performance reasons. You might, for example, want to disable recording inputs if they contain sensitive information.
Telemetry Metadata
You can provide a functionId to identify the function that the telemetry data is for, and metadata to include additional information in the telemetry data.
const result = await generateText({
  model: openai('gpt-4-turbo'),
  prompt: 'Write a short story about a cat.',
  experimental_telemetry: {
    isEnabled: true,
    functionId: 'my-awesome-function',
    metadata: {
      something: 'custom',
      someOtherThing: 'other-value',
    },
  },
});
Custom Tracer
You may provide a tracer which must return an OpenTelemetry Tracer. This is useful in situations where you want your traces to use a TracerProvider other than the one provided by the @opentelemetry/api singleton.
const tracerProvider = new NodeTracerProvider();
const result = await generateText({
  model: openai('gpt-4-turbo'),
  prompt: 'Write a short story about a cat.',
  experimental_telemetry: {
    isEnabled: true,
    tracer: tracerProvider.getTracer('ai'),
  },
});
Your Vercel AI SDK commands should now automatically emit traces, spans, and events. You can find more details on the types of spans and events generated in the Vercel AI SDK telemetry reference.
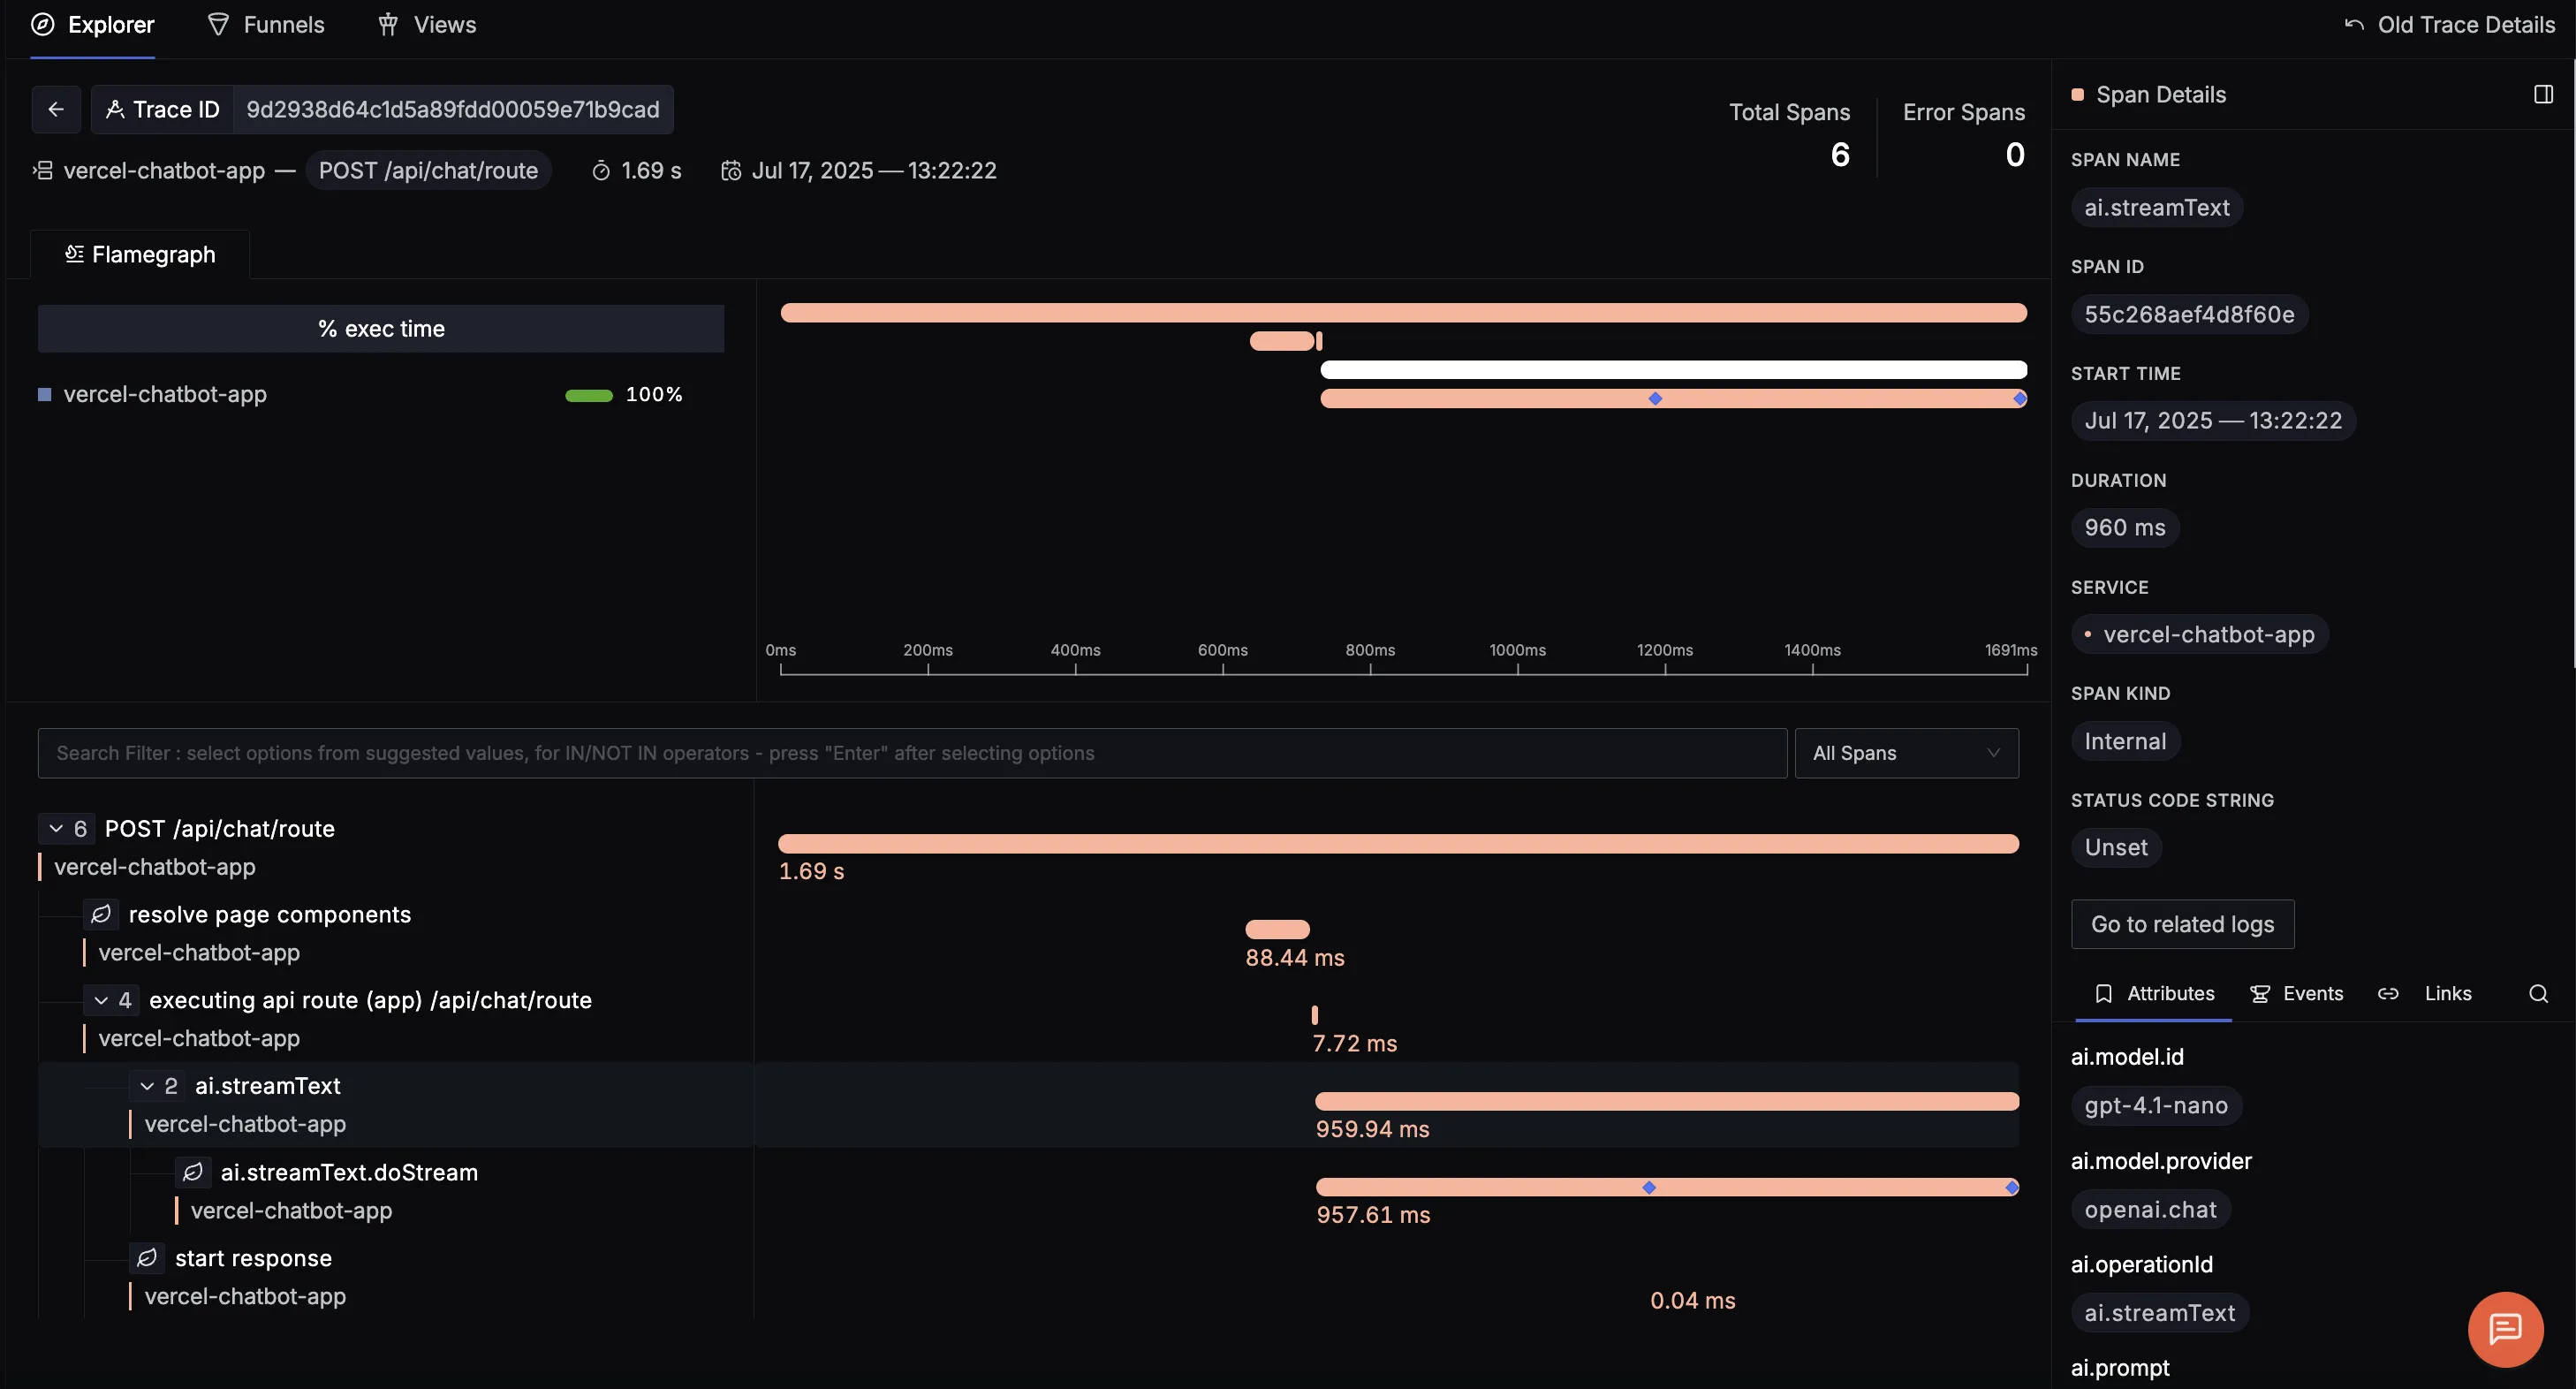
Finally, you should be able to view this data in Signoz Cloud under the traces tab:
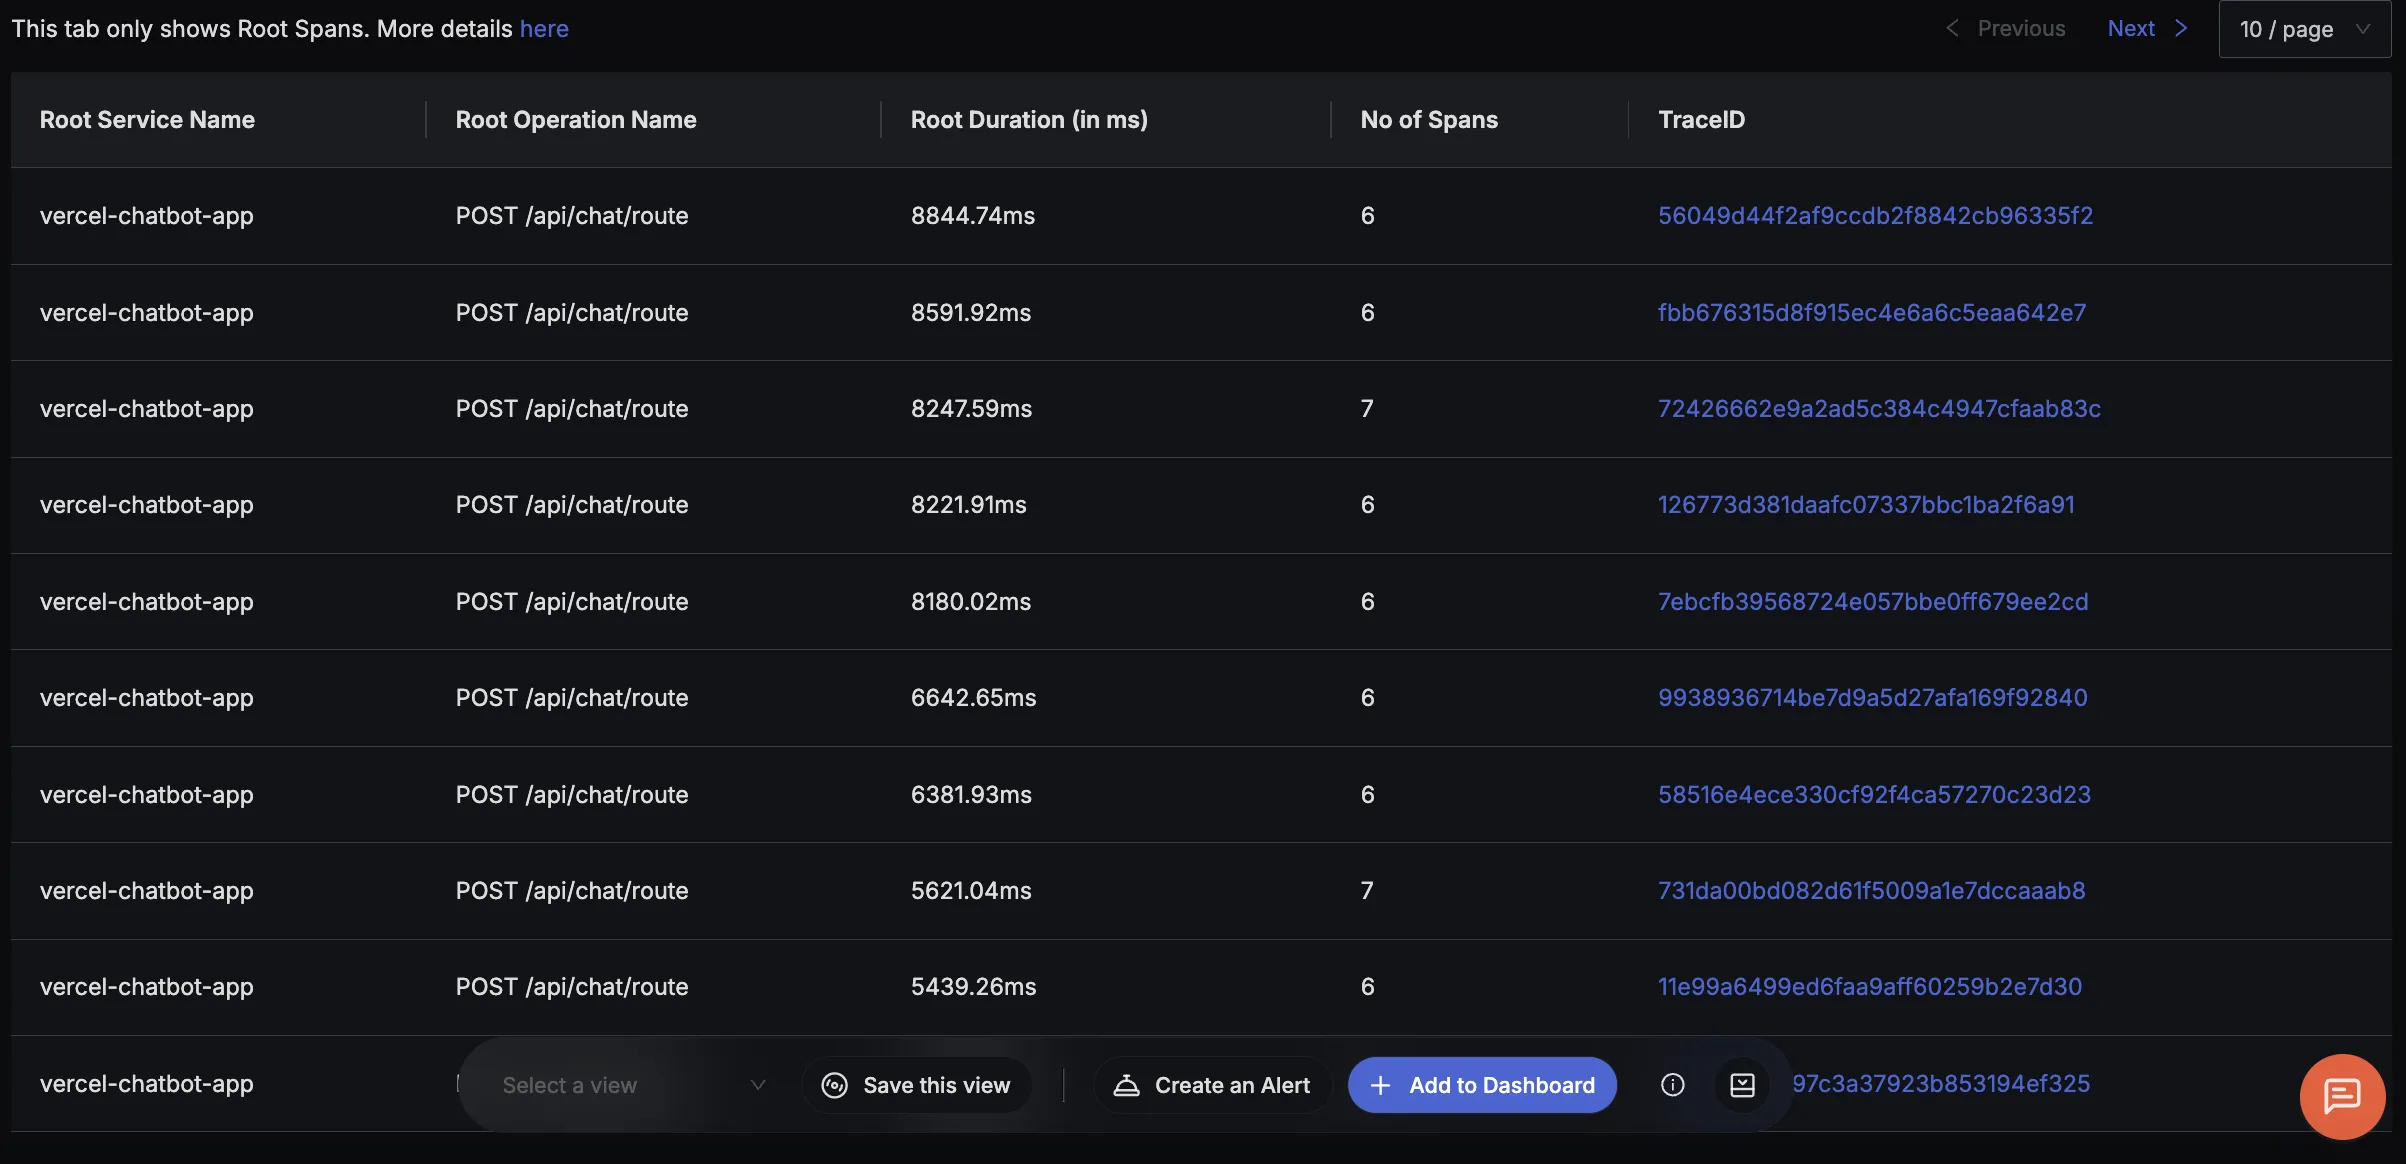
If you click on any span, you can see the detailed trace of which it is a part of.
Adding Logging to Your App
You can also emit logs from your Vercel AI application to track other useful info, such as starter messages selected and feedback given by the user.
Step 1. Install OpenTelemetry packages for logging
pnpm add @opentelemetry/sdk-logs \
            @opentelemetry/exporter-logs-otlp-http \
            @opentelemetry/api-logs
Step 2. Create logging.ts file(in lib/ directory)
import { diag, DiagConsoleLogger, DiagLogLevel } from '@opentelemetry/api';
import { LoggerProvider, SimpleLogRecordProcessor } from '@opentelemetry/sdk-logs';
import { OTLPLogExporter } from '@opentelemetry/exporter-logs-otlp-http';
import { logs } from '@opentelemetry/api-logs';

diag.setLogger(new DiagConsoleLogger(), DiagLogLevel.ERROR);

const exporter = new OTLPLogExporter({
  url: 'https://ingest.in.signoz.cloud:443/v1/logs',
  headers: {
    'signoz-ingestion-key': process.env.SIGNOZ_INGESTION_KEY!,
  },
});

const loggerProvider = new LoggerProvider({
  processors: [new SimpleLogRecordProcessor(exporter)],
});

logs.setGlobalLoggerProvider(loggerProvider);

// Get a logger instance
const logger = logs.getLogger('vercel-chatbot-app');

// Export the logger
export default logger;
Step 3. Import logger and emit logs in route.ts
import logger from '../../../lib/logging';
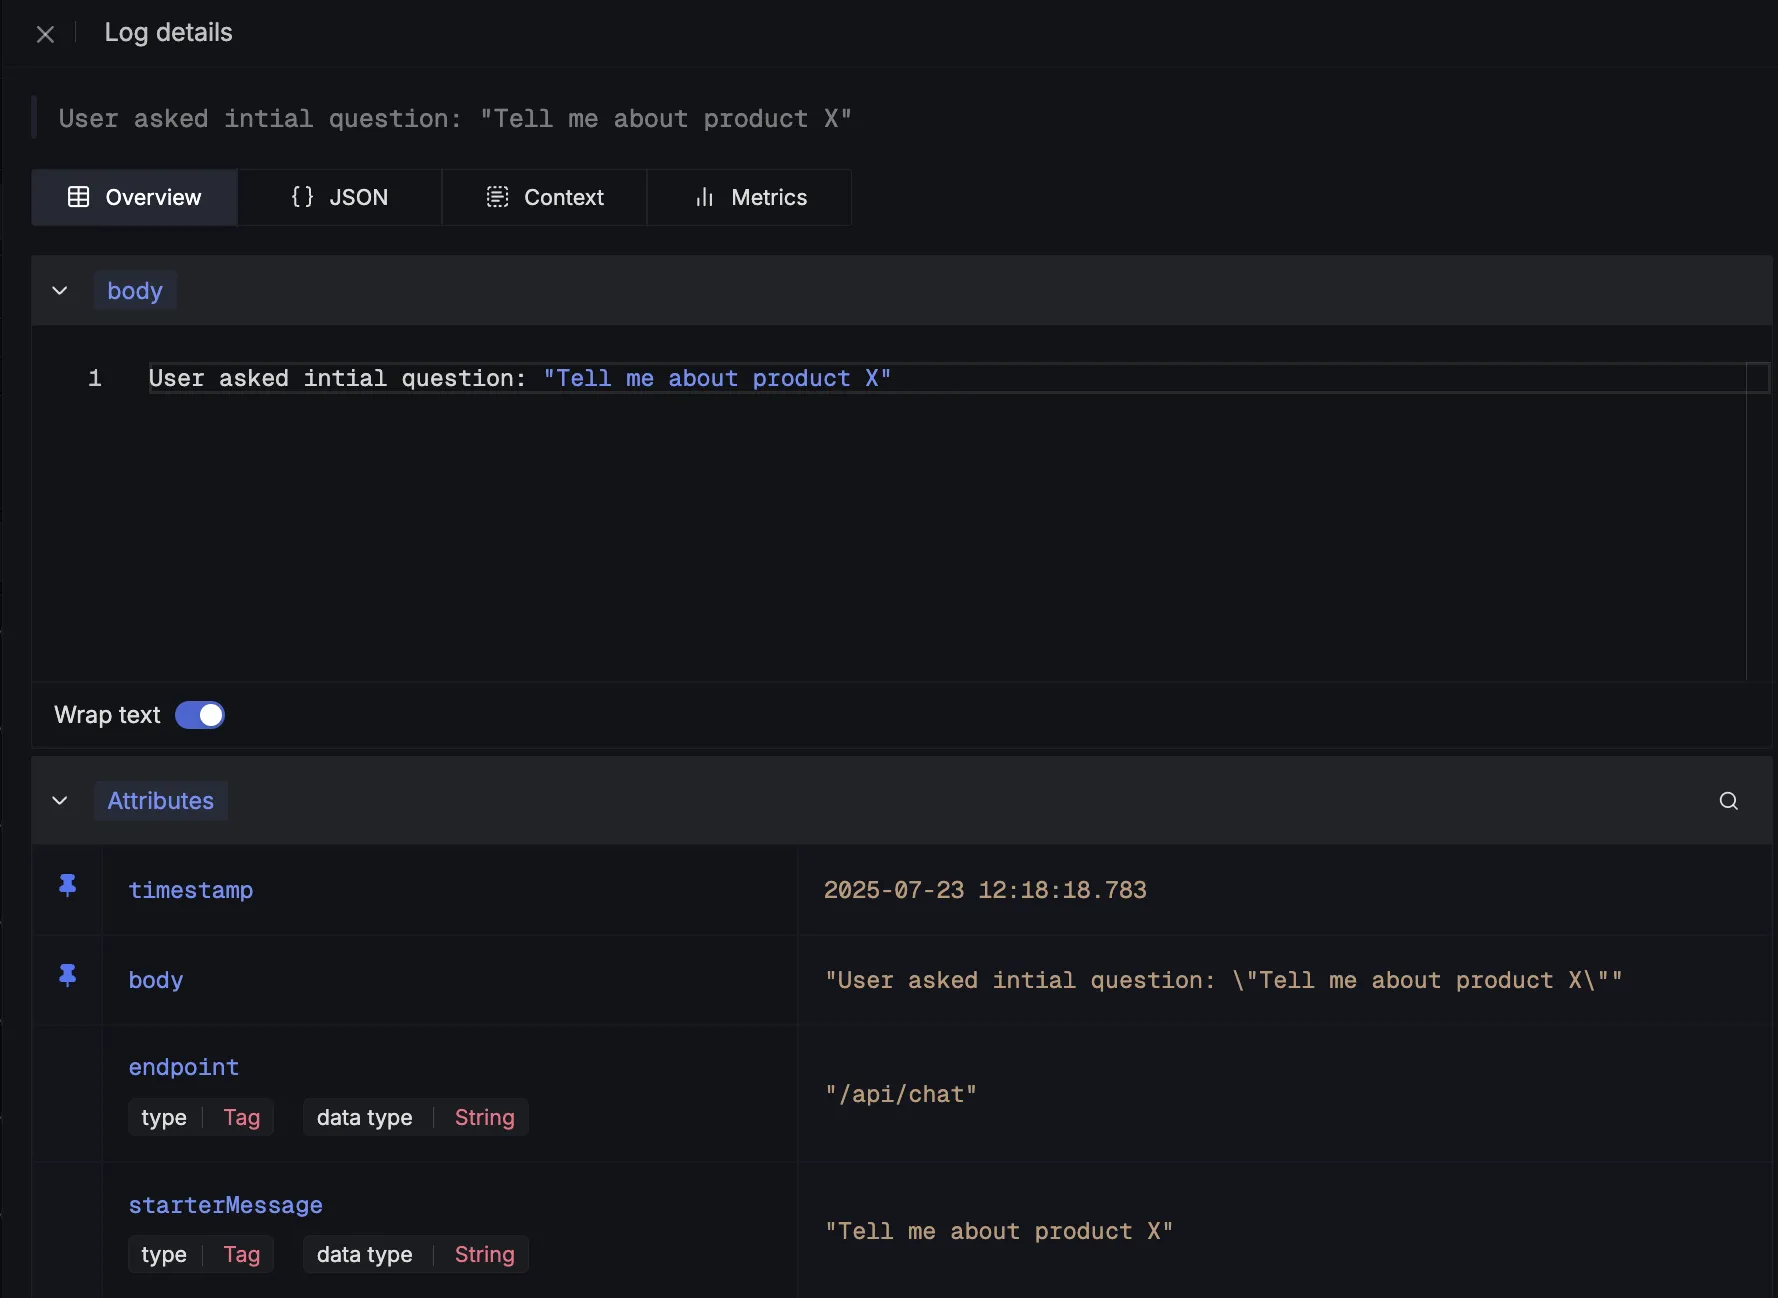
Here we are emitting logger information about the which starter question that the user selected.
logger.emit({
      severityNumber: SeverityNumber.INFO,
      severityText: 'INFO',
      body: `User asked intial question: "${userMessage}"`,
      attributes: {
        endpoint: '/api/chat',
        "starterMessage" :userMessage,
      },
    });
After being emitted, we can see these log details in SigNoz:
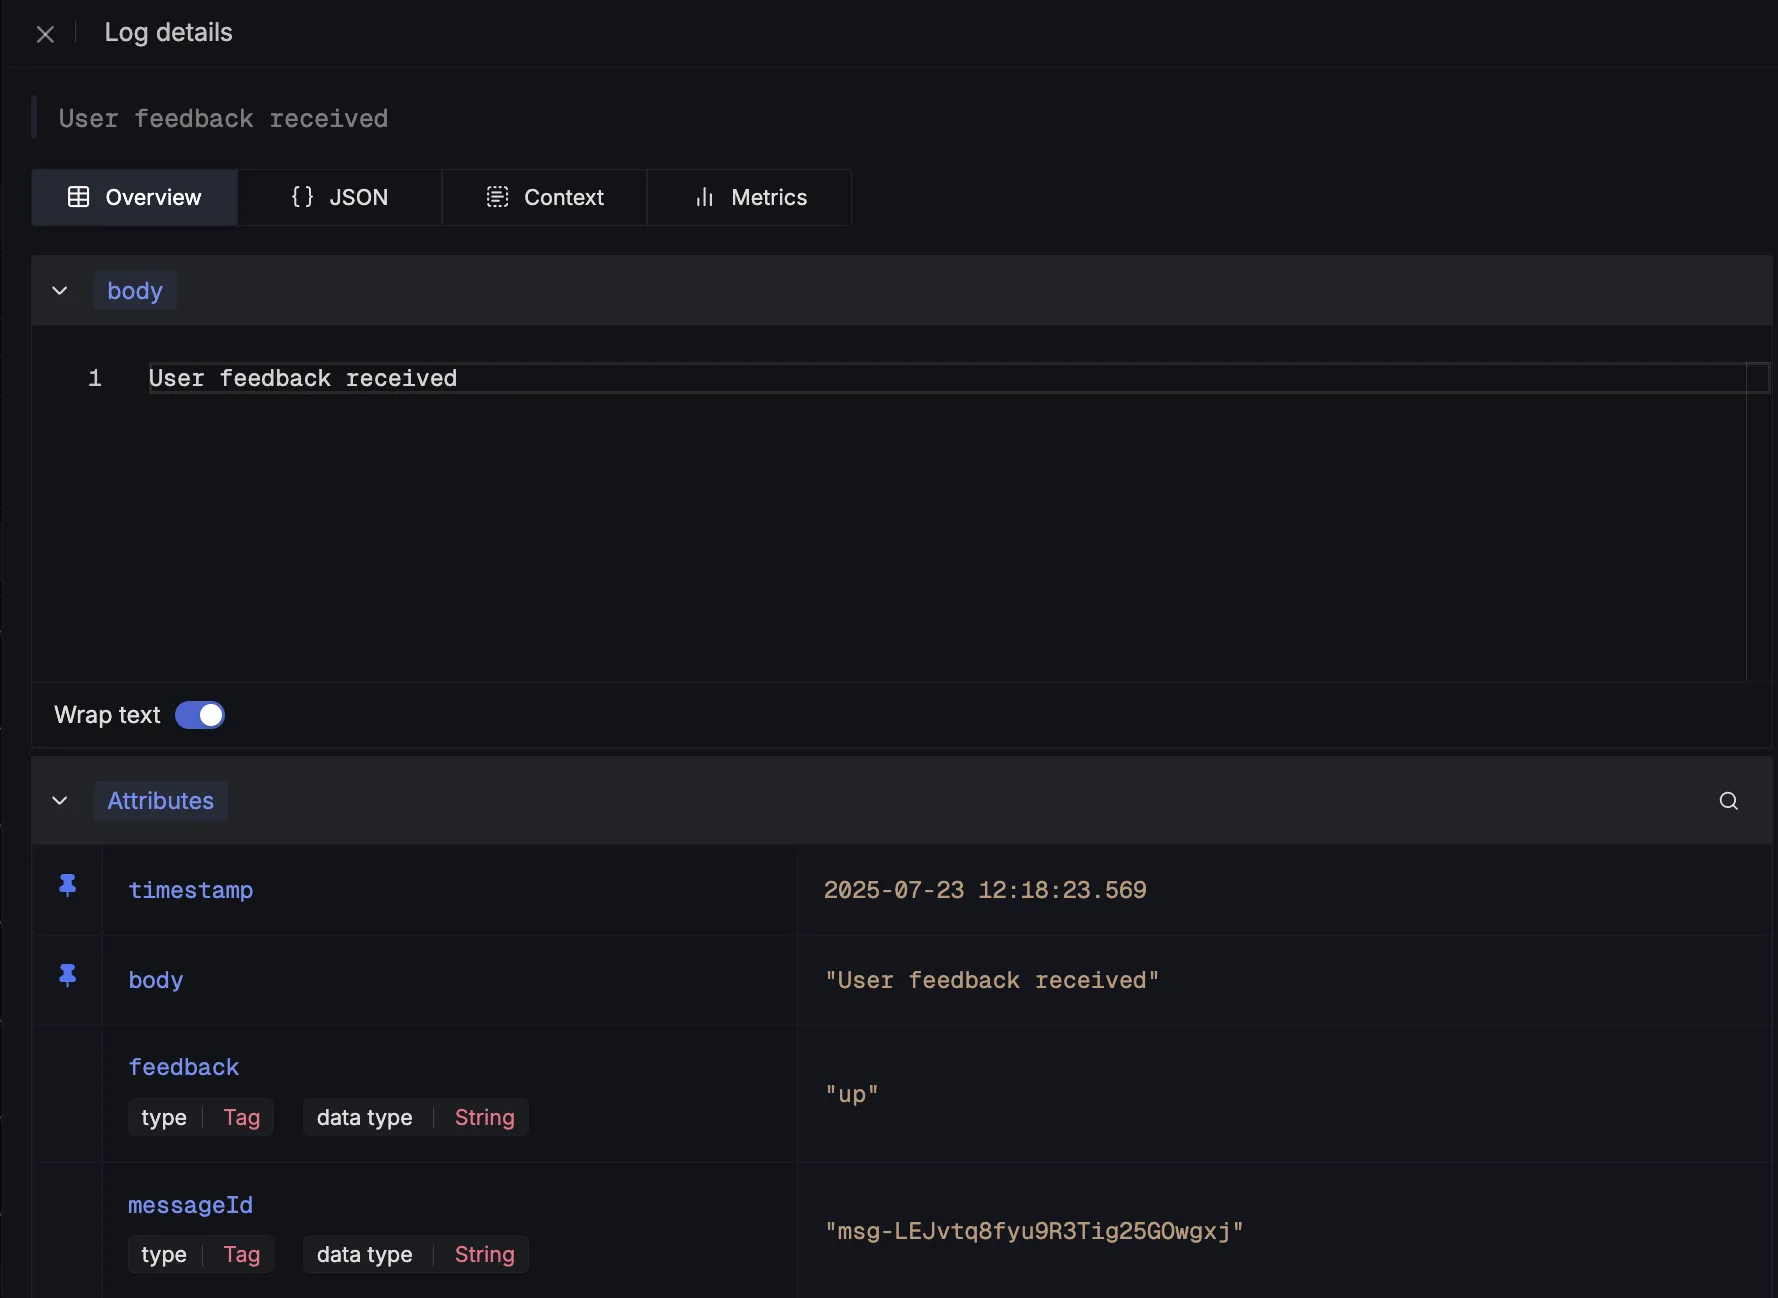
Here we are emitting logger information about the feedback given by the user about the chatbot responses:
logger.emit({
      severityNumber: 1, // INFO
      severityText: 'INFO',
      body: 'User feedback received',
      attributes: {
        messageId,
        feedback,
      },
    });
These are what the log details would look like:
What Your Telemetry Data Tells You
When you enable telemetry for the Vercel AI SDK, it automatically captures detailed performance data for its core functions. But what do these spans and events actually mean for you?
This data is your key to answering critical questions about your LLM's performance:
- "How long did the entire user request take?"
- "What was the actual time-to-first-token for the response?"
- "Which part is slow: my app's logic or the LLM provider?"
- "What was the exact prompt that led to this strange output?"
Instead of a black box, you get a detailed, hierarchical trace that breaks down the entire process. Here’s a summary of the most important data you get from the streamText function:
| Span / Event Name | What It Measures | Key Attributes for Debugging |
|---|---|---|
ai.streamText (Span) | The full, end-to-end duration of the entire streamText call from your application's perspective. | ai.prompt: The initial prompt you sent. ai.response.text: The final, complete text generated. ai.response.finishReason: Why the stream ended (e.g., stop, length). |
↳ ai.streamText.doStream (Span) | The specific duration of the call to the underlying LLM provider (e.g., OpenAI, Anthropic). | ai.prompt.messages: The exact message payload sent to the provider. ai.response.msToFirstChunk: Time To First Token (TTFT) in milliseconds. ai.response.avgCompletionTokensPerSecond: The generation speed. |
ai.stream.firstChunk (Event) | An event marking the exact moment the first piece of data is received from the LLM stream. | ai.response.msToFirstChunk: Pinpoints your TTFT on the trace timeline. |
ai.stream.finish (Event) | An event that marks when the final part of the LLM stream is received. | N/A |
With this visibility, you can pinpoint whether latency is caused by your code (a long ai.streamText span) or the model itself (a long ai.streamText.doStream span).
For a complete list of all captured attributes and functions, you can refer to the official Vercel AI SDK telemetry documentation.
Visualising Data in SigNoz with Dashboards
Once your app is instrumented with OpenTelemetry, SigNoz gives you powerful dashboards to explore the telemetry data. Built-in filters and span attributes make it easy to drill down into specific user sessions or response types. You can also set up custom dashboards and alerts to monitor key metrics like response time, token usage, and message and feedback distributions, giving you a real-time view of how your AI app is performing. Here are some interesting and useful panels we were able to create using the emitted traces:
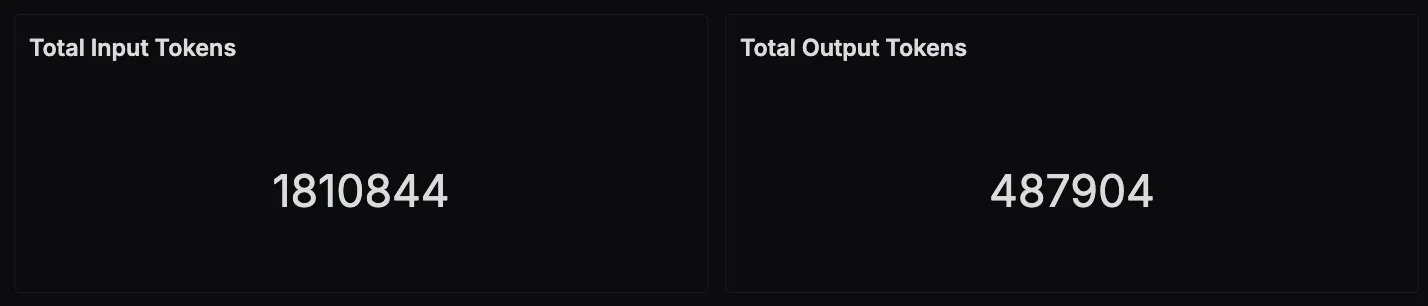
Token Usage
This panel shows the total number of tokens used across all LLM interactions, combining both input (prompts) and output (responses). It’s useful for tracking overall API usage and estimating costs, especially when using providers like OpenAI that charge per token.
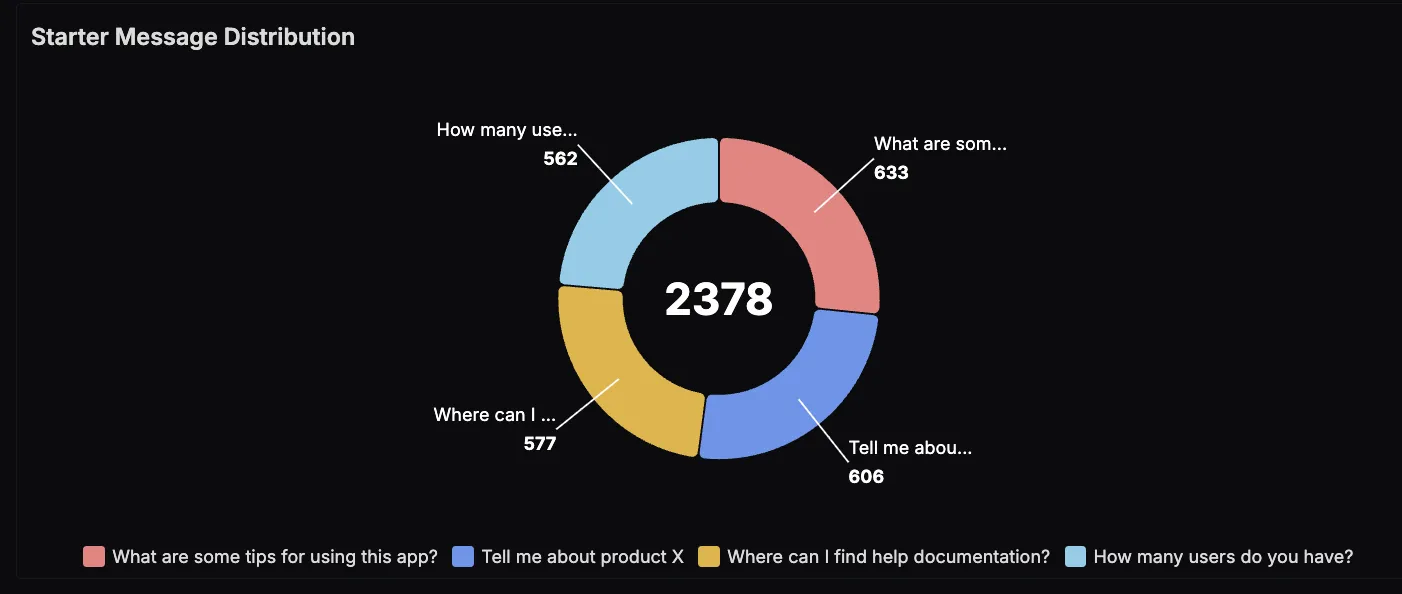
Starter Message Distribution
This panel shows how often each starter prompt is selected by users when beginning a conversation with the chatbot. It helps identify which topics are most relevant or interesting to users—useful for refining prompt design or tailoring content.
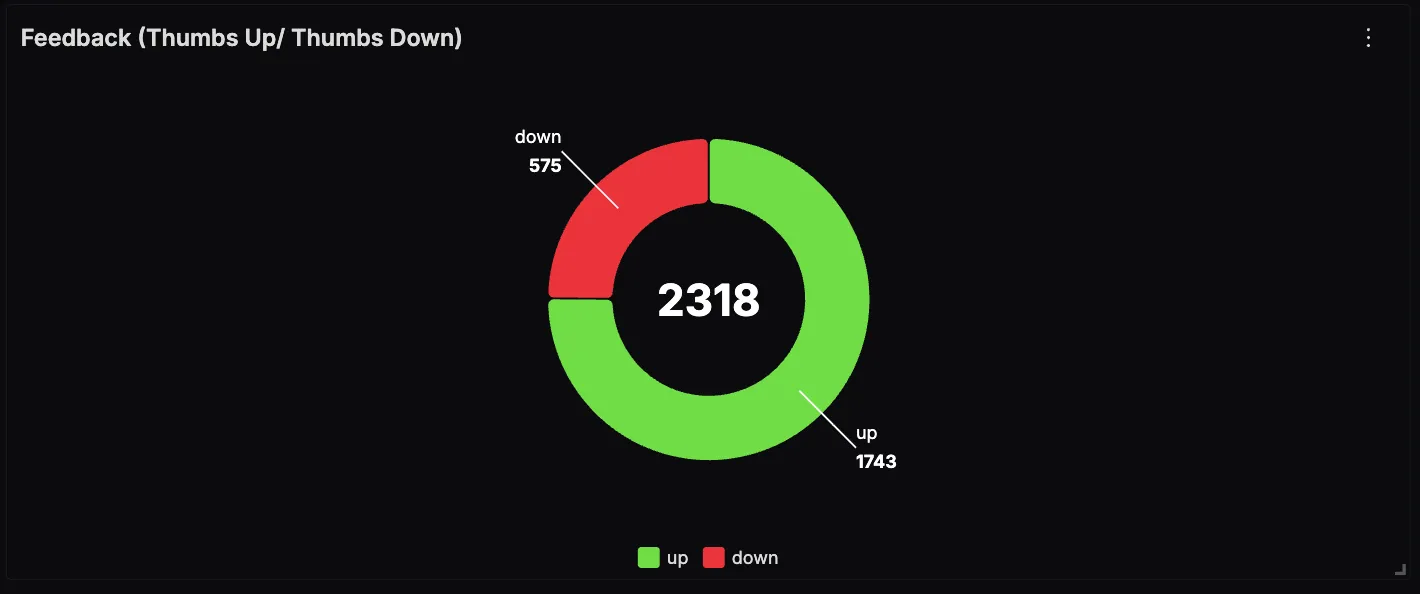
Feedback Distribution
This panel shows how users are rating the chatbot's responses using thumbs up or thumbs down. A higher ratio of thumbs-up indicates helpful or relevant answers, while thumbs-down can highlight areas where the LLM needs improvement.
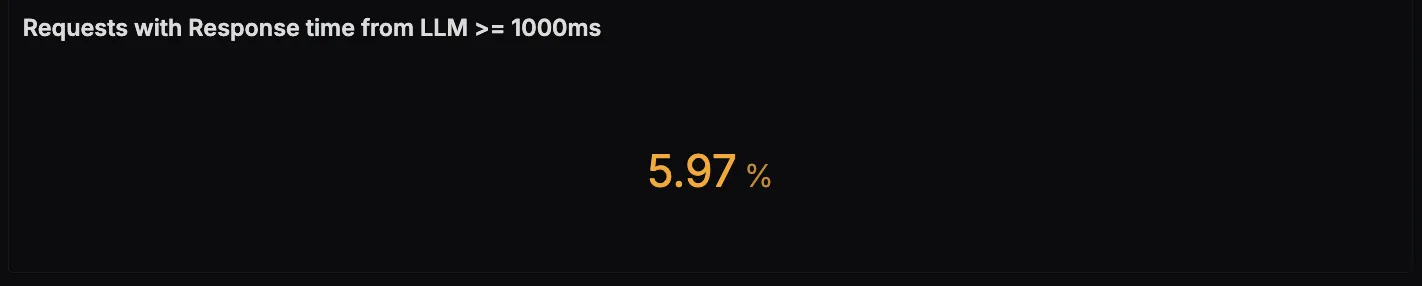
LLM Response Latency (≥ 1000ms)
This panel tracks the percentage of requests where the LLM response time exceeds 1000 milliseconds. It’s useful for identifying latency outliers that could impact user experience. You can also colour code the text displayed based on different value thresholds(orange for ≥ 5%, red for ≥ 10%)
Wrapping it Up
Monitoring LLM applications is no longer optional, especially as they become more interactive, user-facing, and business-critical. With the Vercel AI SDK, it’s easy to build powerful AI-driven experiences, but combining it with OpenTelemetry and SigNoz gives you the visibility needed to operate them reliably. From tracking token usage and latency to understanding user behaviour through feedback and prompt patterns, this observability stack helps you build faster, troubleshoot smarter, and continuously improve your AI app.
