The genesis of SigNoz - A full-stack open source observability platform
Why we felt there was a need for a full-stack open source observability platform and how we went about building it.
Table of Contents
- The 3 pillars of Observability
- The Easy and hard things about Prometheus
- The need for Distributed Tracing
- Running Metrics + Traces together. How complex can it go?
- Need for Jaeger++
- Why we built SigNoz?
- Architecture of SigNoz
- Why we chose Druid?
- How to use OpenTelemetry to send data to SigNoz?
The 3 pillars of observability
Observability is the ability to infer the state of internal components given the external state values.
Metrics
Metrics have been in use for long to detect any change in the value of a measured quantity. Like, measuring your footsteps over a day is also a metric. It's good to understand the overall aggregated state of the measured quantity.
Prometheus is popularly being used as a tool to store, analyze and alert such metrics. Prometheus is a pull-based system that scrapes metrics from targets. Eg, a service exports metrics at 0.0.0.0:8081/metrics. Prometheus should be able to scrape those metrics on a fixed interval when that endpoint is defined as the target in config.
Tracing
Distributed tracing is tracking a request as it goes from one service to another, across process boundaries up to the database, and generating multiple events while doing that. Each request is called a trace and the events are called spans. Trace data is very useful in debugging issues as it contains details about each request.
Jaeger is the latest distributed tracing tool open-sourced by Uber.
Logs
We have been using logs for long to debug applications. For an application handling 100s of concurrent connections, logs become difficult to make sense due to missing chronology order and consider browsing logs in a centralized logging system where all applications dump their data at 100Ks log-lines per second.
Elastic is a popular open-source tool used to collect, search, process & visualize logs. The new thing about logs is **structured logs ** where we assign key-value pair values in log lines and making it much efficient in storage.
Loki by GrafanaLabs is one such effort in making logs more usable and cost-efficient.
 Prometheus, Jaeger, Elastic & Loki from left to right
The Easy and Hard things about Prometheus
Prometheus is very easy to get started. You just need to run a few exporters to start monitoring your nodes, dbs, queues, etc. In Kubernetes, you can also get kube-state-metrics. Prometheus also has a powerful query language called PromQL, which enables you to run SQL-ish queries.
Prometheus lets you write powerful alert logic and store alerts as code. It has an alertmanager to group or silence alerts and notify channels like Slack and PagerDuty.
But when you look to deploy Prometheus in a large company, there will be things you need to consider.
Below are the Hard Things about Prometheus:
- Prometheus is not horizontally scalable, you will need to use a machine with bigger resources to scale Prometheus. Or, you need to federate Prometheus where a parent Prometheus scrapes child prometheuses on fixed intervals.
- Prometheus stores data on disk by default. You need to set up Cortex or Thanos to provide long-term storage and horizontally scalable Prometheus. Running Cortex can turn out to be difficult.
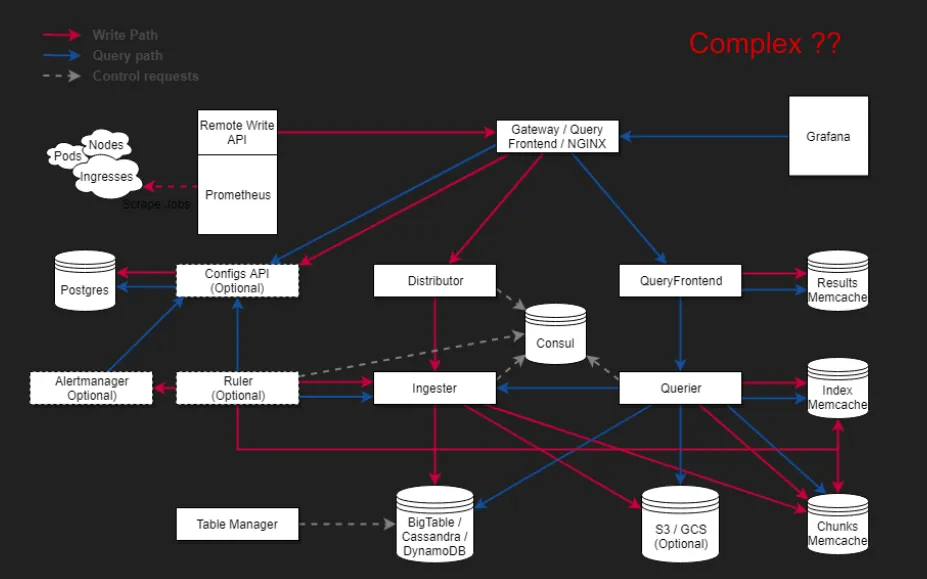 Architecture of Cortex
- You would need to deal with a lot of exporters and hence manage their uptime.
- Setting up Prometheus with all exporters and long term storage and building Grafana panels can take almost 1.5 months of developer time
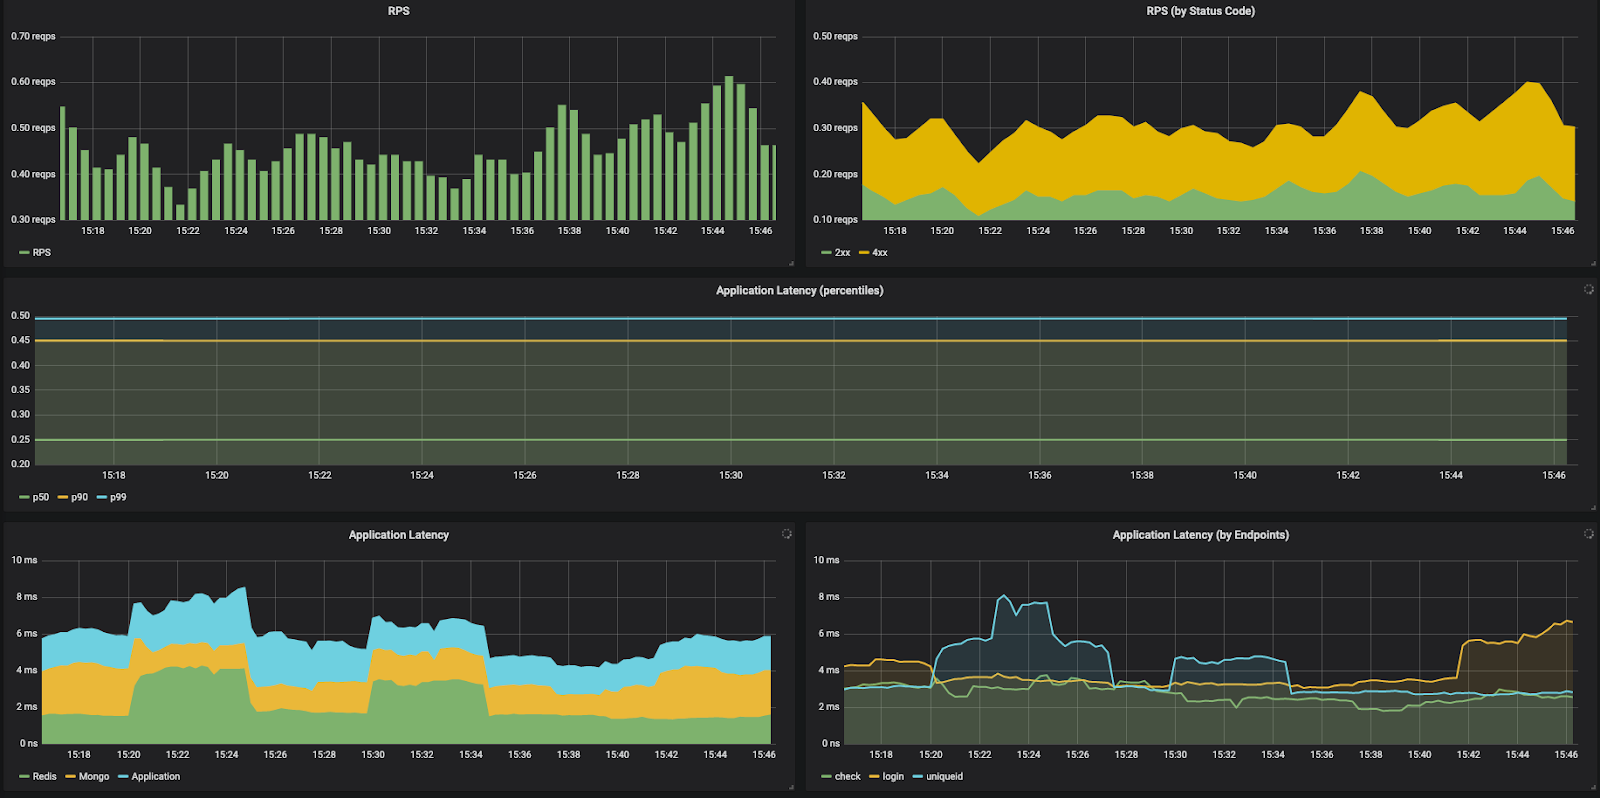
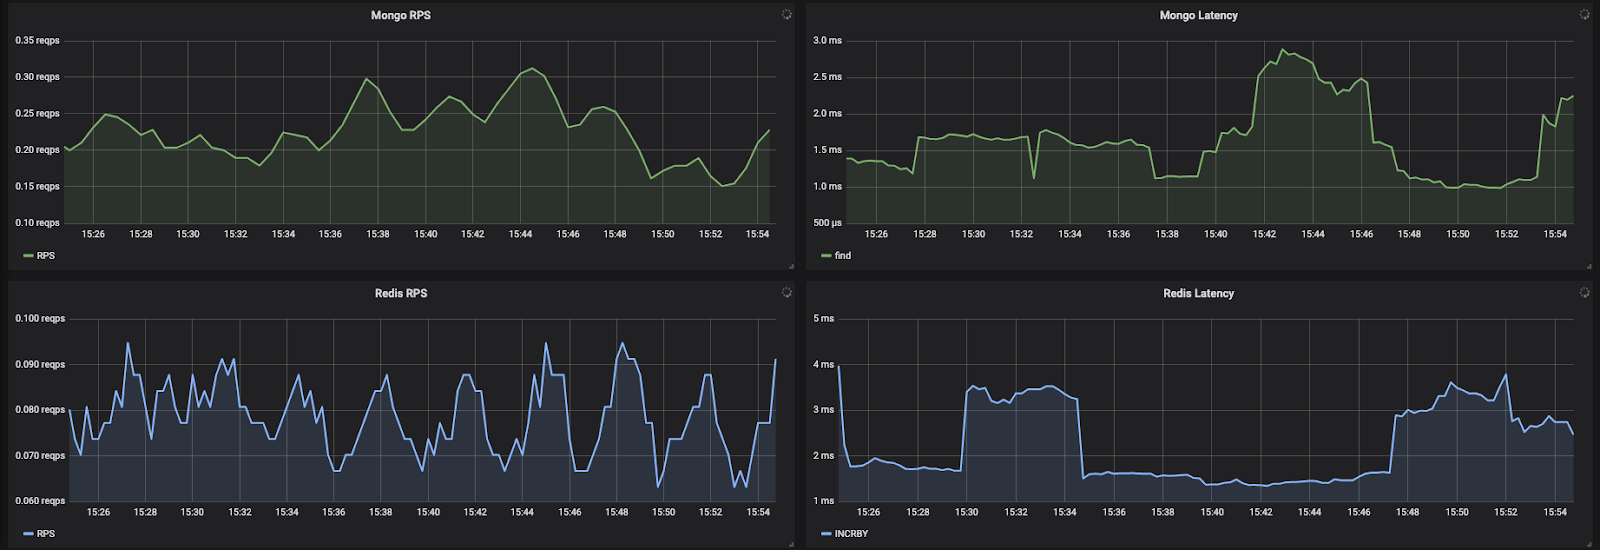
- Deeper application metrics data is not available in exporters for application metrics. Metrics like, time spent in DB calls or external API calls cannot be found easily. A few difficult to get application metrics are shown below
- RCA (Root Cause Analysis) cannot be done using metrics alone. Metrics just indicate that the measured quantity is going out of bounds. What to do next? How to figure out the exact issue that caused that? Metrics and hence Prometheus fail to give such details and distributed-tracing comes to rescue here.
The need for Distributed Tracing
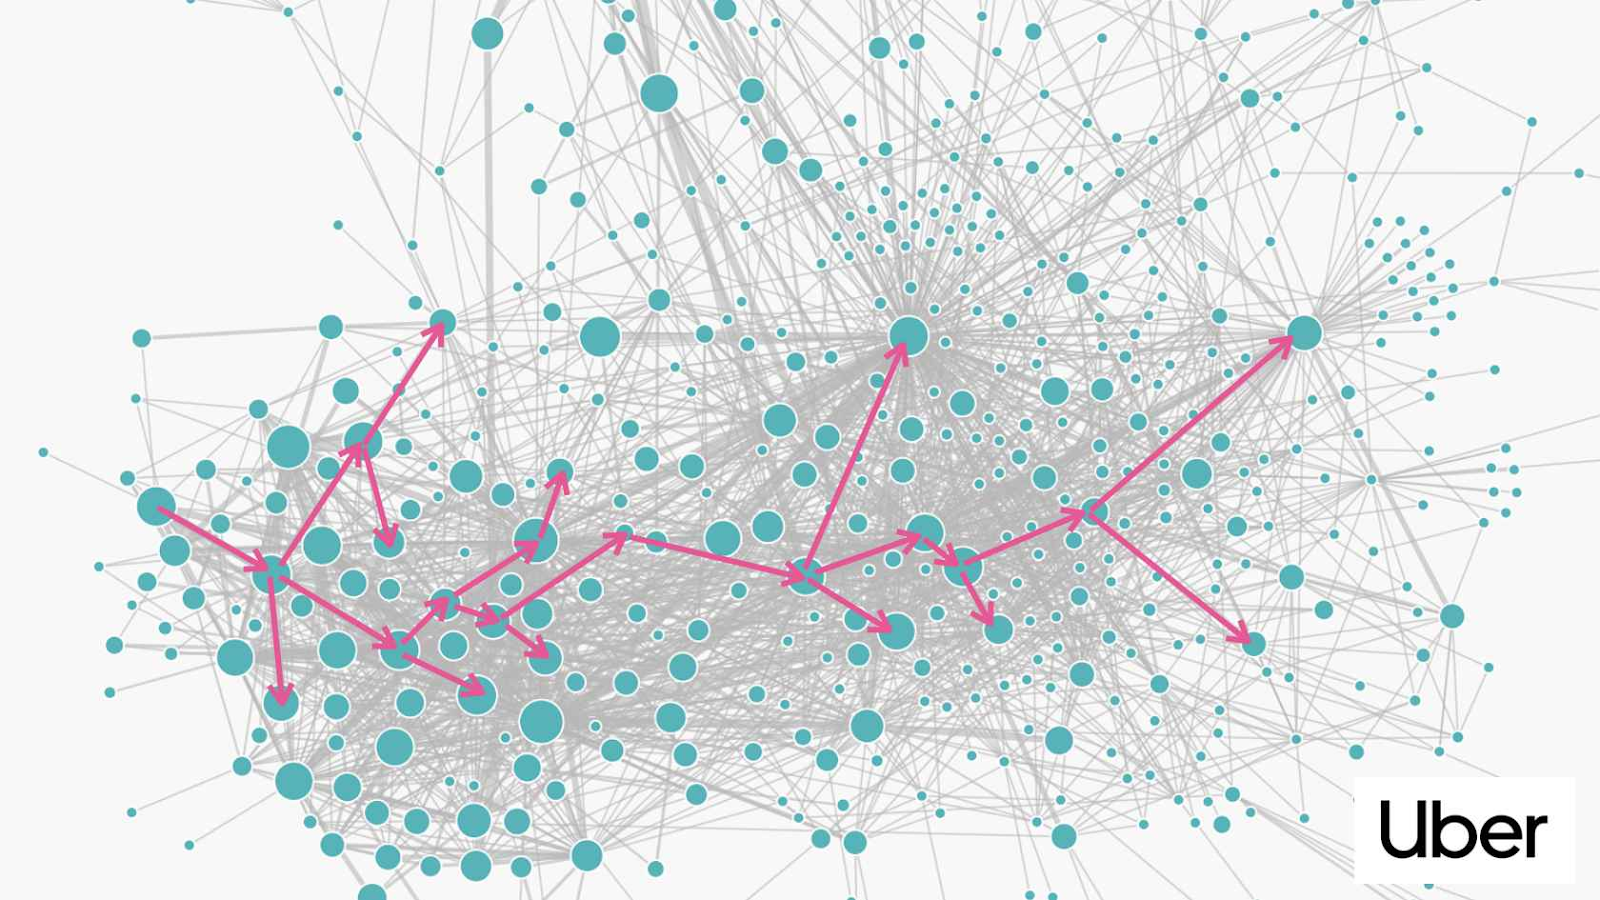
The above image depicts the flow of a request in Uber. They have thousands of services running and any request goes through multiple services and machines before returning to the user.
If something breaks, we would want to know whether downstream services failed or any particular instance was causing the issue or a new deployment is causing the errors.
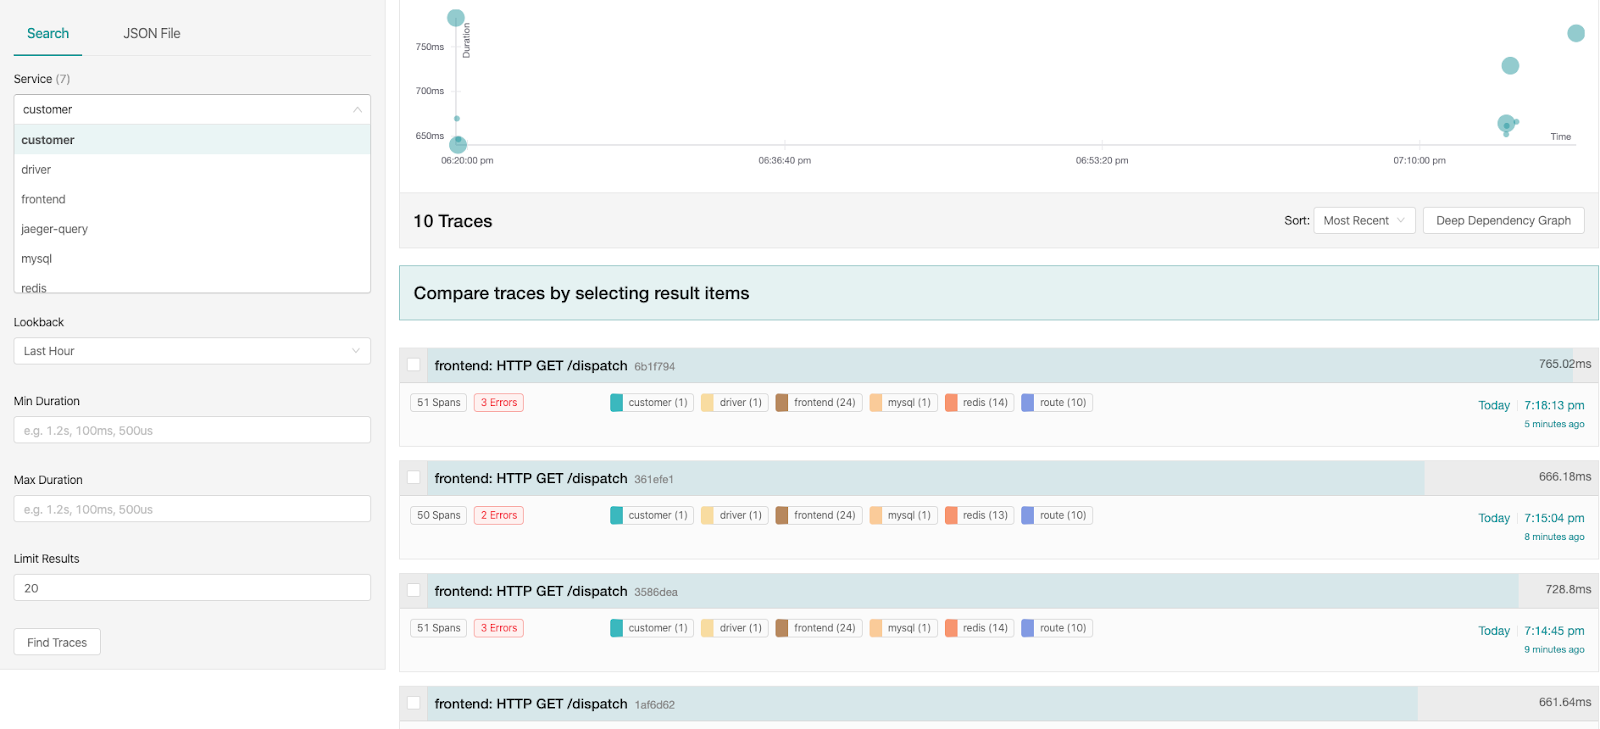
Distributed tracing comes in very useful in such scenarios. Here is a sample ride-hailing onDemand application that shows the usefulness of distributed tracing.
You can see individual traces in the Jaeger UI. The number of services this request passed through, the number of spans/events generated, the total time of the trace. You can also filter the traces based on service, duration and tags.
TraceView in Jaeger shows details of a trace listing out all events and their timings.
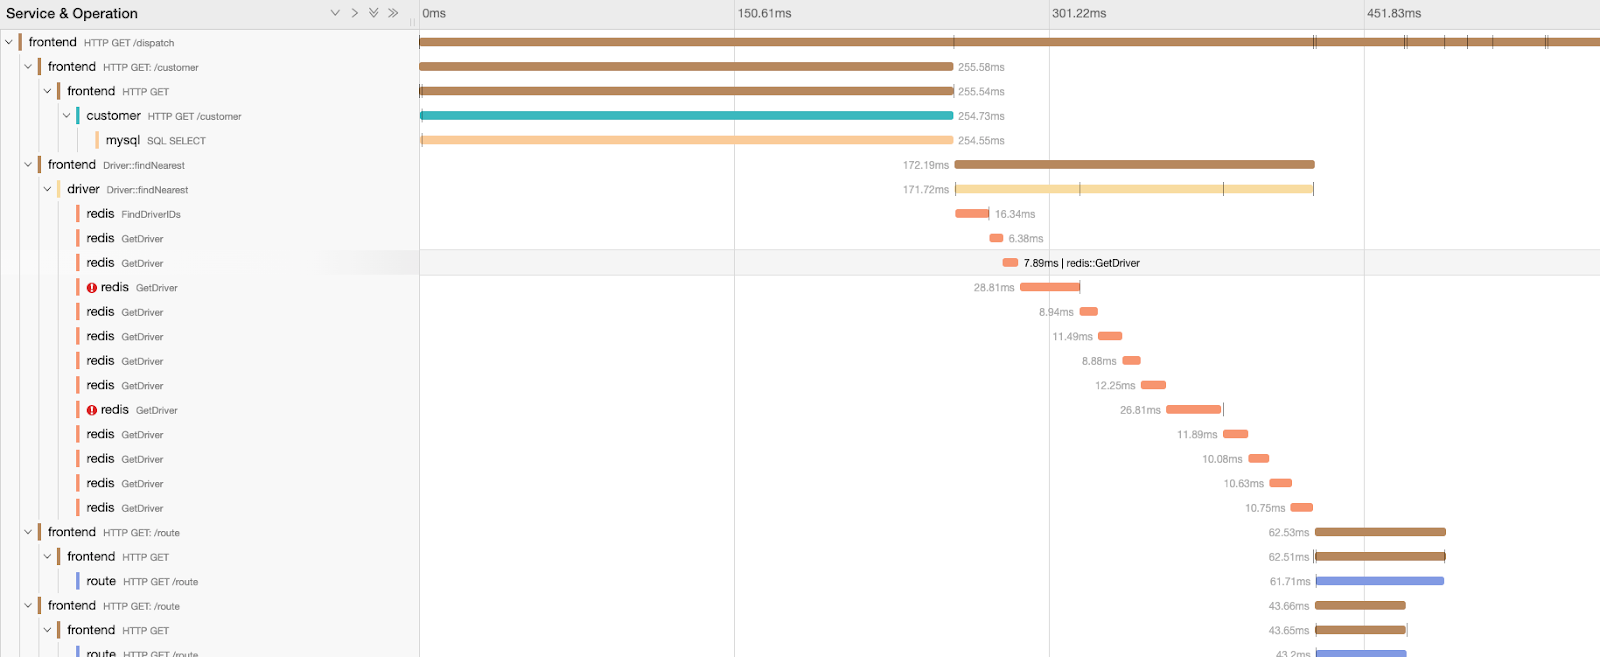
Also, on clicking on a span, you can see details about that span, like, tags associated with it.
A distributed trace shows you details about each execution step of a request and thus becoming very useful in debugging issues.
You can:
-
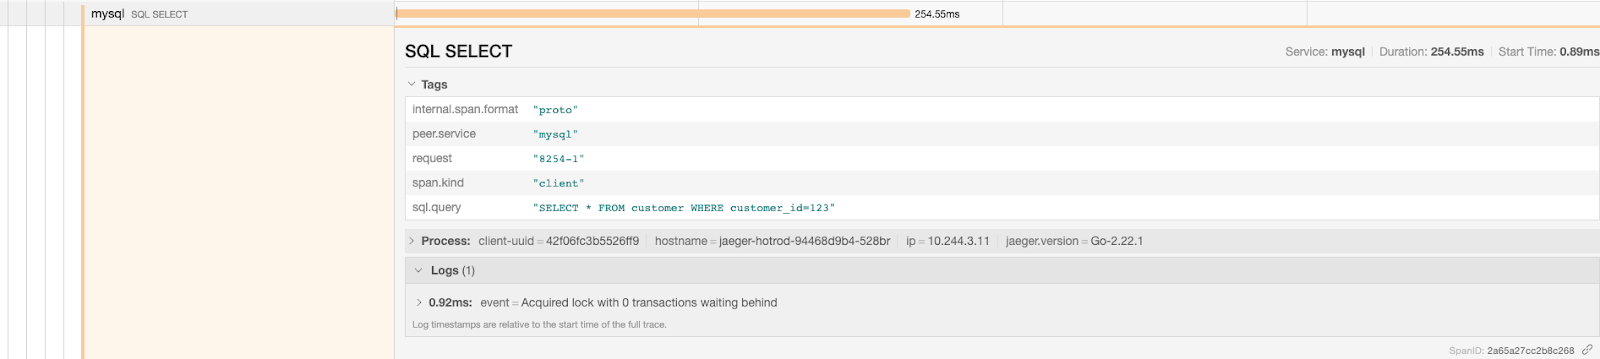
Look for errors in the spans
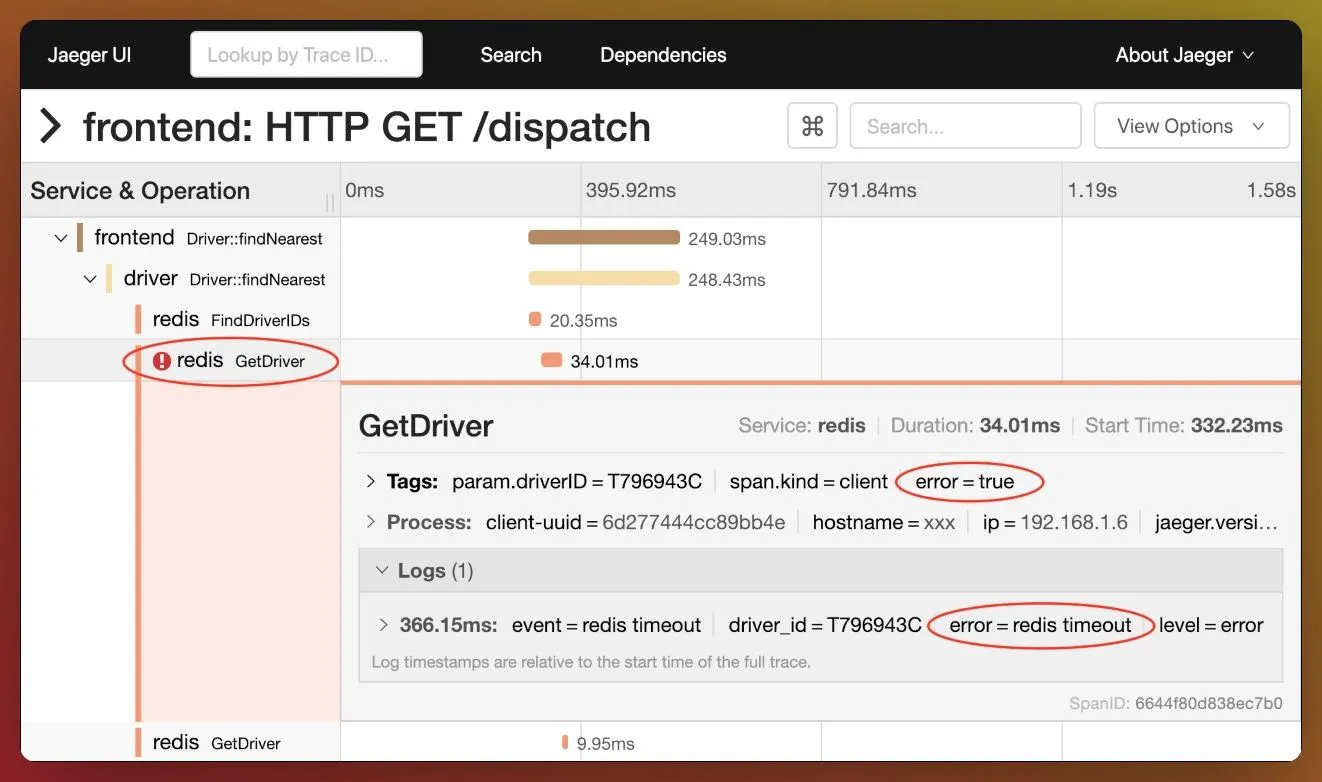 Errors in span
 -
Look for the longest span and try to optimize its time
-
Look for staircase pattern which means sequential execution is going on. You would like to review whether sequential execution is expected or needs to be paralleled
Staircase pattern meaning sequential execution
-
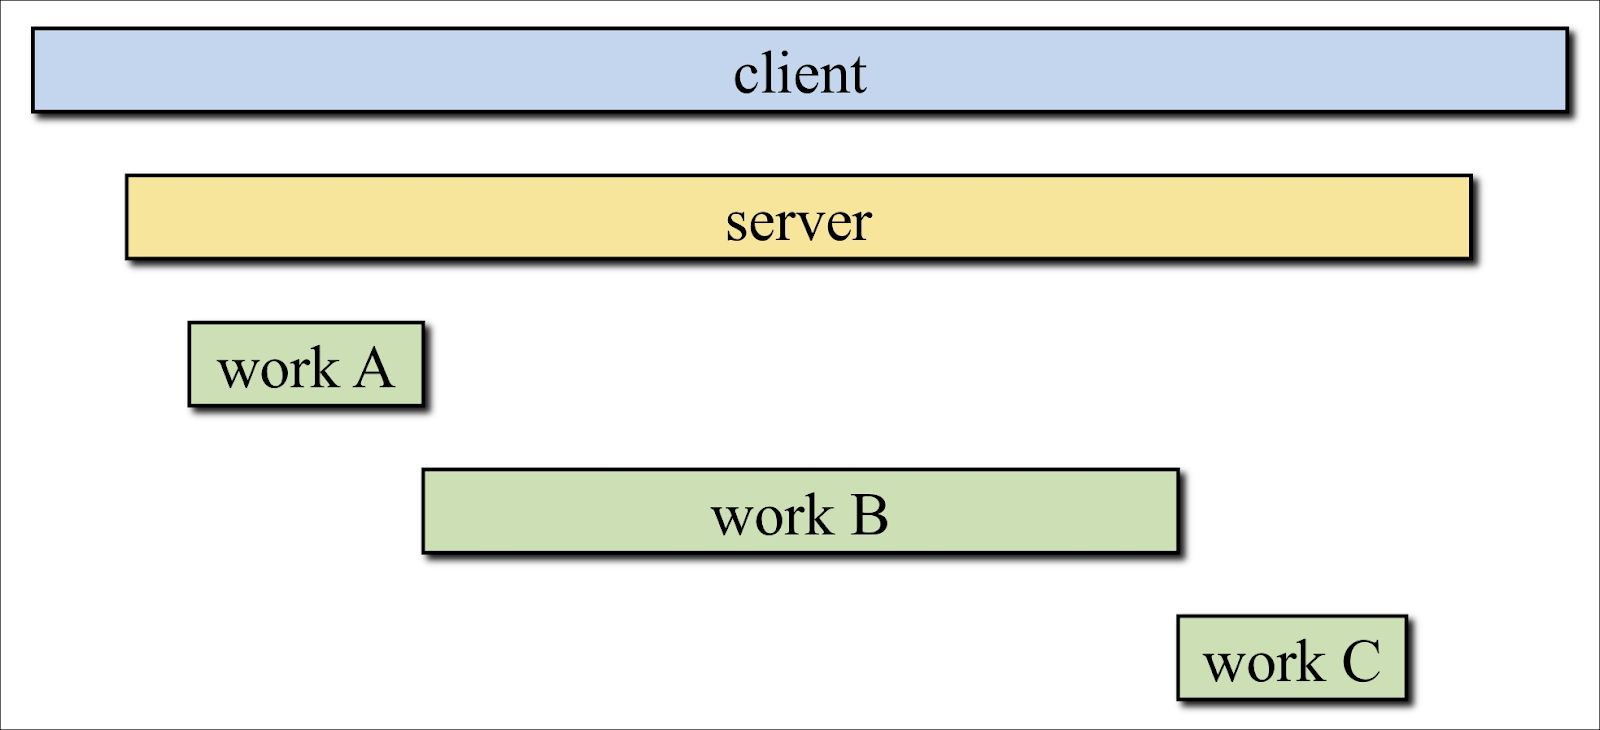
Look for spans ending at the same time. It may point out events like timeout, etc
Spans ending at the same time
Architecture of Jaeger
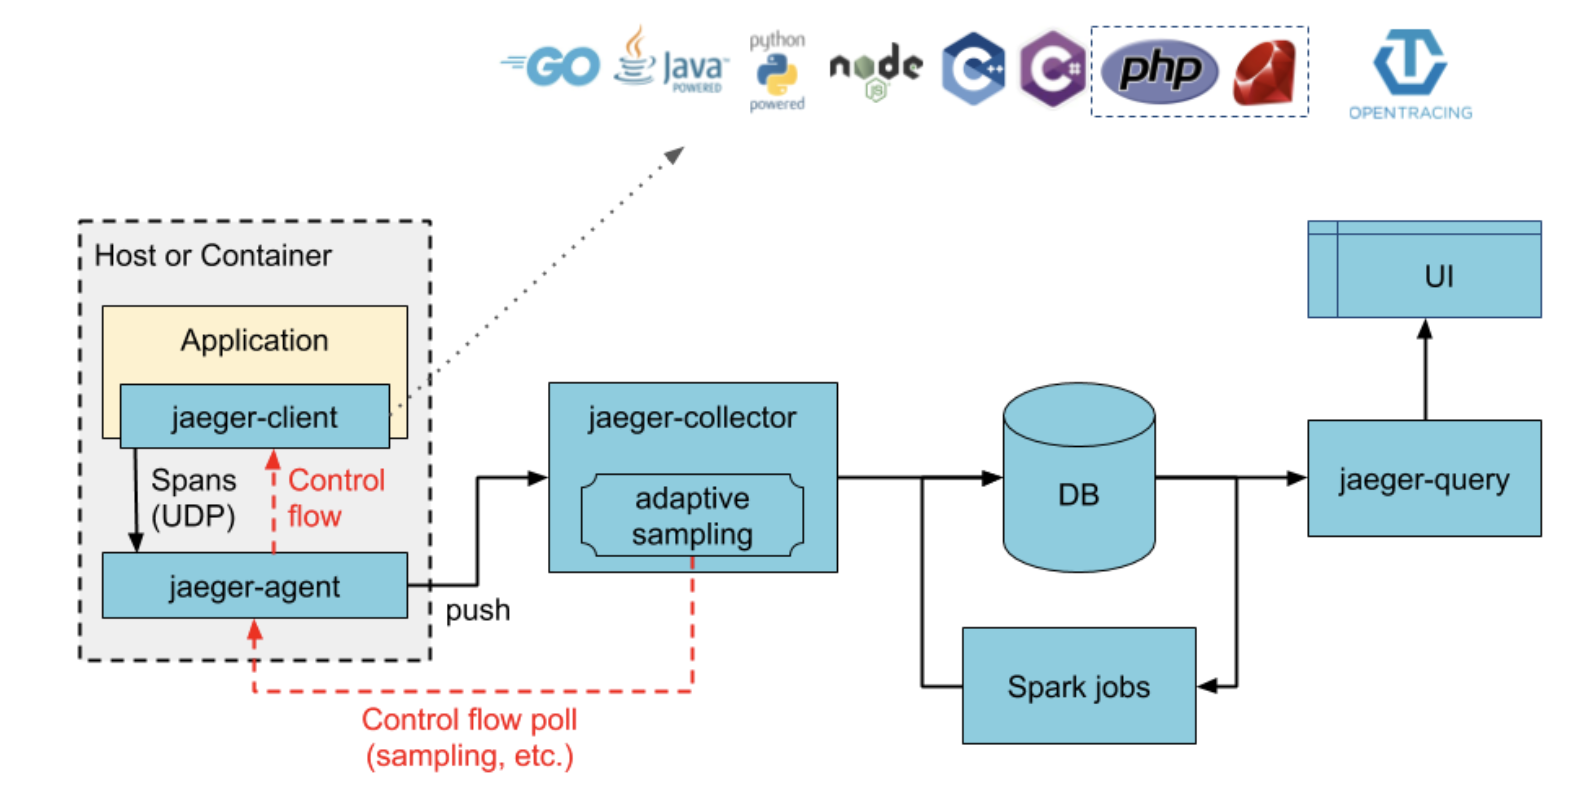
- Instrument your applications using jaeger-client which sends trace data to jaeger-agent
- Jaeger-Agent runs on each machine and receives data from all applications in that machine and forwards them to jaeger-collector
- Jaeger-Collectors collects data and processes to store it on DBs like Elastic and Cassandra.
- Jaeger Querier queries the DB and sends data to UI to visualise
Metrics and Tracing together
We saw how to setup metrics using Prometheus + Cortex. We also saw how to setup distributed tracing using Jaeger. Now, as a full solution, we want to run both metrics and traces to gain deep visibility into debugging issues. This means we have to run Prometheus + Cortex + Jaeger together. The architecture together looks like below image 👇
 Prometheus + Cortex + Jaeger - Quickly gets very complex
The above architecture uses both metrics and tracing data as independent silos, starting from different collectors to different queriers. We tried building a unified UI that can query metrics from Cortex querier and traces from Jaeger querier. But it quickly got very complex.
Need for Jaeger++
- The high-dimensional trace data is underutilised. We cannot run aggregates on trace data, like we cannot run SQLish queries on trace data as we can run on metrics data using Prometheus. Let's say you have a tag
customer_type=goldin the spans. You would like to get 99 percentiles of differentcustomer_typeand set different alert thresholds to them. This is not possible today in Jaeger. Another example, support you havepayment_channeltag in spans and want to be alerted whenpaypalis throwing errors. This cannot be done today.
The ability to run aggregates on filtered trace data can be very useful
-
We cannot set alerts on tracing data.
-
The UI of Jaeger is minimal.
-
Enterprise need multi-tenancy and RBAC control to restrict security threats and misuse inside the organisation
Why we built SigNoz?
- Metrics + Traces in a single pane
- Powerful Trace filtering and aggregation capabilities
- Set Retention rule easily from Dashboard
- Out of Box like SaaS, requiring minimal dev efforts
- 10x cheaper than DataDog [blog on cost benchmark]
- OpenSource and hence you control the data
- Scalable Stream Processing Architecture (Kafka + Druid)
- Default fullstack backend for OpenTelemetry instrumentation
- Enterprise features like RBAC + SSO (coming soon)
- OpenSource anomaly detection framework (coming soon)
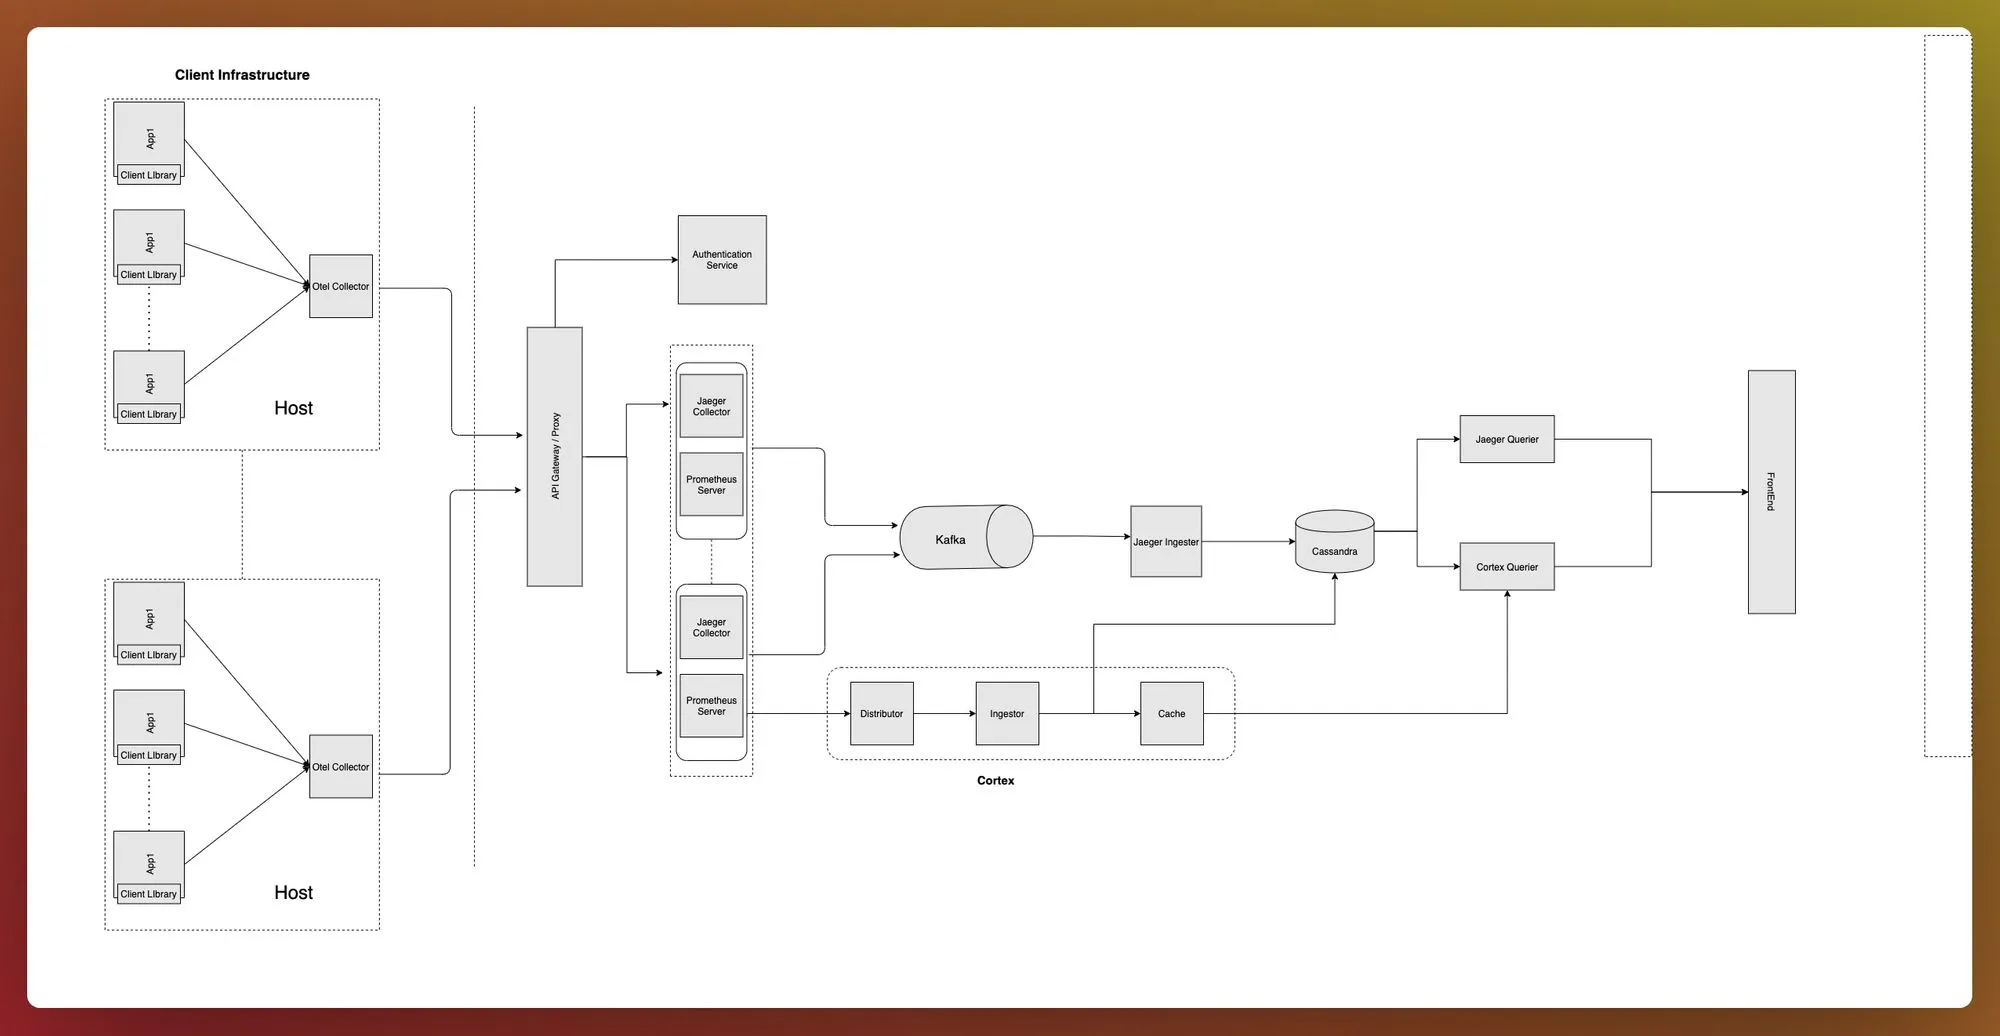
Architecture of SigNoz
Components
- OpenTelemetry Collector
- Kafka
- Stream Processors
- Apache Druid
- Query Service
- Frontend
OpenTelemetry Collector can receive data in multiple formats. It currently has receivers for the below formats:
- Jaeger Receiver
- Kafka Receiver
- OpenCensus Receiver
- OTLP Receiver
- Zipkin Receiver
OpenTelemetry Collector then exports those traces to a Kafka topic, otlp_spans.
Apache Kafka is a distributed streaming platform that can be used as message-driven backbone of communication. Applications can send messages between its components in the form of records that can be produced to Kafka topics and consumed from Kafka topics.
Our stream processing applications read from otlp_spans kafka topic and flattens the structure of spans to be ingested to databases like Druid. This flattener-processor writes to flattened_spans topic in kafka.
The flattened data is then ingested to Druid *which is a real-time analytics database* designed for fast slice-and-dice analytics (OLAP queries) on large data sets. We use streaming ingestion from Kafka to Druid.
Query Service is the interface between Frontend and Druid. It provides APIs to be consumed by frontend application and queries Druid to fetch data and process data before responding to the frontend.
Frontend is the UI, built in ReactJS and Typescript, provides advanced trace/span filtering capabilities and plot metrics to give service overviews.
Why we chose Apache Druid?
- Needed analytical DB to run aggregates on trace data
- Realtime ingestion from Kafka
- 3 types of Observability data into 1 datastore
- Individual components being scalable
- Writing to cost-effective S3 for deep storage
- Proven to handle scale. Used by AirBnB, Lyft, Netflix, Pinterest
How to start using SigNoz with OpenTelemetry?
OpenTelemetry is a vendor-neutral instrumentation framework that provides libraries and tools in various languages to start sending telemetry data compliant to a standard.
To gain observability into your applications you need to follow 2 steps:
-
Install SigNoz using instructions at installation docs. This installs all components needed to collect, process, analyze and visualize data.
-
Instrument your application using OpenTelemetry to start sending data to SigNoz. We have opentelemetry instrumentation docs for NodeJs, Java, Python, Golang and more to come.
For example: to instrument your Java application
Download the OpenTelemetry java instrumentation library and run the below command:
OTEL_EXPORTER_OTLP_ENDPOINT="http://<IP of SigNoz Backend>:55680" OTEL_RESOURCE_ATTRIBUTES=service.name=<app_name> java -javaagent:/path/to/opentelemetry-javaagent-all.jar -jar <myapp>.jar
where app_name is the name of the application and myapp is the jar file for that application. <IP of SigNoz Backend> is the IP of machine where SigNoz is installed.
That's all you need to see the beautiful dashboard of SigNoz with all your metrics and traces being explorable.
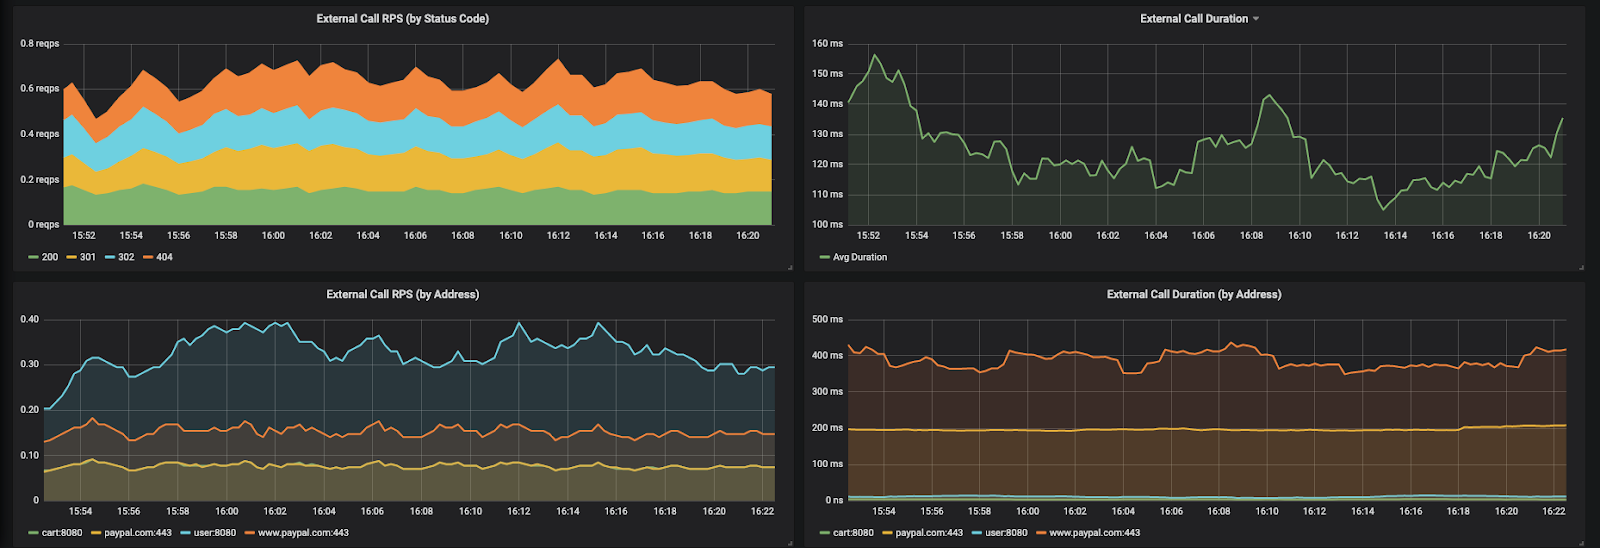
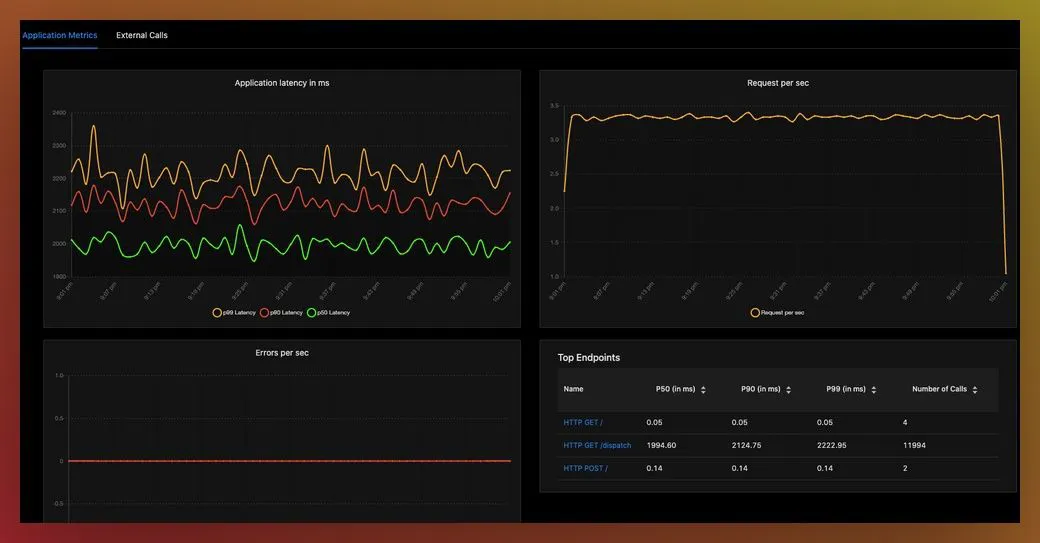 Application page in SigNoz
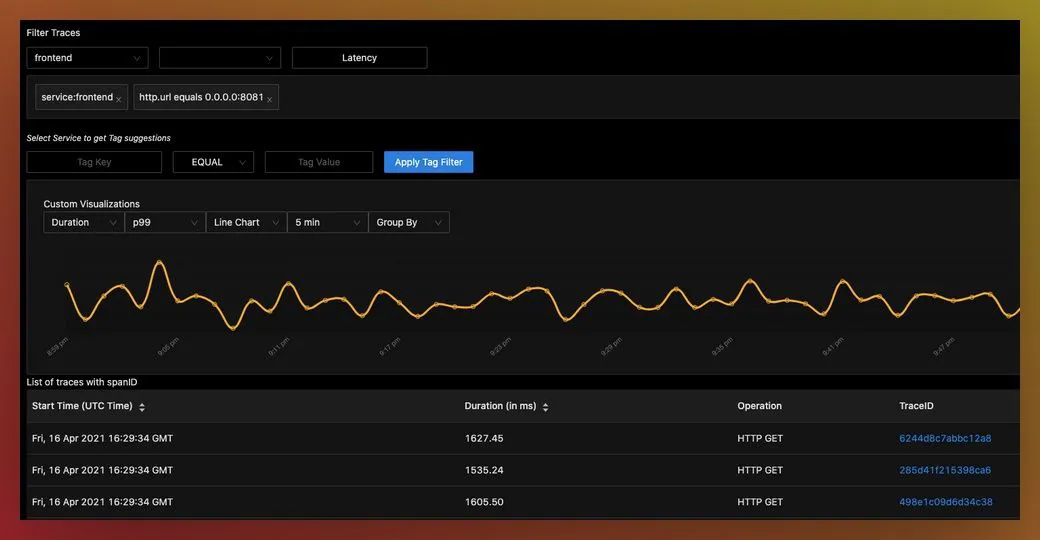 Trace Filtering page in SigNoz
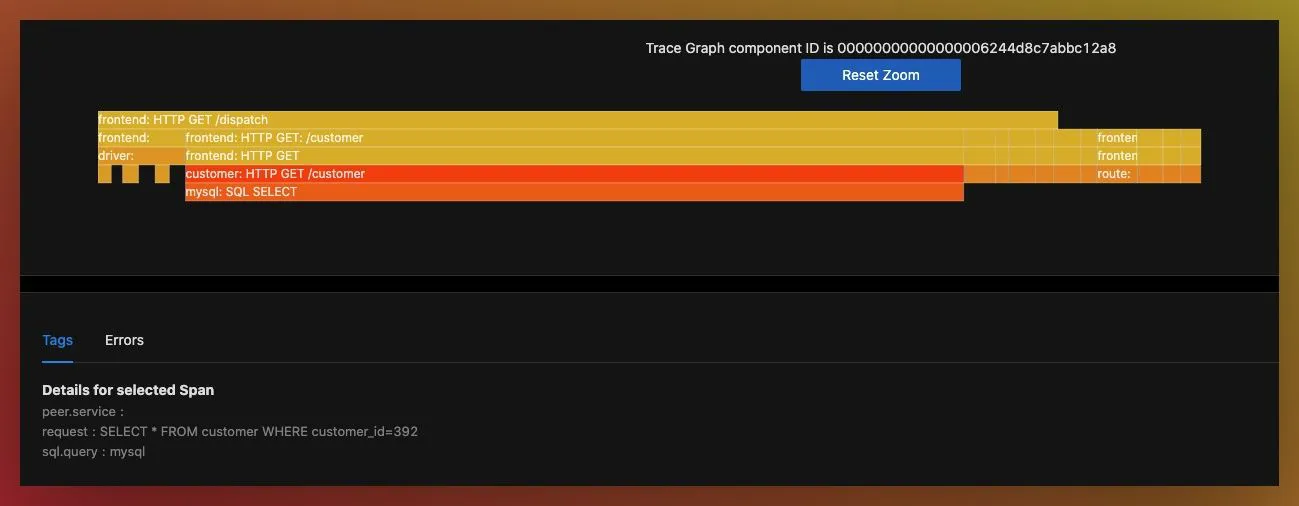 FlameGraph of a trace in SigNoz
Summary
In this blog, I have laid out why we created SigNoz and how it differentiates from other tools in the market today.
Would love to get any feedback on the product and if you like what we are doing - give us a star on our Github repo 👇
