Tracing Funnels - Define funnels b/w spans in your distributed systems
Distributed tracing has long been the go-to for understanding the performance of microservices and asynchronous systems. But as systems grow in complexity, simply viewing individual traces and spans isn’t enough. Teams need to answer questions like:
- How many requests successfully progress from checkout to payment within a single trace?
- Where do errors or slowdowns occur between key operations?
- What’s the average latency between critical spans?
SigNoz Tracing Funnels is here to change that, bringing the clarity of product analytics-style funnel analysis to backend traces, and doing so in a way that’s never been available before.
What Are Tracing Funnels?
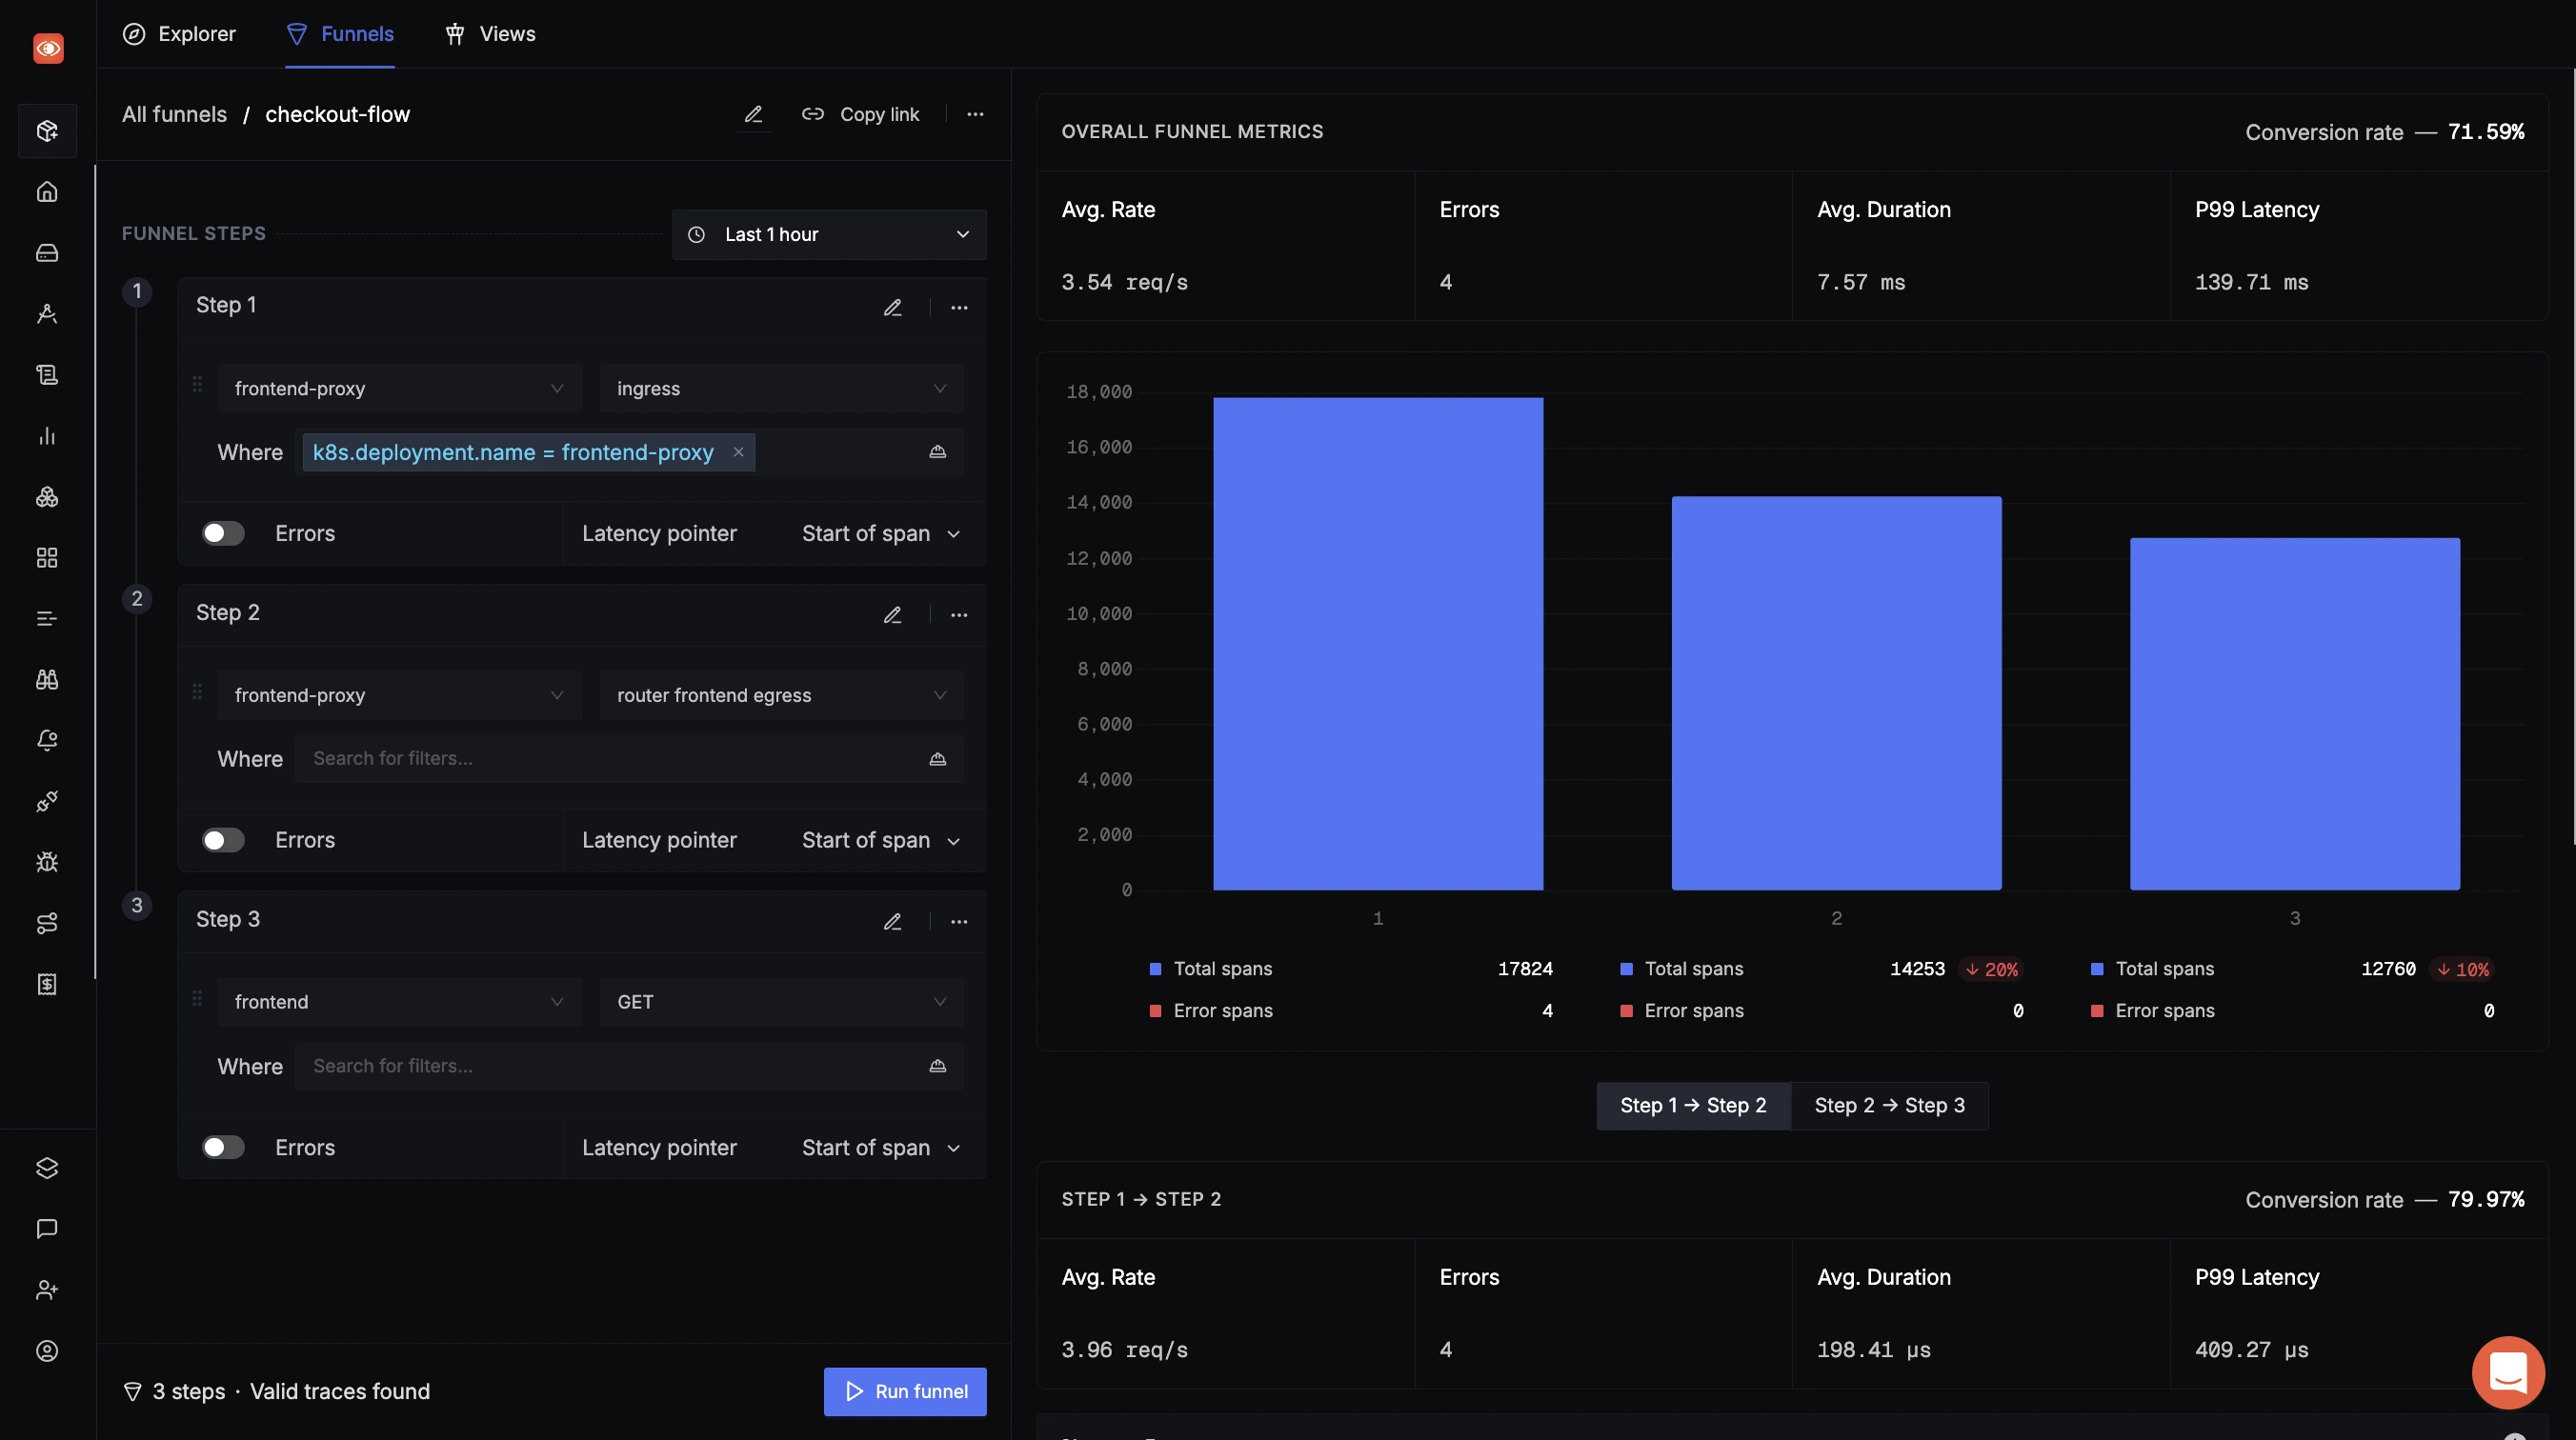
A funnel in observability measures how requests progress through sequential steps (spans) within a trace, highlighting drop-offs, errors, and latency. Unlike traditional tools that focus on root spans, Tracing Funnels let you:
- Define 2-3 spans (more coming soon) as funnel steps within the same trace.
- Compute conversion rates, error percentages, and latency distributions between selected spans.
- Drill down to problematic traces while preserving span hierarchy context.

What Makes Tracing Funnels Different?
SigNoz Tracing Funnels is the first feature in the observability industry that lets you define, analyze, and visualize funnels between any two or more spans, across multiple services, within your distributed traces. No other observability or tracing platform currently provides this level of aggregated, step-by-step analysis for backend flows.
How Tracing Funnels Work
1. Define Your Funnel Steps
- Select any two or three spans (service + operation) as sequential steps using a searchable dropdown.
- Steps can be from different services, as long as they appear within the same trace.
- Add funnel steps directly from the trace detail page for a seamless workflow.
2. Get Aggregated Metrics
- Rate: Number of traces that follow the funnel path per unit time.
- Errors: Number and percentage of traces with errors at each step, with step-level granularity.
- Duration: Time elapsed between steps, with percentiles (P50, P95, P99) and averages. You can configure whether to measure from start-to-start, end-to-start, etc.
3. Visualize and Drill Down
- Metrics are displayed over a selectable time window, with charts and tables for trends.
- Instantly access the slowest or failing traces matching your funnel criteria, and jump directly into detailed trace views for investigation.
4. Manage Funnels
- Edit, rename, or delete funnels as your system evolves.
- View a list of all funnels with quick stats like average latency and conversion rates.
What Can You Do With Tracing Funnels?
Tracing Funnels unlock a new way to analyze distributed systems, especially those with asynchronous or multi-service architectures:
- Define Multi-Stage Flows: Select significant spans as funnel steps, representing key operations in your distributed system.
- Measure Conversion and Drop-Off: Instantly see what percentage of traces progress from one step to the next, and where drop-offs or errors occur-just like product analytics, but for backend flows.
- RED Metrics Aggregation: View Rate (number of traces through the funnel), Errors (count and percentage, with step-level granularity), and Duration (latency between steps, with percentiles and averages).
- Drill Down for Root Cause: Quickly access the slowest or most error-prone traces matching your funnel criteria, and jump directly into detailed trace views for investigation.
- Flexible Analysis: Choose which timestamps to use for measuring latency (start-to-start, end-to-start, etc.), and filter by time window to spot trends or regressions.
For backend engineers and SREs, this means:
- Clarity Across Async and Microservice Flows: Answer questions that were previously tedious or impossible, such as “How long does it take for a request to move from checkout to payment?” or “Where are requests failing between key operations?”, even when those steps span multiple services or asynchronous calls, as long as they are part of the same trace.
- Actionable Insights, Not Just Raw Data: Instead of manually inspecting traces or writing custom scripts, you get an aggregated, analytics-style view of your system’s critical flows, helping you focus on the most impactful optimizations.
- Faster Troubleshooting: By surfacing conversion rates, errors, and latency between spans, Tracing Funnels help you quickly pinpoint bottlenecks and outliers, reducing investigation time and improving reliability.
- Seamless Integration: If you’re already sending trace data to SigNoz, you can start using Tracing Funnels immediately. No additional setup required.
Why This is a First-in-Industry Feature
While leading observability platforms like Datadog, New Relic, and Honeycomb offer distributed tracing, none allow you to define arbitrary multi-span funnels and compute conversion rates, drop-offs, and latency between selected spans, within a single trace, across multiple services, in the way SigNoz does. This is a new level of backend analytics, bringing product-analytics style funnel thinking to distributed tracing for the first time.
Getting Started
If your application is already instrumented with OpenTelemetry and sending traces to SigNoz, you can start using Tracing Funnels right away:
- Head to the Traces > Funnels tab.
- Define your funnel by selecting relevant spans.
- Analyze conversion rates, errors, and latency distributions.
- Drill down into the traces that matter most.
As you explore Tracing Funnels, you’ll find it easier to answer questions about system health, performance, and reliability-without the manual overhead.
Currently, Tracing Funnels is available only to beta users. While we’re testing and refining the feature, we’d love your input. If you spot something we missed or have ideas for improvement, please let us know in our Slack community or tag us on socials.
Launch Week 4.0
Check out all updates of Launch Week 4.0.
