Availability vs. Reliability - Key Differences in System Design
System design hinges on two critical concepts: availability and reliability. These metrics shape the user experience, operational efficiency, and overall success of any digital infrastructure. While often used interchangeably, availability and reliability represent distinct aspects of system performance. Understanding their differences — and how they interplay — is crucial for developers, system architects, and IT professionals aiming to build robust, high-performing systems.
What Are Availability and Reliability in System Design?
Availability refers to the percentage of time a system is operational and accessible, reflecting its readiness to perform intended functions. In distributed systems, it highlights the ability to remain functional despite failures across components spread across multiple nodes or locations. Higher availability signifies better performance and resilience.
Reliability, on the other hand, measures the likelihood of a system consistently performing its intended function without failure over a specified period under stated conditions. It emphasizes the consistency and dependability of operations, ensuring seamless performance over time.
Key differences between availability and reliability include:
| Key Differences | Availability | Reliability |
|---|---|---|
| Focus | Availability centers on accessibility | Reliability emphasizes consistent performance. |
| Measurement | Availability is measured as a percentage of uptime | Reliability is often expressed as a probability or mean time between failures (MTBF). |
| Time frame | Availability is typically measured over extended period | Reliability can be assessed for specific operational durations. |
High Availability and Strong Reliability
High availability and strong reliability both reflect a system's capacity to operate continuously with minimal downtime. However, they differ in focus: high availability centers on a system's uptime and accessibility, ensuring it remains operational for users, while strong reliability highlights consistent performance and resilience against failures, even under stress or unexpected conditions. In essence, high availability guarantees uninterrupted access, whereas strong reliability ensures the system functions correctly even when challenges arise.
Achieving the right balance between these two is vital for designing systems that not only perform effectively but also align with user expectations and business needs.
How to Measure Availability in System Design
Measuring availability offers a clear picture of a system's uptime and accessibility, often reflecting its resilience to failures. The required level of availability varies based on the system's purpose.
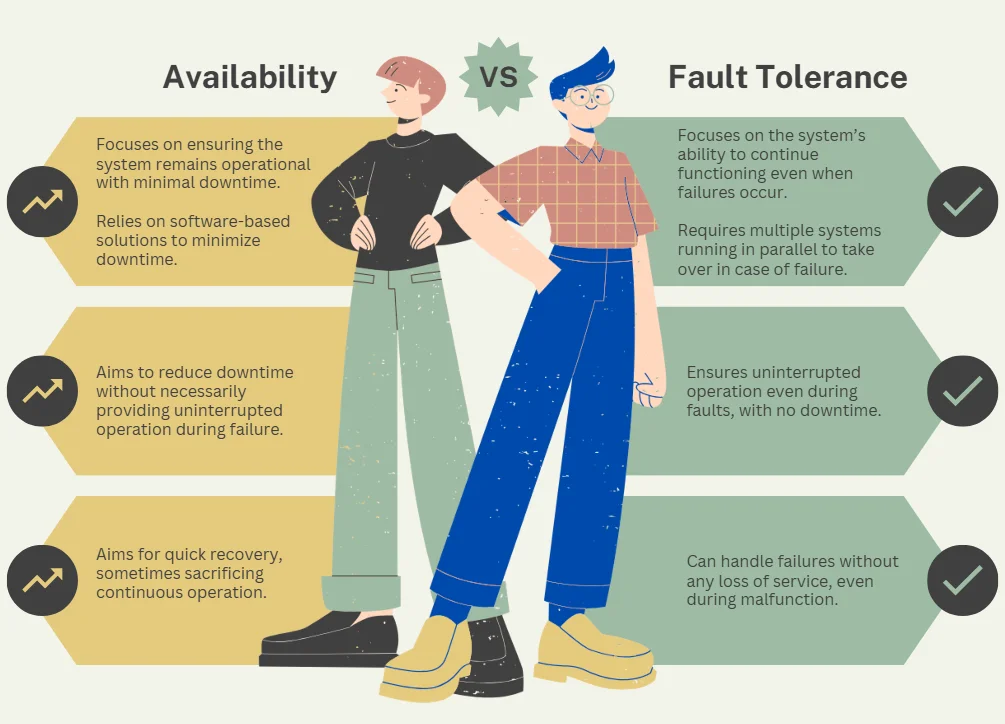
Critical systems like Air Traffic Control demand exceptionally high availability due to the severe consequences of even a single failure. In contrast, less critical systems can function effectively with lower availability requirements. Ultimately, achieving high availability involves costs, so optimizing it to align with specific needs is key.
Here's how to quantify and interpret this crucial metric:
Availability Formula
The availability formula is used to calculate the percentage of time a system remains operational and accessible to users. The basic formula for calculating availability is:
Availability = (Uptime / Total Time) x 100
For example, if a system operates for 98 hours out of a total 100-hour period, its availability would be:
Availability = (98 / 100) x 100 = 98%
The Concept of "Nines" in Availability
System designers often use the concept of "nines" to express availability targets. In the context of system availability, "nines" is a method of expressing uptime as a percentage by counting the decimal places of "9" in the figure. Each additional "9" represents a higher level of availability. For instance, "five nines" refers to 99.999% uptime, signifying exceptional system reliability with minimal downtime. This approach provides a quick way to communicate extremely high availability levels:
- Two nines (99%): 87.6 hours of downtime per year
- Three nines (99.9%): 8.76 hours of downtime per year
- Four nines (99.99%): 52.56 minutes of downtime per year
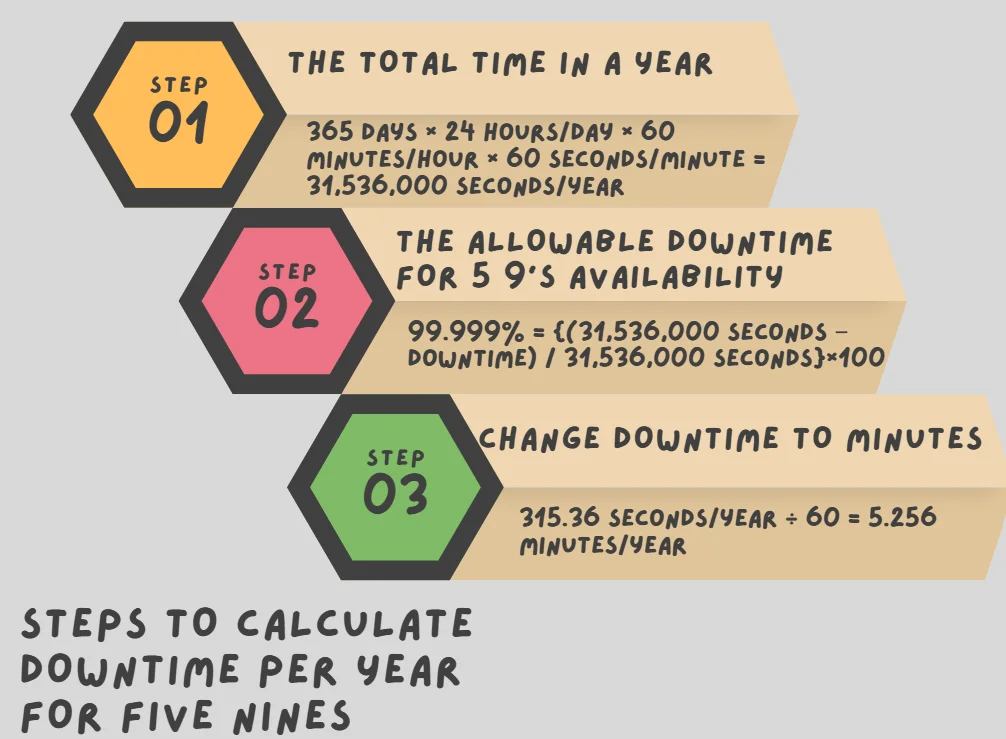
- Five nines (99.999%): 5.26 minutes of downtime per year
Let’s see step-by-step on how we calculated the downtime per year for five nines for example,
Common Availability Targets
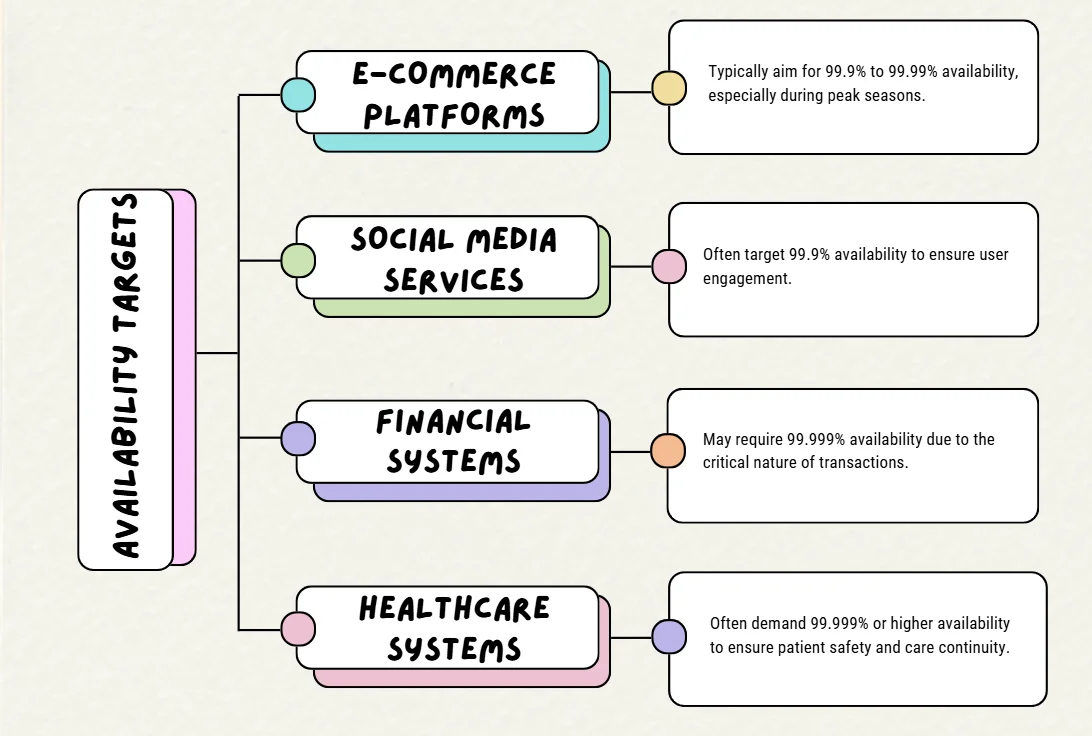
Different systems require varying levels of availability based on their purpose and criticality. Highly critical systems often require extremely high availability to ensure continuous operation, while less critical systems can function effectively with lower availability thresholds. These requirements are typically defined by the system's role and the potential impact of downtime.
Factors Affecting Availability Measurements
Several factors can impact availability calculations:
| Factors | Explanation |
|---|---|
| Planned maintenance | Some organizations exclude scheduled downtime from availability calculations. |
| Geographic distribution | Systems spread across multiple regions may have different availability levels in each location. |
| Service dependencies | The availability of dependent services can affect overall system availability. |
| Measurement granularity | The frequency of uptime checks can influence availability calculations. |
| Sequence vs Parallel | Overall availability decreases when two components are arranged in sequence but increases when they are configured in parallel. |
Real-world Examples of Availability Metrics
Availability metrics are crucial for understanding how reliable a service will be in terms of uptime. They provide service providers and customers with a clear understanding of the expected system performance and potential downtime.

- Amazon Web Services (AWS): Amazon EC2 (Elastic Compute Cloud) is a web service provided by Amazon Web Services (AWS) that allows users to rent virtual servers (called instances) in the cloud. AWS offers a service level agreement (SLA) of 99.99% availability for its EC2 service, which means customers can expect only about 4.38 minutes of downtime per month. This high level of availability ensures that businesses can rely on AWS for critical workloads.
- Google Cloud Platform: Google Cloud’s Compute Engine service guarantees 99.95% of availability, which equates to about 4.38 hours of downtime per year. This SLA ensures that customers can expect minimal disruption, even during peak usage times.
- Microsoft Azure: Azure provides 99.99% availability for virtual machines deployed across two or more availability zones, which translates to 52.56 minutes of potential downtime annually. This redundancy ensures that the system can handle failures and maintain uptime.
These examples highlight the high standards set by major cloud providers and the importance of availability in modern system design.
Understanding Reliability in System Design
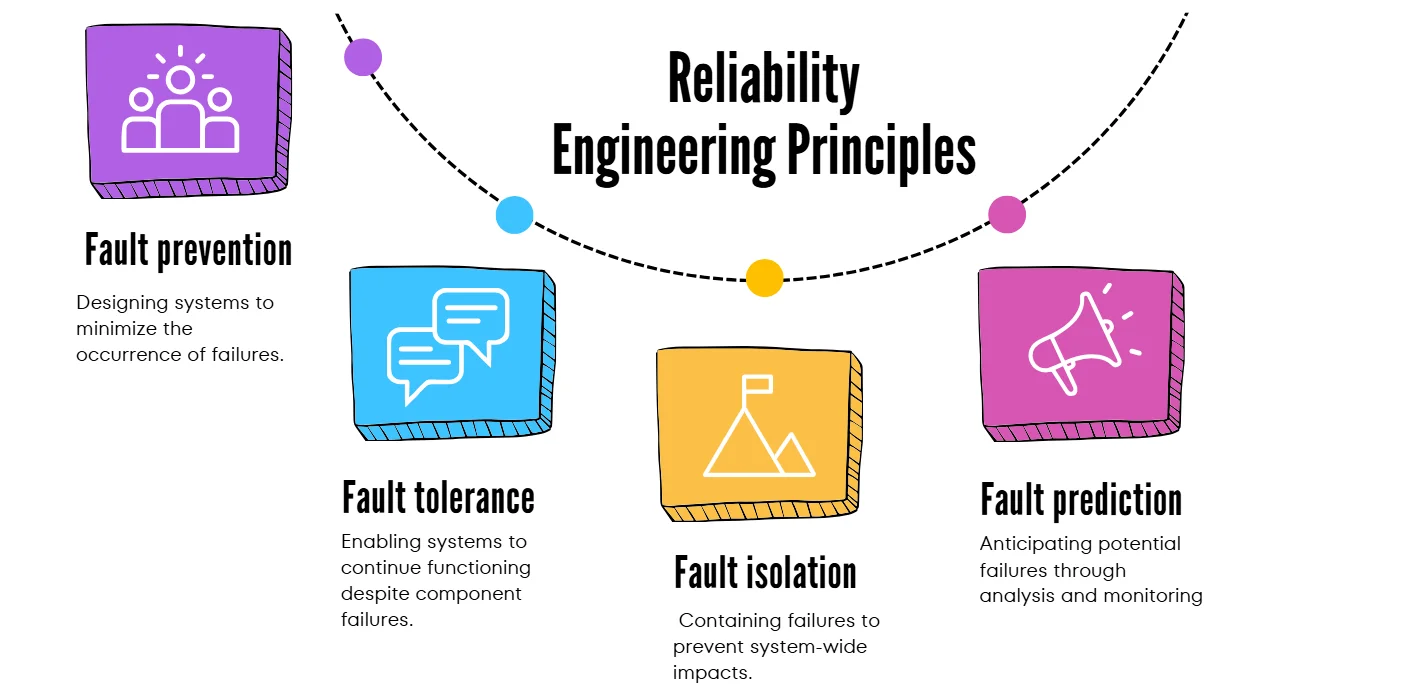
Reliability measures a system's ability to perform its intended functions consistently over time. Unlike availability, which focuses on uptime, reliability emphasizes the quality and consistency of system performance
Reliability Calculation
Reliability calculations are essential for understanding and ensuring that systems can meet their operational goals without failure.
The primary metric for measuring reliability is Mean Time Between Failures (MTBF) which represents the average time between two consecutive failures of a system. MTBF helps predict a system's expected uptime, allowing engineers to plan maintenance and assess the system's overall reliability.
MTBF = Total Operating Time / Number of Failures
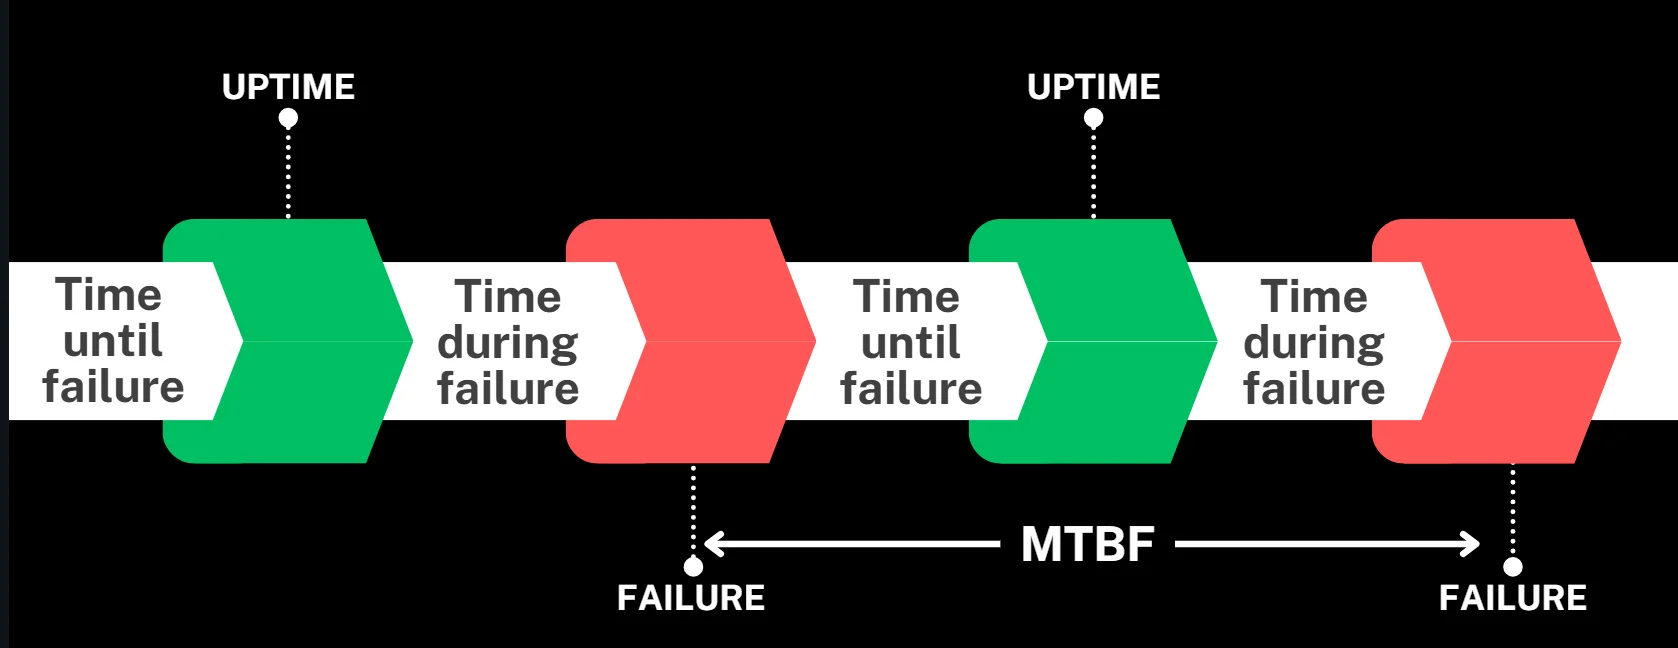
For instance, if a system operates for 1000 hours and experiences 5 failures:
MTBF = 1000 / 5 = 200 hours
This means the system, on average, operates for 200 hours before experiencing a failure.
Components of Reliability
Reliability encompasses three main factors:
- Hardware reliability: This refers to the ability of physical components to function properly without failure over time. For example, servers and hard drives that are designed with redundancy and failover mechanisms can handle hardware failures without causing system downtime. An example of this is using RAID (Redundant Array of Independent Disks) in storage systems, which ensures data availability even if one disk fails.
- Software reliability: This involves the ability of software systems to operate without crashes or errors, even under stressful conditions. For example, a banking application that handles millions of transactions per day needs to be free from bugs and ensure accurate processing. An example of improving software reliability is automated testing (unit tests, integration tests) that helps identify and fix bugs before deployment.
- Human factors: Human interaction and decision-making can significantly impact system reliability. For instance, incorrect system configurations by administrators or mistakes in deploying code can lead to failures. An example is training staff on best practices for system maintenance, like proper deployment procedures, to reduce the chance of human error causing system outages.
Impact of Reliability on User Experience and Business Operations
High reliability directly translates to:
- Improved user satisfaction and trust: Users are likelier to engage with a system that consistently performs well, leading to increased loyalty and long-term use.
- Reduced operational costs due to fewer failures: Less downtime and fewer system failures mean less need for troubleshooting and repairs, reducing maintenance costs.
- Enhanced brand reputation: A reliable system builds a positive image for the company, encouraging customer retention and attracting new users.
- Increased productivity and efficiency: Reliable systems ensure smooth operations, allowing employees and users to complete tasks without interruptions, leading to higher output.
Strategies to Improve System Reliability
Enhancing system reliability requires a multifaceted approach:
1. Implement Redundancy
Redundancy ensures a system remains operational even when certain components fail. Critical functions can switch seamlessly to secondary resources by deploying backup components or systems. The example below demonstrates how a simple load balancer can route requests to active servers, ensuring high reliability.
# Simple load balancer in Python
class Server:
    def __init__(self, name, active=True, load=0):
        self.name = name
        self.active = active
        self.load = load

    def is_active(self):
        return self.active

    def current_load(self):
        return self.load

def route_request(servers):
    # Filter out inactive servers
    active_servers = [s for s in servers if s.is_active()]
    if not active_servers:
        raise Exception("No active servers available")
    # Route to the server with the lowest current load
    return min(active_servers, key=lambda s: s.current_load())

# Example usage
servers = [
    Server("Server1", active=True, load=10),
    Server("Server2", active=False, load=5),
    Server("Server3", active=True, load=7),
]

try:
    selected_server = route_request(servers)
    print(f"Request routed to: {selected_server.name}")
except Exception as e:
    print(f"Error: {e}")
In this example:
- The
Serverclass represents individual servers with attributes for activity status and load. - The
route_requestfunction filters active servers and selects the one with the lowest load usingmin(). - If no active servers are available, an exception is raised to indicate system failure.
Output:
Request routed to: Server3
This approach demonstrates redundancy by ensuring only active servers handle requests, allowing the system to continue functioning even if some servers fail.
2. Use fault tolerance techniques
Design systems to continue functioning despite partial failures.
- Replication: Duplicate critical components or data (e.g., database replication) to ensure availability during failures.
- Failover mechanisms: Automatically switch to a backup system when the primary system fails (e.g., cloud load balancers).
- Circuit breakers: Prevent cascading failures by isolating problematic components.
We’ll learn more about this further in this article.
3. Conduct thorough testing
Implement comprehensive test suites, including unit tests, integration tests, and stress tests.
# Example: Unit test for a critical function
import unittest

class TestCriticalFunction(unittest.TestCase):
    def test_normal_operation(self):
        self.assertEqual(critical_function(5, 10), 15)

    def test_edge_cases(self):
        self.assertEqual(critical_function(0, 0), 0)
        self.assertRaises(ValueError, critical_function, -1, 10)
4. Implement proper error handling
Build robust mechanisms to manage errors effectively, such as:
- Graceful degradation: Allow partial functionality instead of a full system crash (e.g., serving cached data if the database is down).
- Detailed logging: Use structured logging (e.g., JSON) to capture critical error details for faster debugging.
- Retry policies: Implement retries with exponential backoff for transient errors like network timeouts.
5. Perform regular maintenance
Schedule routine checks and updates to prevent system breakdowns:
- Patch management: Regularly update software and firmware to fix security vulnerabilities and bugs.
- Hardware inspections: Check servers, storage devices, and network components for signs of wear and tear.
- Database optimization: Run cleanup tasks like indexing and removing stale data to maintain performance.
6. Monitor system health
Implement continuous monitoring to identify and address issues proactively:
- Infrastructure monitoring: Use tools like Prometheus or CloudWatch to monitor CPU, memory, and disk usage.
- Application performance monitoring (APM): Use platforms like New Relic to track request latency and throughput.
- Alerting systems: Set up threshold-based alerts for anomalies (e.g., spike in error rates).
The Relationship Between Availability and Reliability

Availability and reliability are closely interconnected but distinct concepts in system design:
- Reliability contributes to availability: A reliable system fails less often, which naturally results in higher availability. For instance, a reliable database engine with fault-tolerant mechanisms ensures fewer interruptions, boosting system uptime.
- High reliability doesn't guarantee high availability: Even if a system operates flawlessly when functional, frequent or lengthy maintenance periods can reduce availability. For example, a reliable on-premises server might need extended downtime for hardware upgrades, reducing overall availability.
- Balancing act: System designers must weigh the trade-offs between reliability, availability, and cost.
- Improving reliability: Often involves redundancy or using higher-quality components, which can be costly. For example, an aerospace system may use redundant hardware and extensive testing to ensure reliability, driving up expenses.
- Enhancing availability: Distributed architectures or cloud-based solutions can maintain services during failures. For instance, Netflix uses microservices and cloud regions to keep its platform available, even during localized outages.
- Scenarios of imbalance:
- High reliability, low availability: A system with near-perfect reliability (99.999%) but scheduled downtime for updates (e.g., nightly backups) might reduce availability to 90%. For example, a legacy banking system may be reliable but unavailable during maintenance windows.
- High availability, low reliability: A highly available system might remain operational but experience performance degradation under heavy loads. For instance, an e-commerce platform that remains online during a sale might show slow response times, reducing user trust and perceived reliability.
Maintainability: The Third Pillar of System Performance
Maintainability complements availability and reliability in system design. It measures the ease and speed with which a system can be repaired or modified.
Key Maintainability Metrics
Mean Time To Repair (MTTR): The average time required to fix a failed system. MTTR measures the average time needed to restore a failed system or component to normal operation. It reflects how quickly your team can respond to and resolve issues, which directly impacts system uptime. A lower MTTR indicates better maintainability and faster recovery.
MTTR = Total Repair Time / Number of RepairsMean Time To Detect (MTTD): The average time it takes to identify a system issue. MTTD gauges the average time taken to identify a problem in the system after it occurs. It highlights the efficiency of monitoring and alerting mechanisms. Shorter MTTD values indicate that issues are being detected quickly, reducing their potential impact on users and services.
Strategies for Improving System Maintainability
Modular Design
A modular system architecture divides the application into loosely coupled, self-contained components. This approach allows teams to update, replace, or repair specific parts of the system without impacting others. For example, if a payment service in an e-commerce platform needs an update, it can be modified independently without affecting the user interface or inventory systems. This not only reduces downtime but also makes it easier to test and deploy changes.
Comprehensive Documentation
Maintaining detailed and up-to-date documentation ensures that all aspects of the system—such as configurations, workflows, and troubleshooting steps—are clearly outlined. Runbooks, which provide step-by-step instructions for handling specific issues or tasks, are particularly valuable during incidents. This documentation speeds up onboarding for new team members and minimizes confusion during critical moments, enabling teams to resolve problems more efficiently.
Automated Deployment and Rollback
Continuous Integration and Continuous Deployment (CI/CD) pipelines automate the process of building, testing, and deploying code. These pipelines not only reduce human error but also allow quick rollbacks in case a deployment introduces bugs or causes failures. For instance, if a new release breaks functionality, an automated rollback can swiftly restore the previous stable version, minimizing disruptions and ensuring service continuity.
Monitoring and Logging
Implementing robust monitoring and logging solutions helps teams keep a close watch on the system's health. Monitoring tools can track performance metrics like CPU usage, memory consumption, and response times, while logging tools capture detailed events within the system. Together, they enable proactive issue detection and rapid root-cause analysis, allowing teams to address problems before they escalate into major outages.
Monitoring Availability and Reliability with SigNoz
SigNoz offers a comprehensive solution for monitoring system availability and reliability. This open-source application performance monitoring (APM) tool provides real-time insights into your system's health and performance.
Setting Up SigNoz for Availability and Reliability Monitoring
SigNoz Cloud is the easiest way to run SigNoz. Sign up for a free account and get 30 days of unlimited access to all features.
You can also install and self-host SigNoz yourself since it is open-source. With 24,000+ GitHub stars, open-source SigNoz is loved by developers. Find the instructions to self-host SigNoz.
- Instrument your application: Add the SigNoz SDK to your application code. Refer to this article.
- Configure custom metrics: It involves defining specific performance indicators for availability and reliability that are tailored to your system's needs. In the SigNoz dashboard, you can set up and track these metrics to monitor key aspects like uptime, response time, and error rates, ensuring your system operates within desired performance standards.
- Set up alerts: It involves configuring custom thresholds for system availability and reliability metrics, ensuring that you are notified when performance deviates from expected levels. This helps proactively manage issues by alerting the team in real time, based on specific parameters like response times or downtime. For example, SigNoz provides an intuitive alert configuration interface to easily define and manage these alert conditions.
Benefits of Using SigNoz
- SigNoz enables real-time monitoring, allowing you to track system health and performance as it happens.
- It offers customizable dashboards to visualize key metrics for availability and reliability, tailored to your needs.
- Automated alerting ensures quick detection of issues by notifying you when performance thresholds are breached.
- Detailed transaction tracing helps pinpoint the root cause of problems swiftly, facilitating faster resolutions.
Designing for High Availability vs. High Reliability
While availability and reliability often go hand in hand, certain scenarios may prioritize one over the other.
Architectural Considerations for High Availability
Load balancing: Distribute traffic across multiple servers to prevent single points of failure.
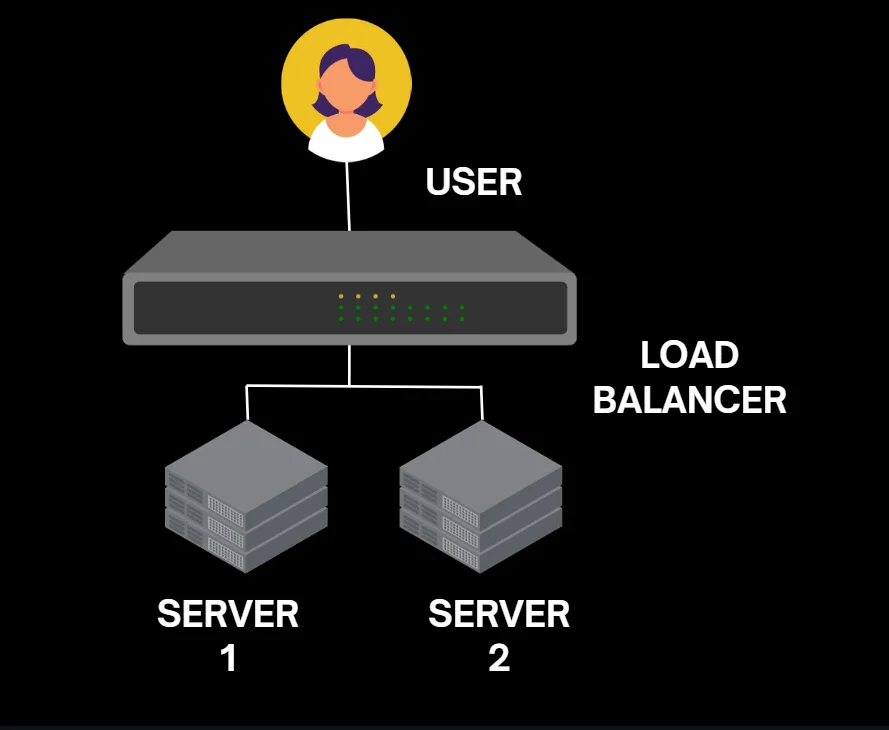
Load balancing across multiple servers A key principle of high availability is removing single points of failure. A single point of failure refers to any system component whose failure would lead to the entire system malfunctioning.
An example of this is load balancing across multiple servers.
Geographic distribution: To enhance high availability, deploy services across multiple regions to minimize the impact of location-specific outages. Hosting in different geographic zones can help maintain service continuity if a server experiences an issue. The February 2017 AWS outage highlighted the significant impact a regional failure can have, demonstrating the importance of geographic redundancy in maintaining availability.
Autoscaling: Autoscaling ensures high availability by dynamically adjusting resources based on real-time demand. During traffic spikes, it automatically adds resources (like virtual machines or containers) to handle the load, and during low-demand periods, it scales down to reduce costs. This flexibility helps maintain consistent performance and prevents system outages due to resource exhaustion.
Microservices: Infrastructure as a single system houses all application components together, simplifying management but creating a single point of failure. Microservices address this by breaking applications into independent services, improving resilience if one fails. However, this approach increases complexity, requiring more tools, resources, and effort to manage and maintain.
Design Patterns for Improving System Reliability
Patterns are repeatable solutions that combine components to address common challenges. They promote best practices, ensuring consistency and helping users achieve their goals effectively.
Let’s look at few design patterns that aim to improve system reliability:
Circuit Breaker Pattern: The circuit breaker pattern helps prevent cascading system failures. It operates similarly to an electrical circuit breaker, temporarily disabling failing services to avoid causing further issues across the system.
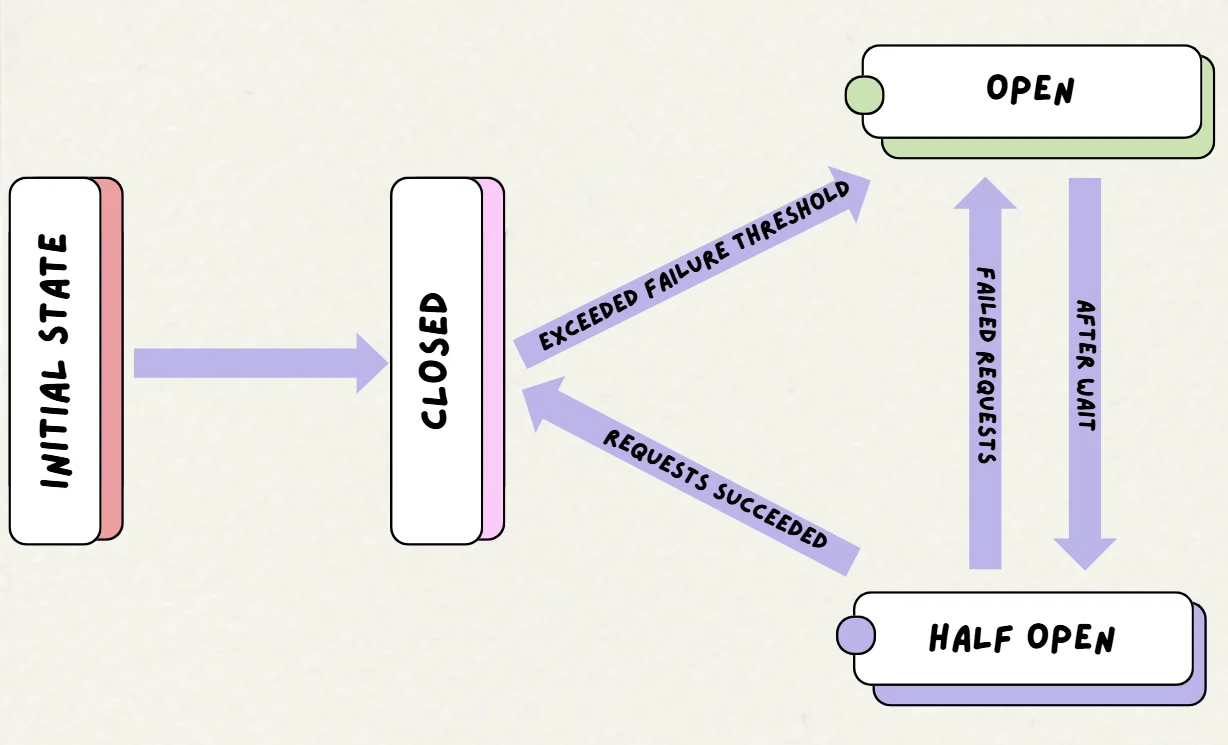
Circuit Breaker Pattern Retry Pattern: This pattern automatically retries operations that fail, enabling recovery from temporary issues without causing immediate system failure. It helps handle transient faults by re-executing failed tasks.
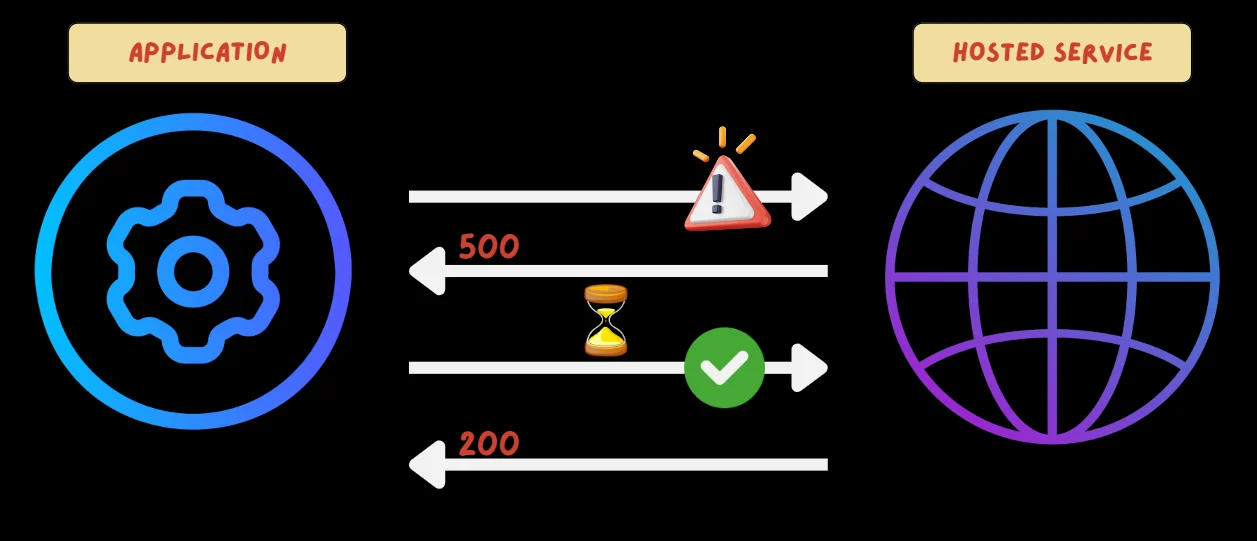
Retry Pattern For an example, let’s take an application that attempts to perform an operation on the hosted service, but the initial request fails with an HTTP 500 (Internal Server Error). The application waits for a longer interval before trying again, and this time, the request succeeds with an HTTP 200 (OK).
Bulkhead Pattern: The bulkhead pattern isolates components to prevent failures from spreading across the system.

Bulkhead pattern Similar to partitions in a ship’s hull, if one section fails, others continue to operate, ensuring the system remains functional. This design helps limit the impact of failures.
A Netflix Case Study: High-Availability and High-Reliability Systems
Netflix serves as a benchmark for building high-availability and high-reliability systems, leveraging cutting-edge practices and technologies to maintain seamless service. At the core of its strategy lies a microservices architecture, which divides the platform into smaller, independent services. This design ensures that a failure in one component doesn’t cascade through the system, preserving overall functionality.

- Chaos Engineering: Netflix employs chaos engineering to proactively test system resilience. Tools like Chaos Monkey deliberately cause controlled disruptions, such as disabling random instances in the cloud infrastructure. This practice validates the platform's ability to withstand unexpected outages while ensuring uninterrupted user experiences.
- Geographically Distributed Data Centers: The company further bolsters reliability through geographically distributed data centers, which reduce the impact of regional outages. Load balancing distributes traffic evenly across servers, preventing overloading and ensuring consistent service. Multi-region backups enable rapid data recovery during disasters, minimizing downtime and safeguarding availability.
- Eventual Consistency in NoSQL Databases: Netflix’s use of eventual consistency in its NoSQL databases ensures partition tolerance and high availability. While data may not be immediately consistent across systems, this approach supports the platform’s need for scalability and fault tolerance.
- Service-Level Prioritized Load Shedding: Another critical innovation is service-level prioritized load shedding. This mechanism guarantees 100% availability for user-initiated requests even under stress, while throttling non-critical prefetch requests. This prioritization maintains an optimal user experience, even during peak loads or latency spikes.
Key Takeaways
- Availability measures system uptime, while reliability focuses on consistent performance without failures. Both metrics are crucial for overall system performance and user satisfaction.
- Availability is typically expressed as a percentage, often using the "nines" notation.
- Reliability is measured using metrics like Mean Time Between Failures (MTBF).
- Maintainability complements availability and reliability, focusing on ease of system repairs and modifications.
- Balancing availability, reliability, and maintainability is key to optimal system design.
- Tools like SigNoz can help monitor and improve both availability and reliability.
FAQs
What's the difference between five nines and four nines availability?
Five nines (99.999%) availability allows for only 5.26 minutes of downtime per year, while four nines (99.99%) allow for 52.56 minutes. This difference is crucial for systems where every second of downtime has significant impacts.
Can a system be reliable but not available?
Yes, a system can be reliable (performing correctly when operational) but have low availability due to frequent maintenance or external factors causing downtime.
How do cloud services impact system availability and reliability?
Cloud services often enhance availability through distributed architectures and global presence. However, they introduce dependencies on third-party infrastructure, which can impact overall system reliability if not managed properly.
What are some common tools for measuring system availability and reliability?
Popular tools include:
- SigNoz for comprehensive APM and tracing
- Prometheus for metrics collection
- Grafana for visualization
- PagerDuty for incident management
