Dynatrace vs New Relic - A Detailed Comparison for 2026
Dynatrace and New Relic are monitoring tools that provide a wide range of products and services for monitoring. In this post, I have compared Dynatrace and New Relic on important features like APM, log management, infrastructure monitoring, etc.
💡 I instrumented a sample Python application and sent data to Dynatrace and New Relic to evaluate my experience. Some takeaways are subjective and based on personal preference.

Dynatrace vs New Relic: Overview
| Features | Dynatrace | New Relic |
|---|---|---|
| Getting Started | ✅ ✅ | ✅ ✅ |
| Data Integration | ✅ | ✅ ✅ |
| Infrastructure Monitoring | ✅ ✅ | ✅ |
| APM | 🟡 | ✅ ✅ |
| Log Management | ✅ ✅ | ✅ |
| Documentation and Community Support | ✅ ✅ | ✅ ✅ |
| Pricing | 🟡 | ✅ |
| UI/UX | ✅ | ✅ ✅ |
✅ ✅ - Excellent
✅ - Good
🟡 - Limited
Getting Started: Both tools
Dynatrace
I found the onboarding process for Dynatrace straightforward. After providing my email address and basic personal information, the account setup was completed in approximately 3 minutes.
New Relic
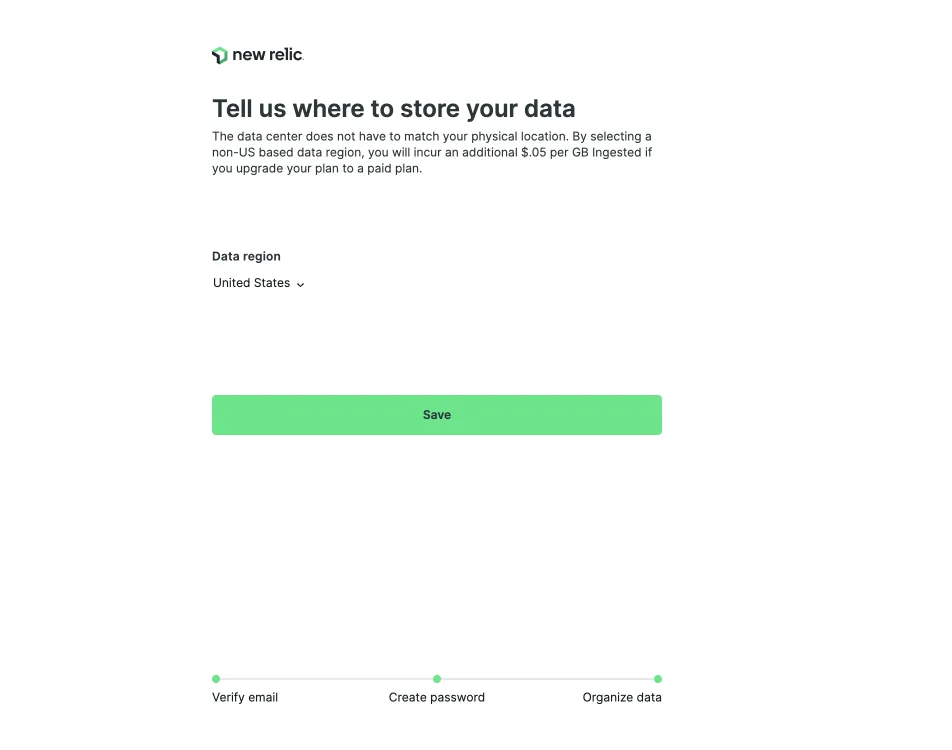
The onboarding process for New Relic was easy as well. After providing my email address, verifying it, setting up a password, and choosing my data region, my New Relic account was set up in under a minute.
Data Integration: New Relic
Dynatrace
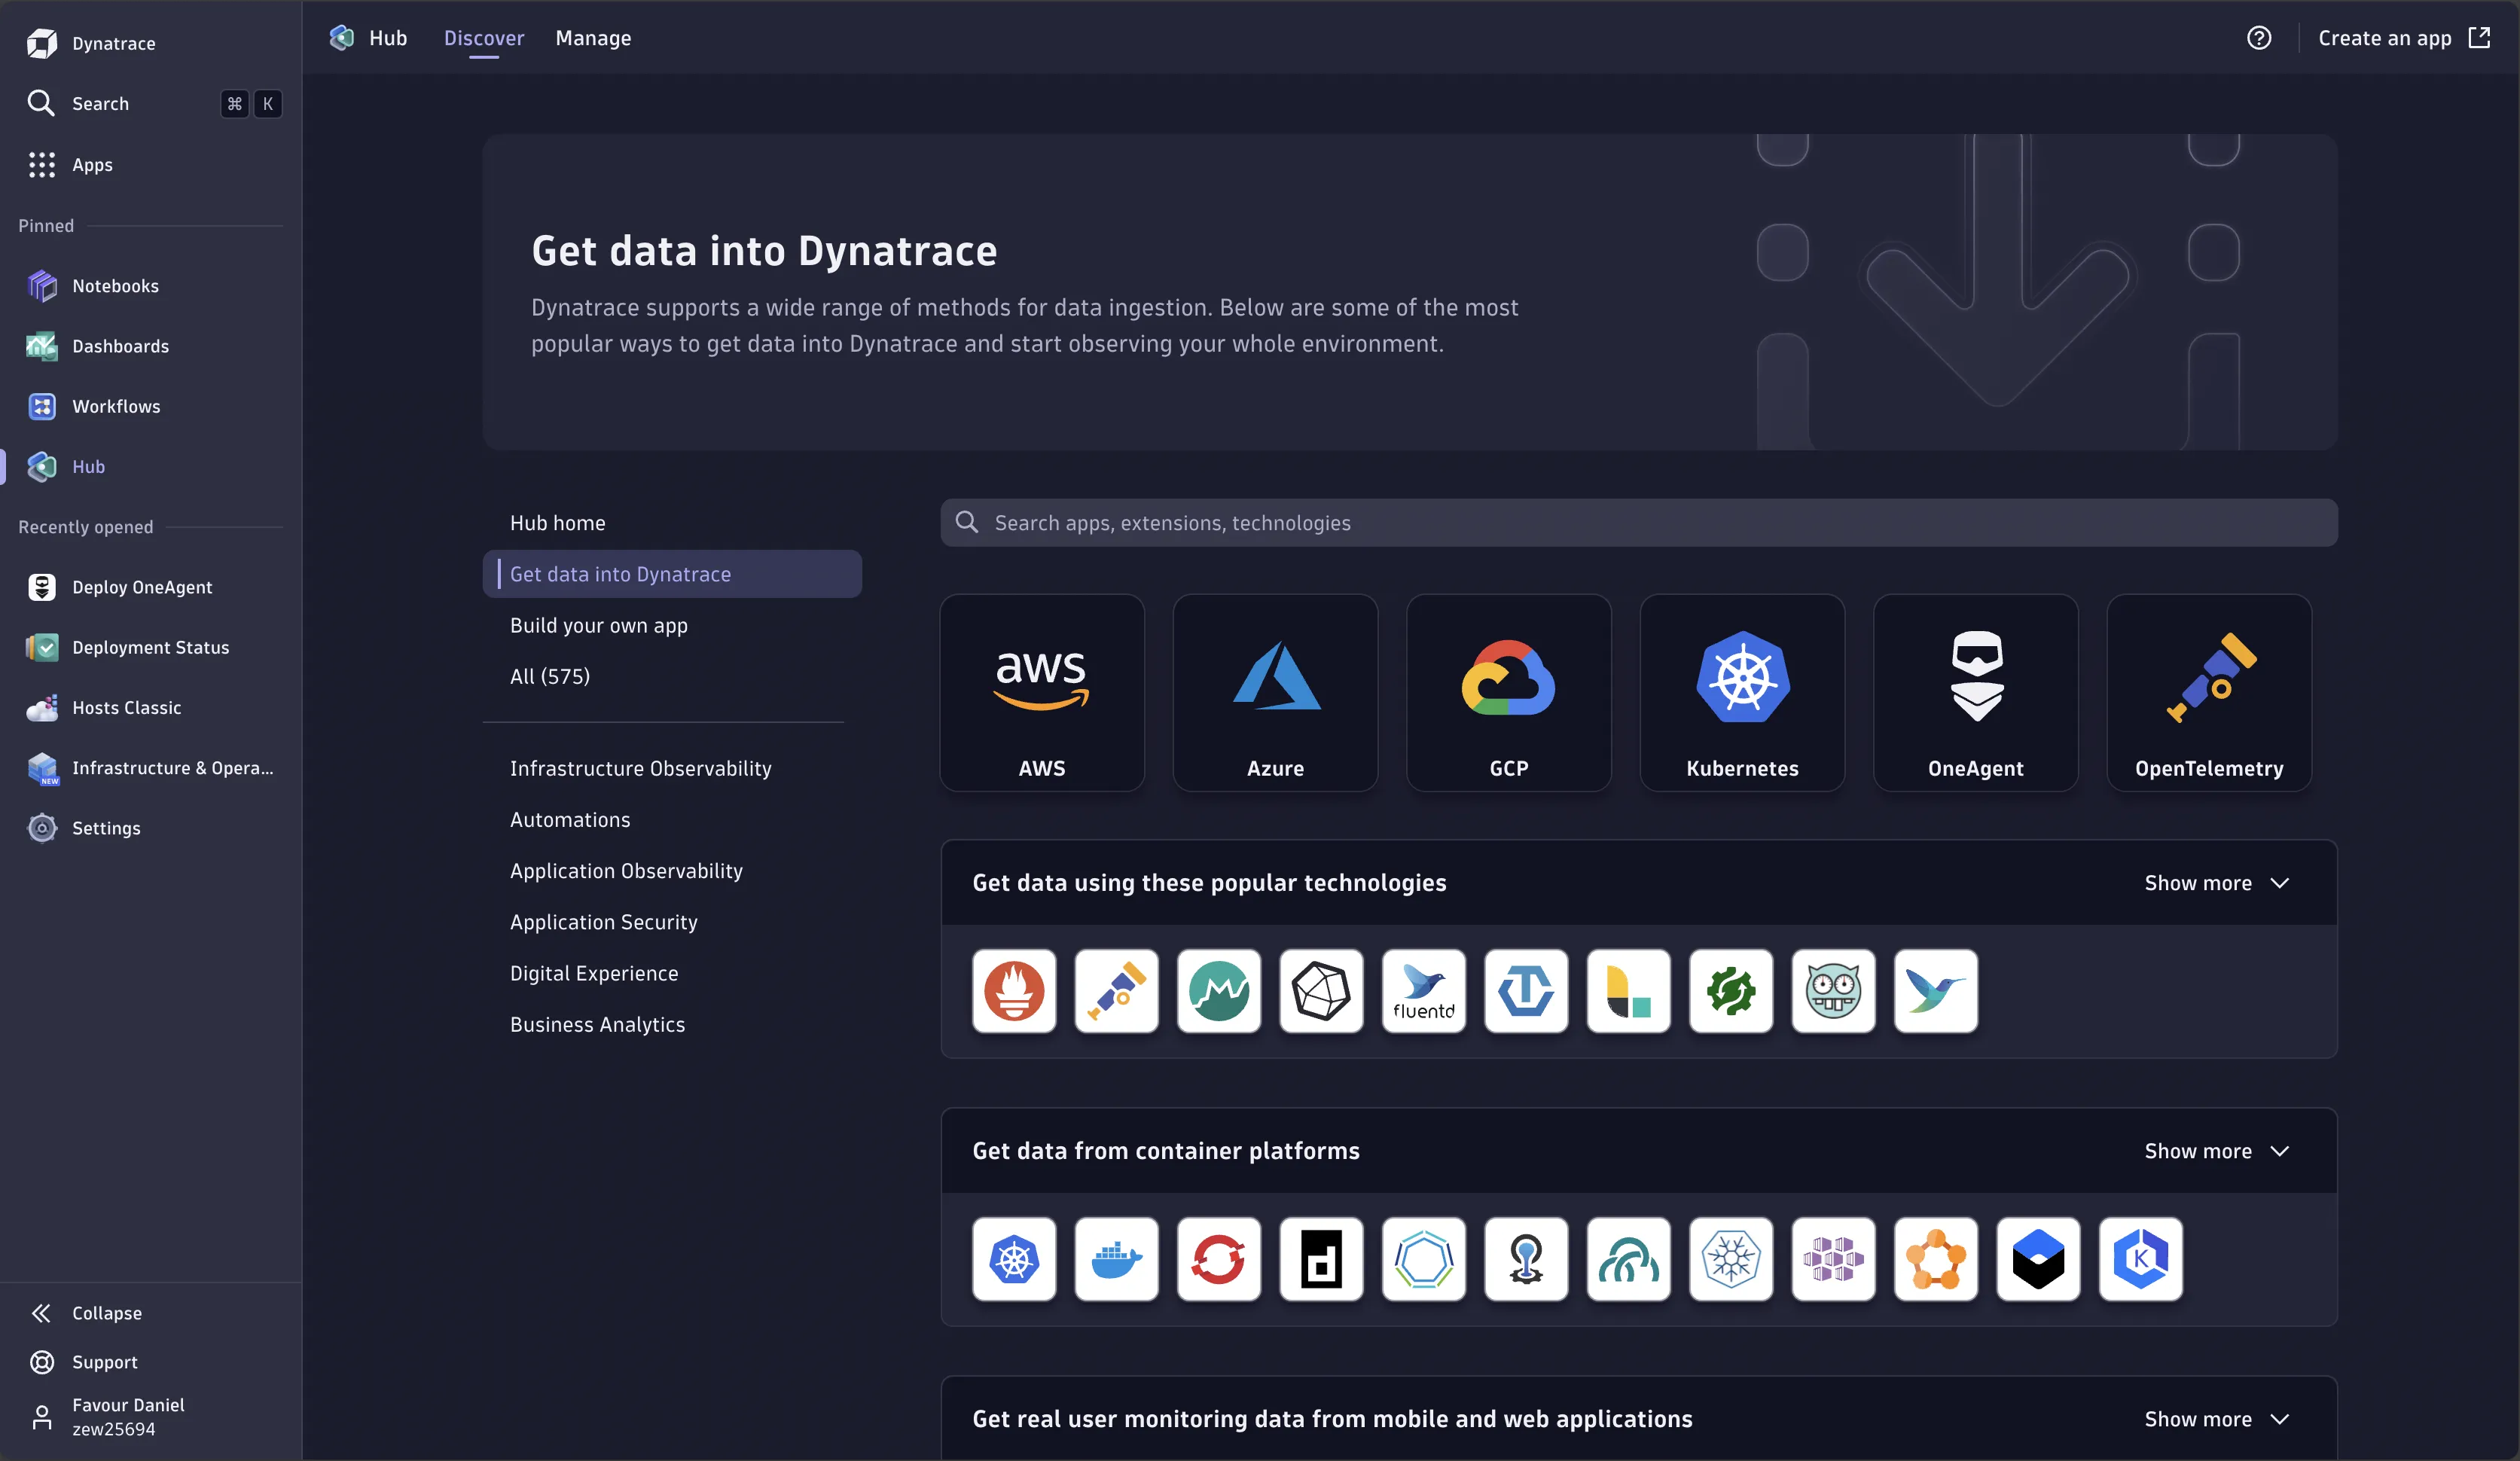
Dynatrace supports a wide range of data sources, encompassing a total of 575 different options for automation, infrastructure observability, and more. It also allows you to build your own custom app. An app in Dynatrace refers to a tailored view or interface within the Dynatrace platform that is specifically optimized for a particular use case or set of needs. This could be focused on monitoring a particular aspect of an application's performance, security, or business analytics.
New Relic
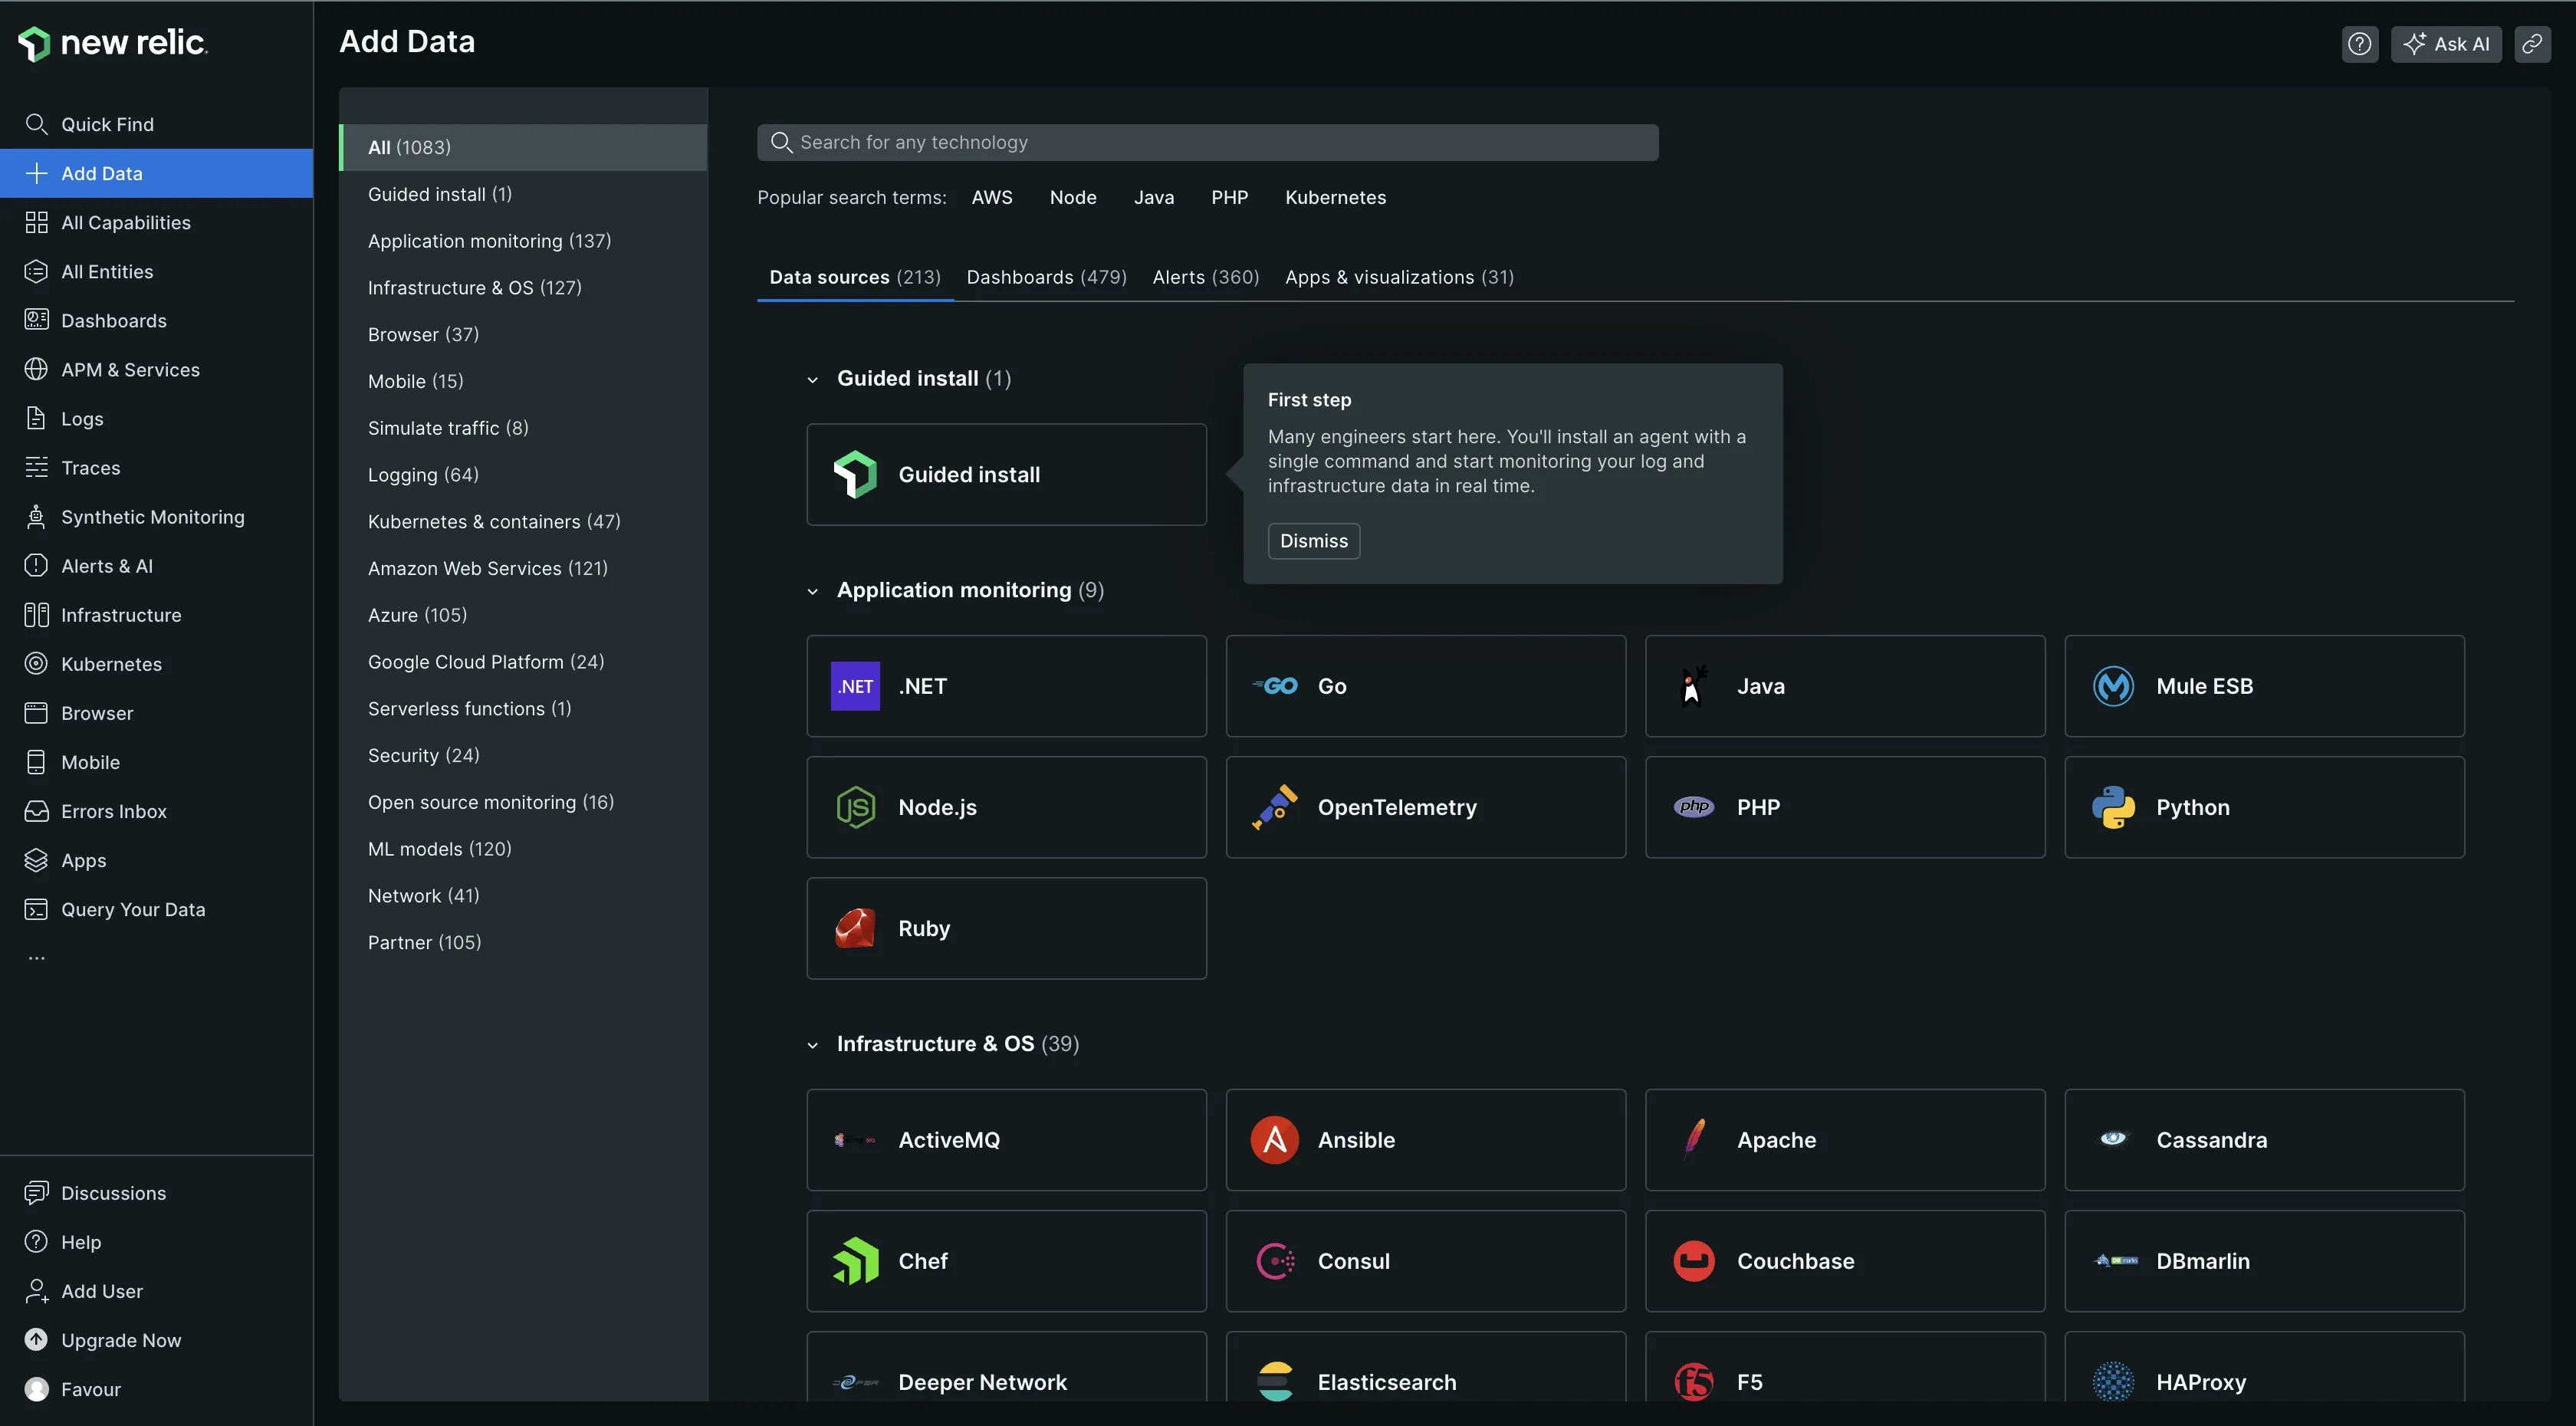
New Relic offers extensive data source options that allow for seamless integration of data into pre-built dashboards. It also comes with pre-configured alert policies that can be easily incorporated into your data management workflow. Additionally, New Relic is known for its user-friendly integration process and clear setup instructions, making it a straightforward choice for data integration tasks.
Compared to Dynatrace, New Relic boasts a wider range of data sources, with a total of 1083 options available, providing users with greater flexibility in tailoring their monitoring and analytics solutions. I also found data integration with New Relic easier.
Migrate from New Relic - Save up to 67% on your New Relic bill
Tired of New Relic's user-based pricing? Even for teams of 10-15 devs, New Relic's pricing for user seats can be a significant portion of your monthly bill.
Data Query: Both tools
Dynatrace
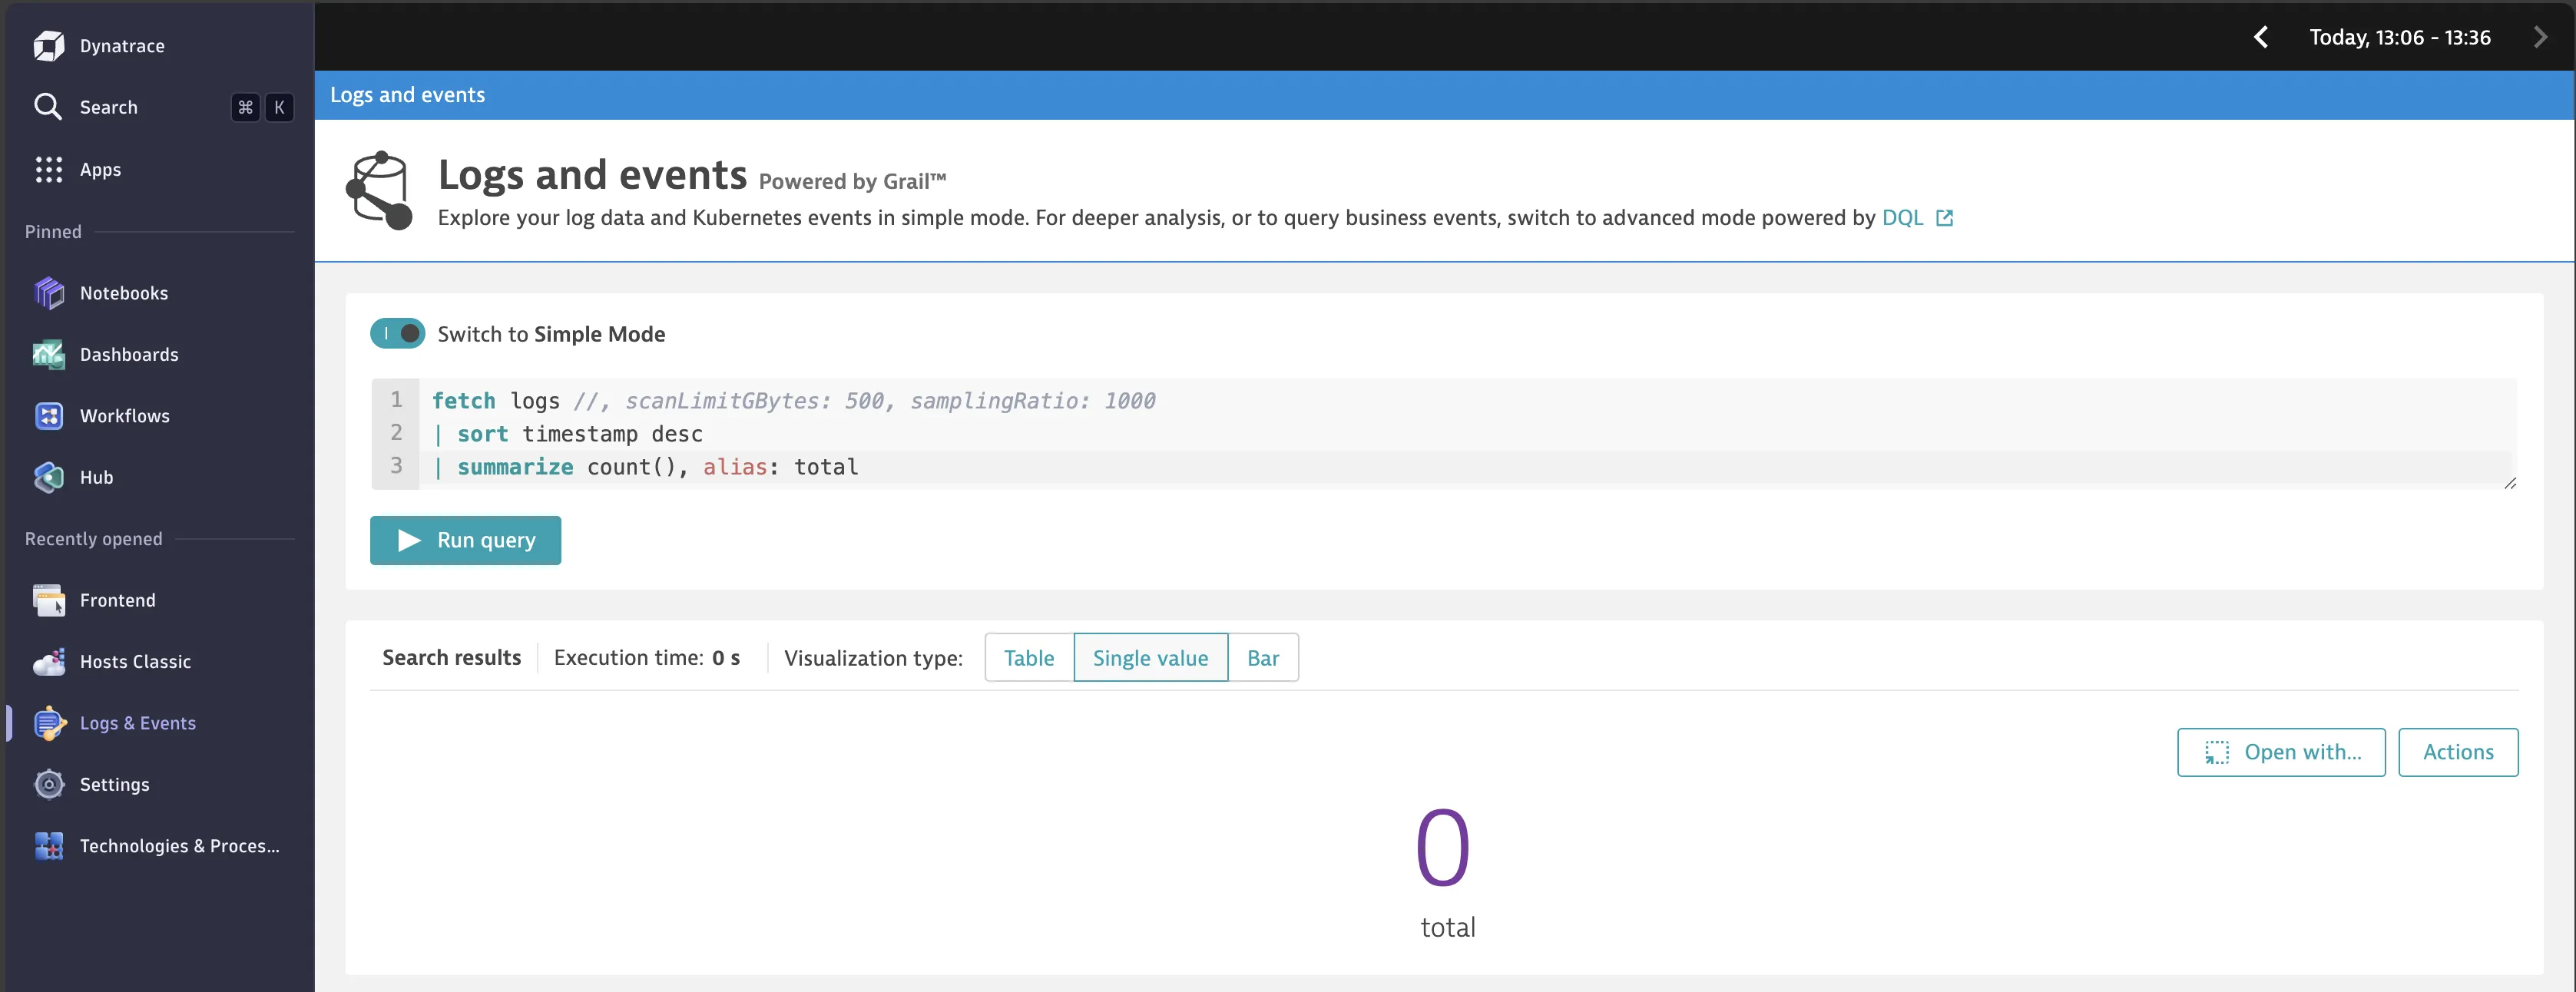
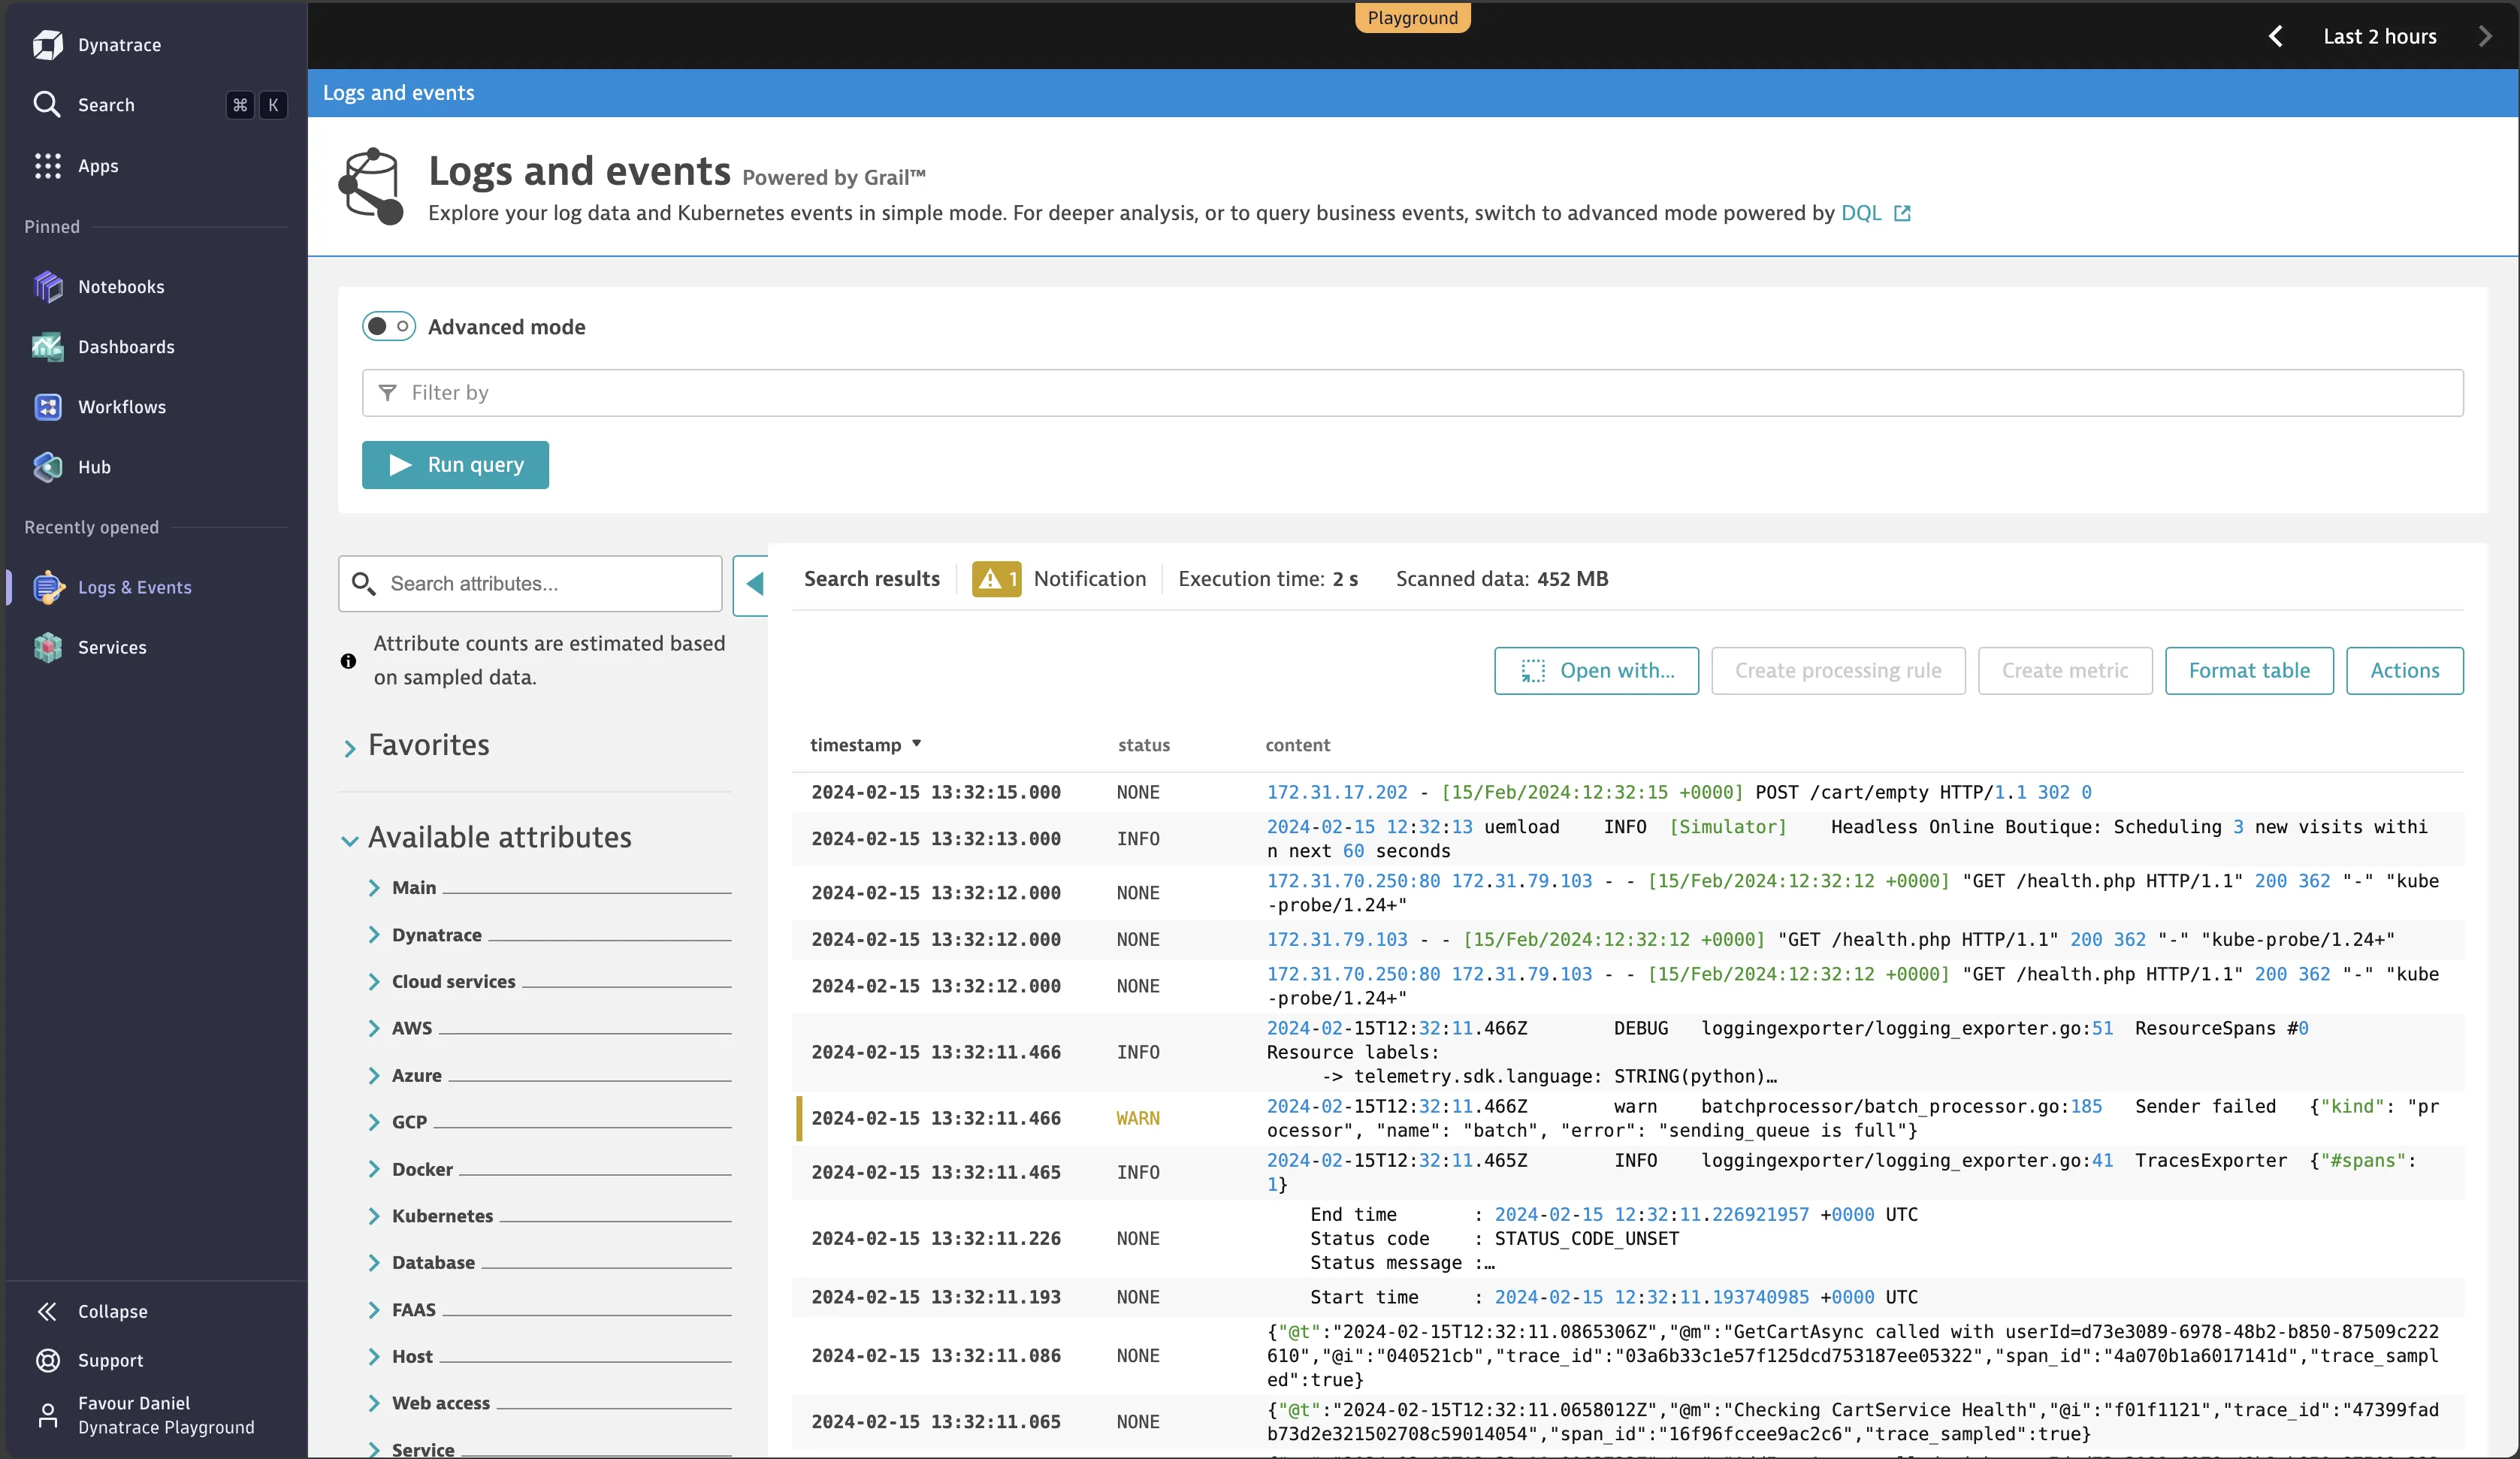
Dynatrace uses DQL (Dynatrace Query Language) for querying data. DQL is used for the exploration, querying, and processing of all data stored in Grail, Dynatrace’s data warehouse. Unlike traditional SQL, which requires a predefined schema, DQL is built to handle arbitrary event data, making it particularly suitable for exploring observability data where the schema may vary or evolve.
New Relic
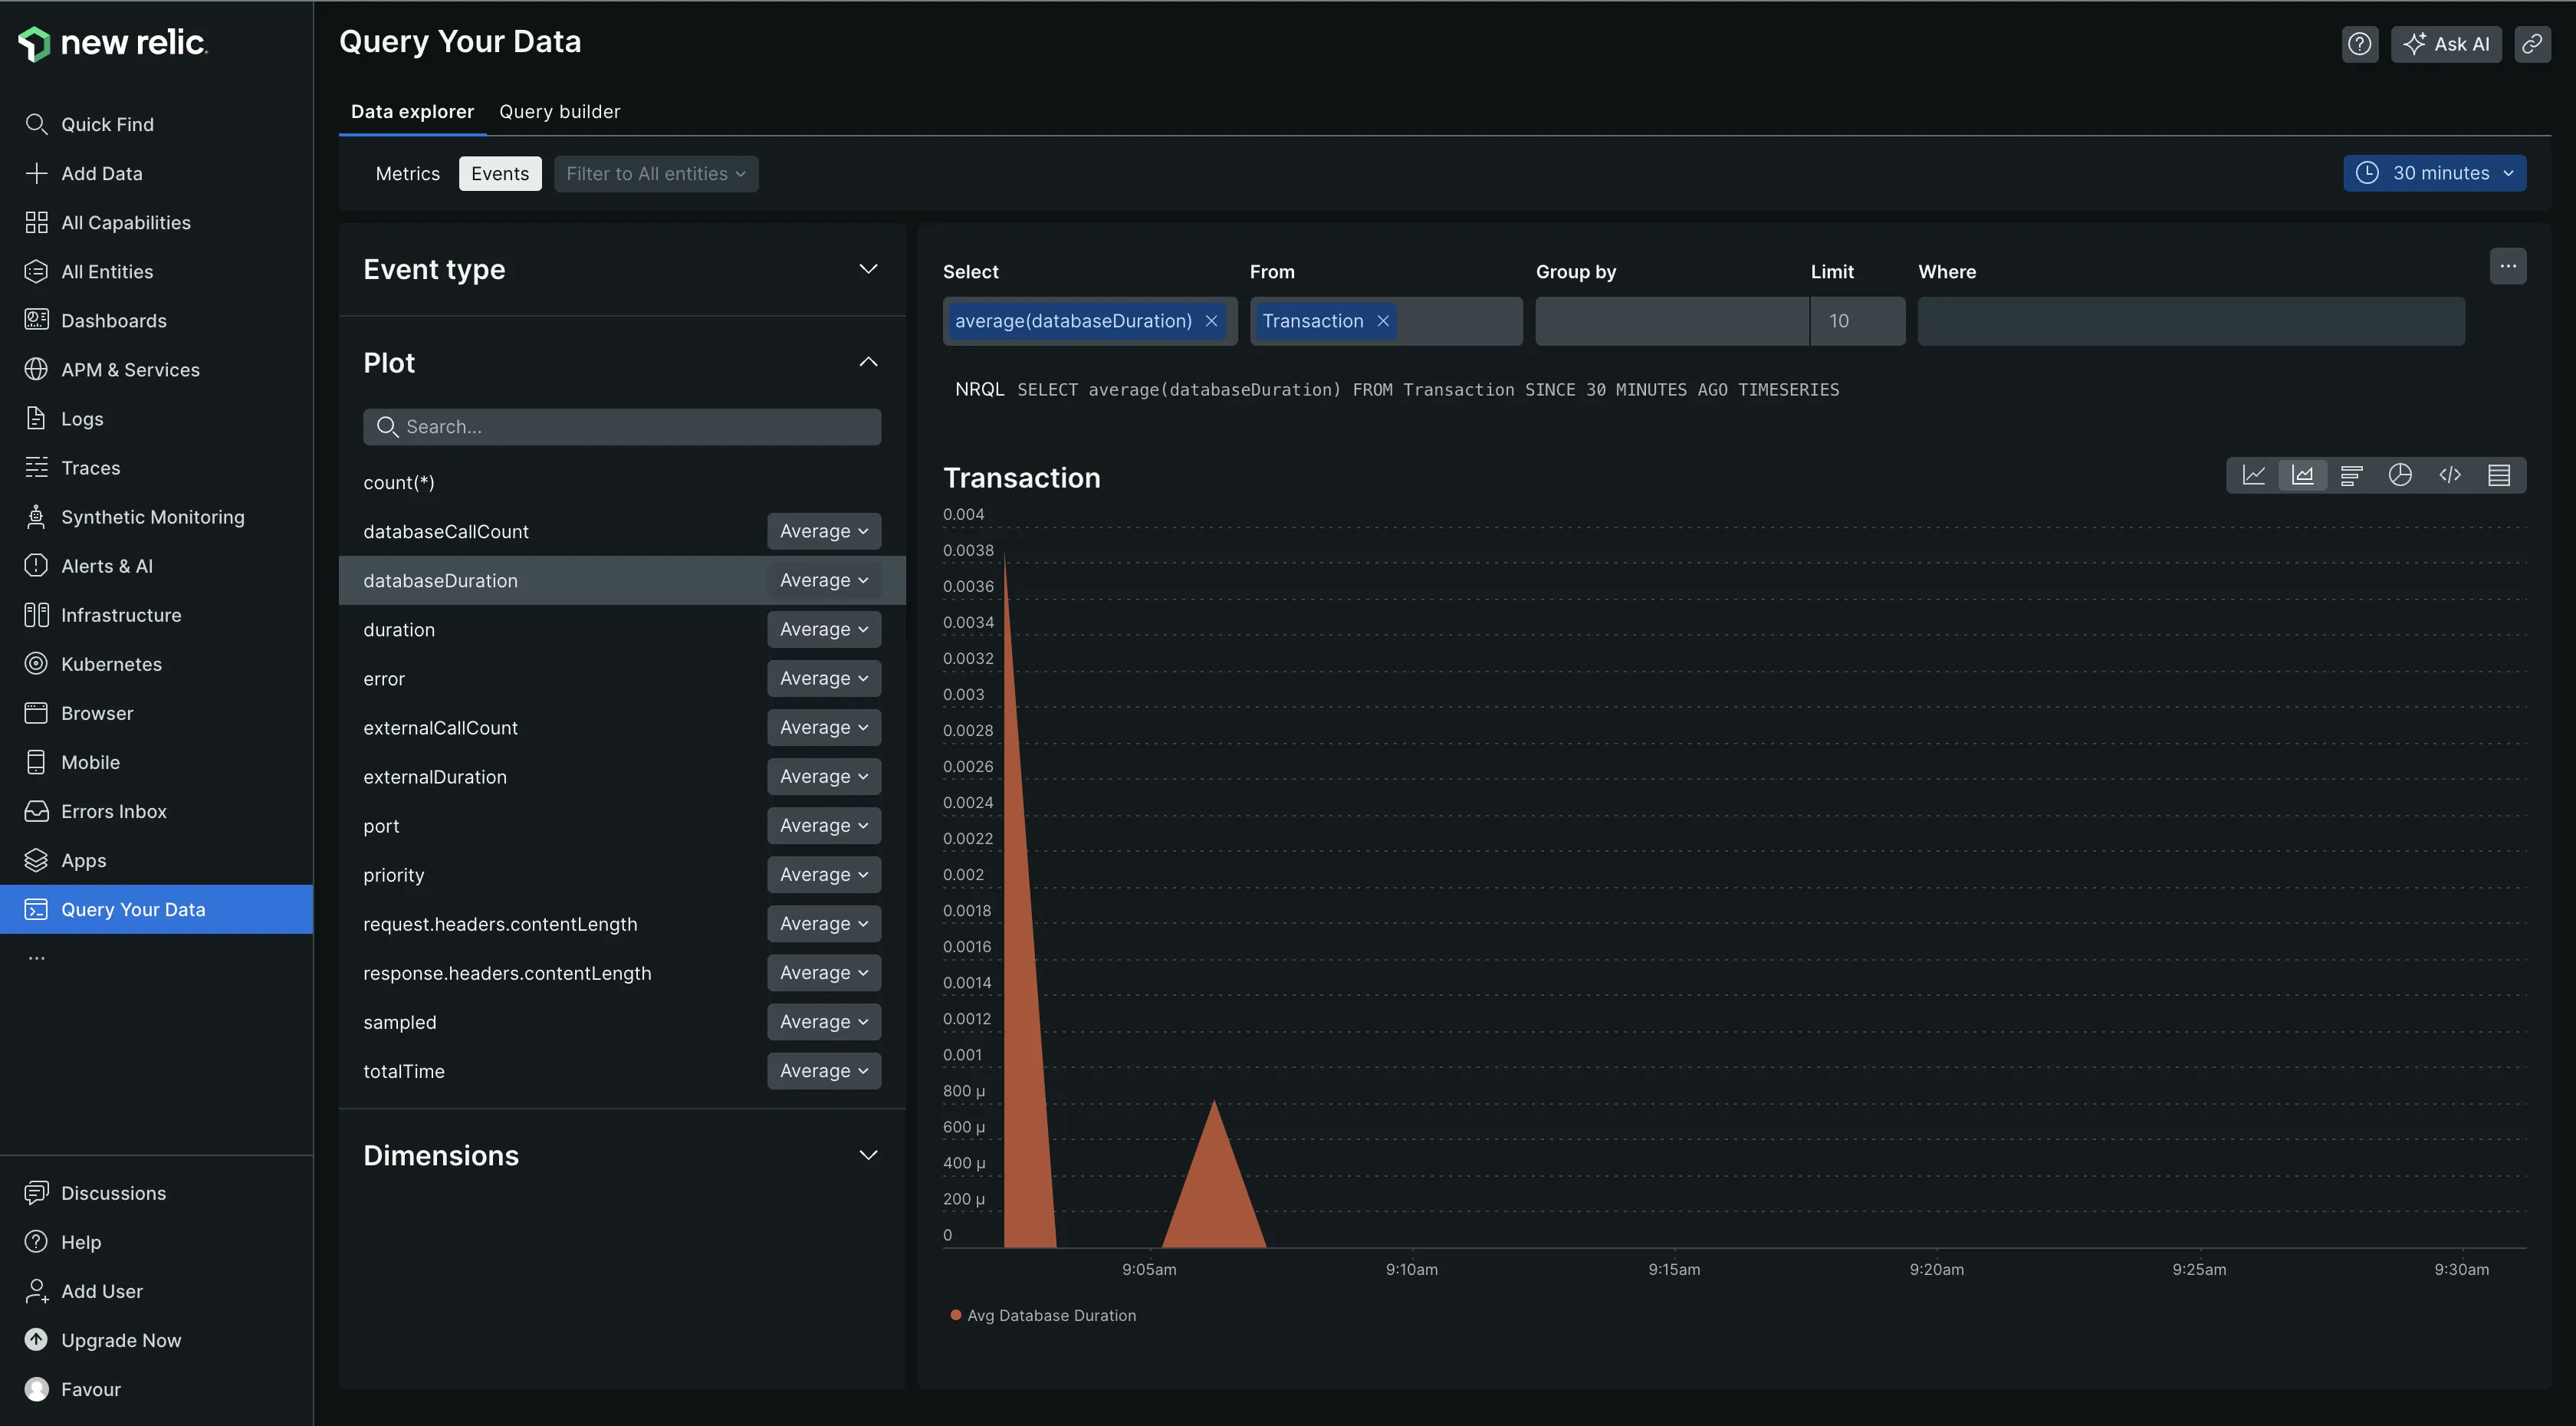
New Relic has data explorer and query builder tabs. The Data Explorer tab allows users to browse their data without writing queries, while the Query Builder tab allows users to create custom queries to get more insights from their existing data.
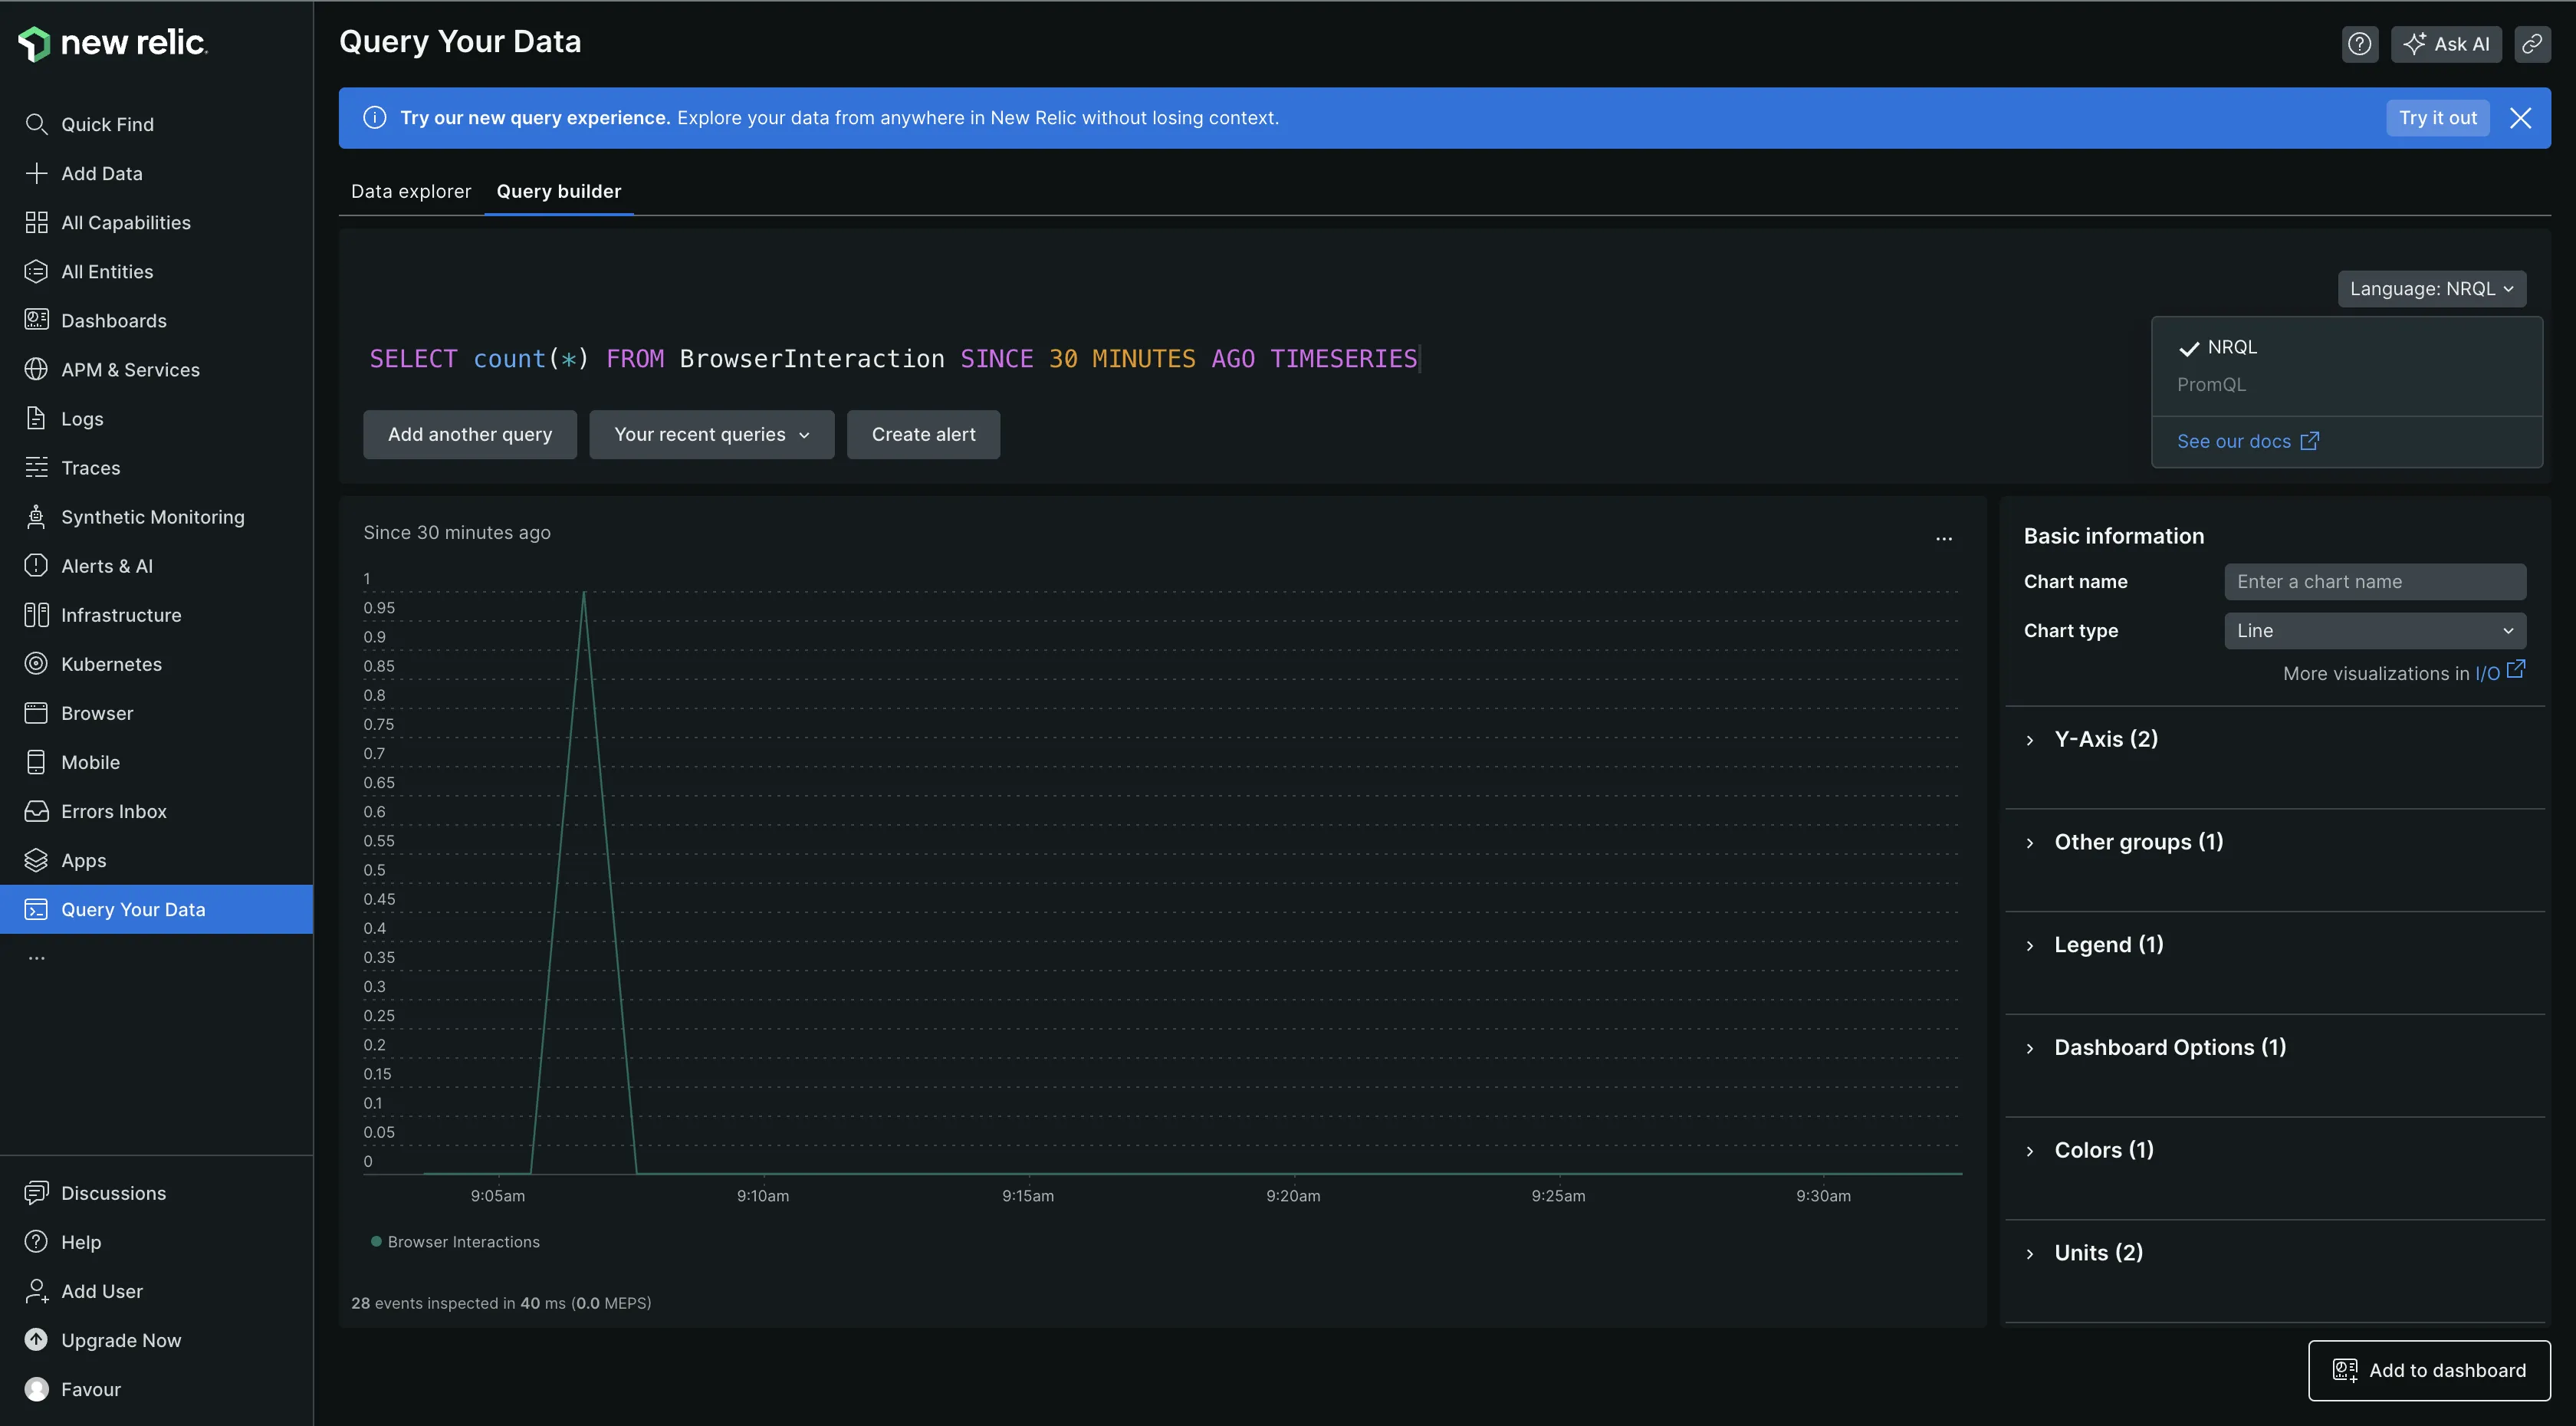
You have the option of querying your data using NRQL (New Relic Query Language) or PromQL. NRQL is a query language used to retrieve and analyze data from the New Relic Database (NRDB). It is similar to ANSI SQL and is designed to provide insights into applications, hosts, and business-critical activities by allowing users to create charts, set up alerts, and make API queries of New Relic data.
Overall, both tools have good data querying capabilities.
Infrastructure Monitoring: Dynatrace
Dynatrace
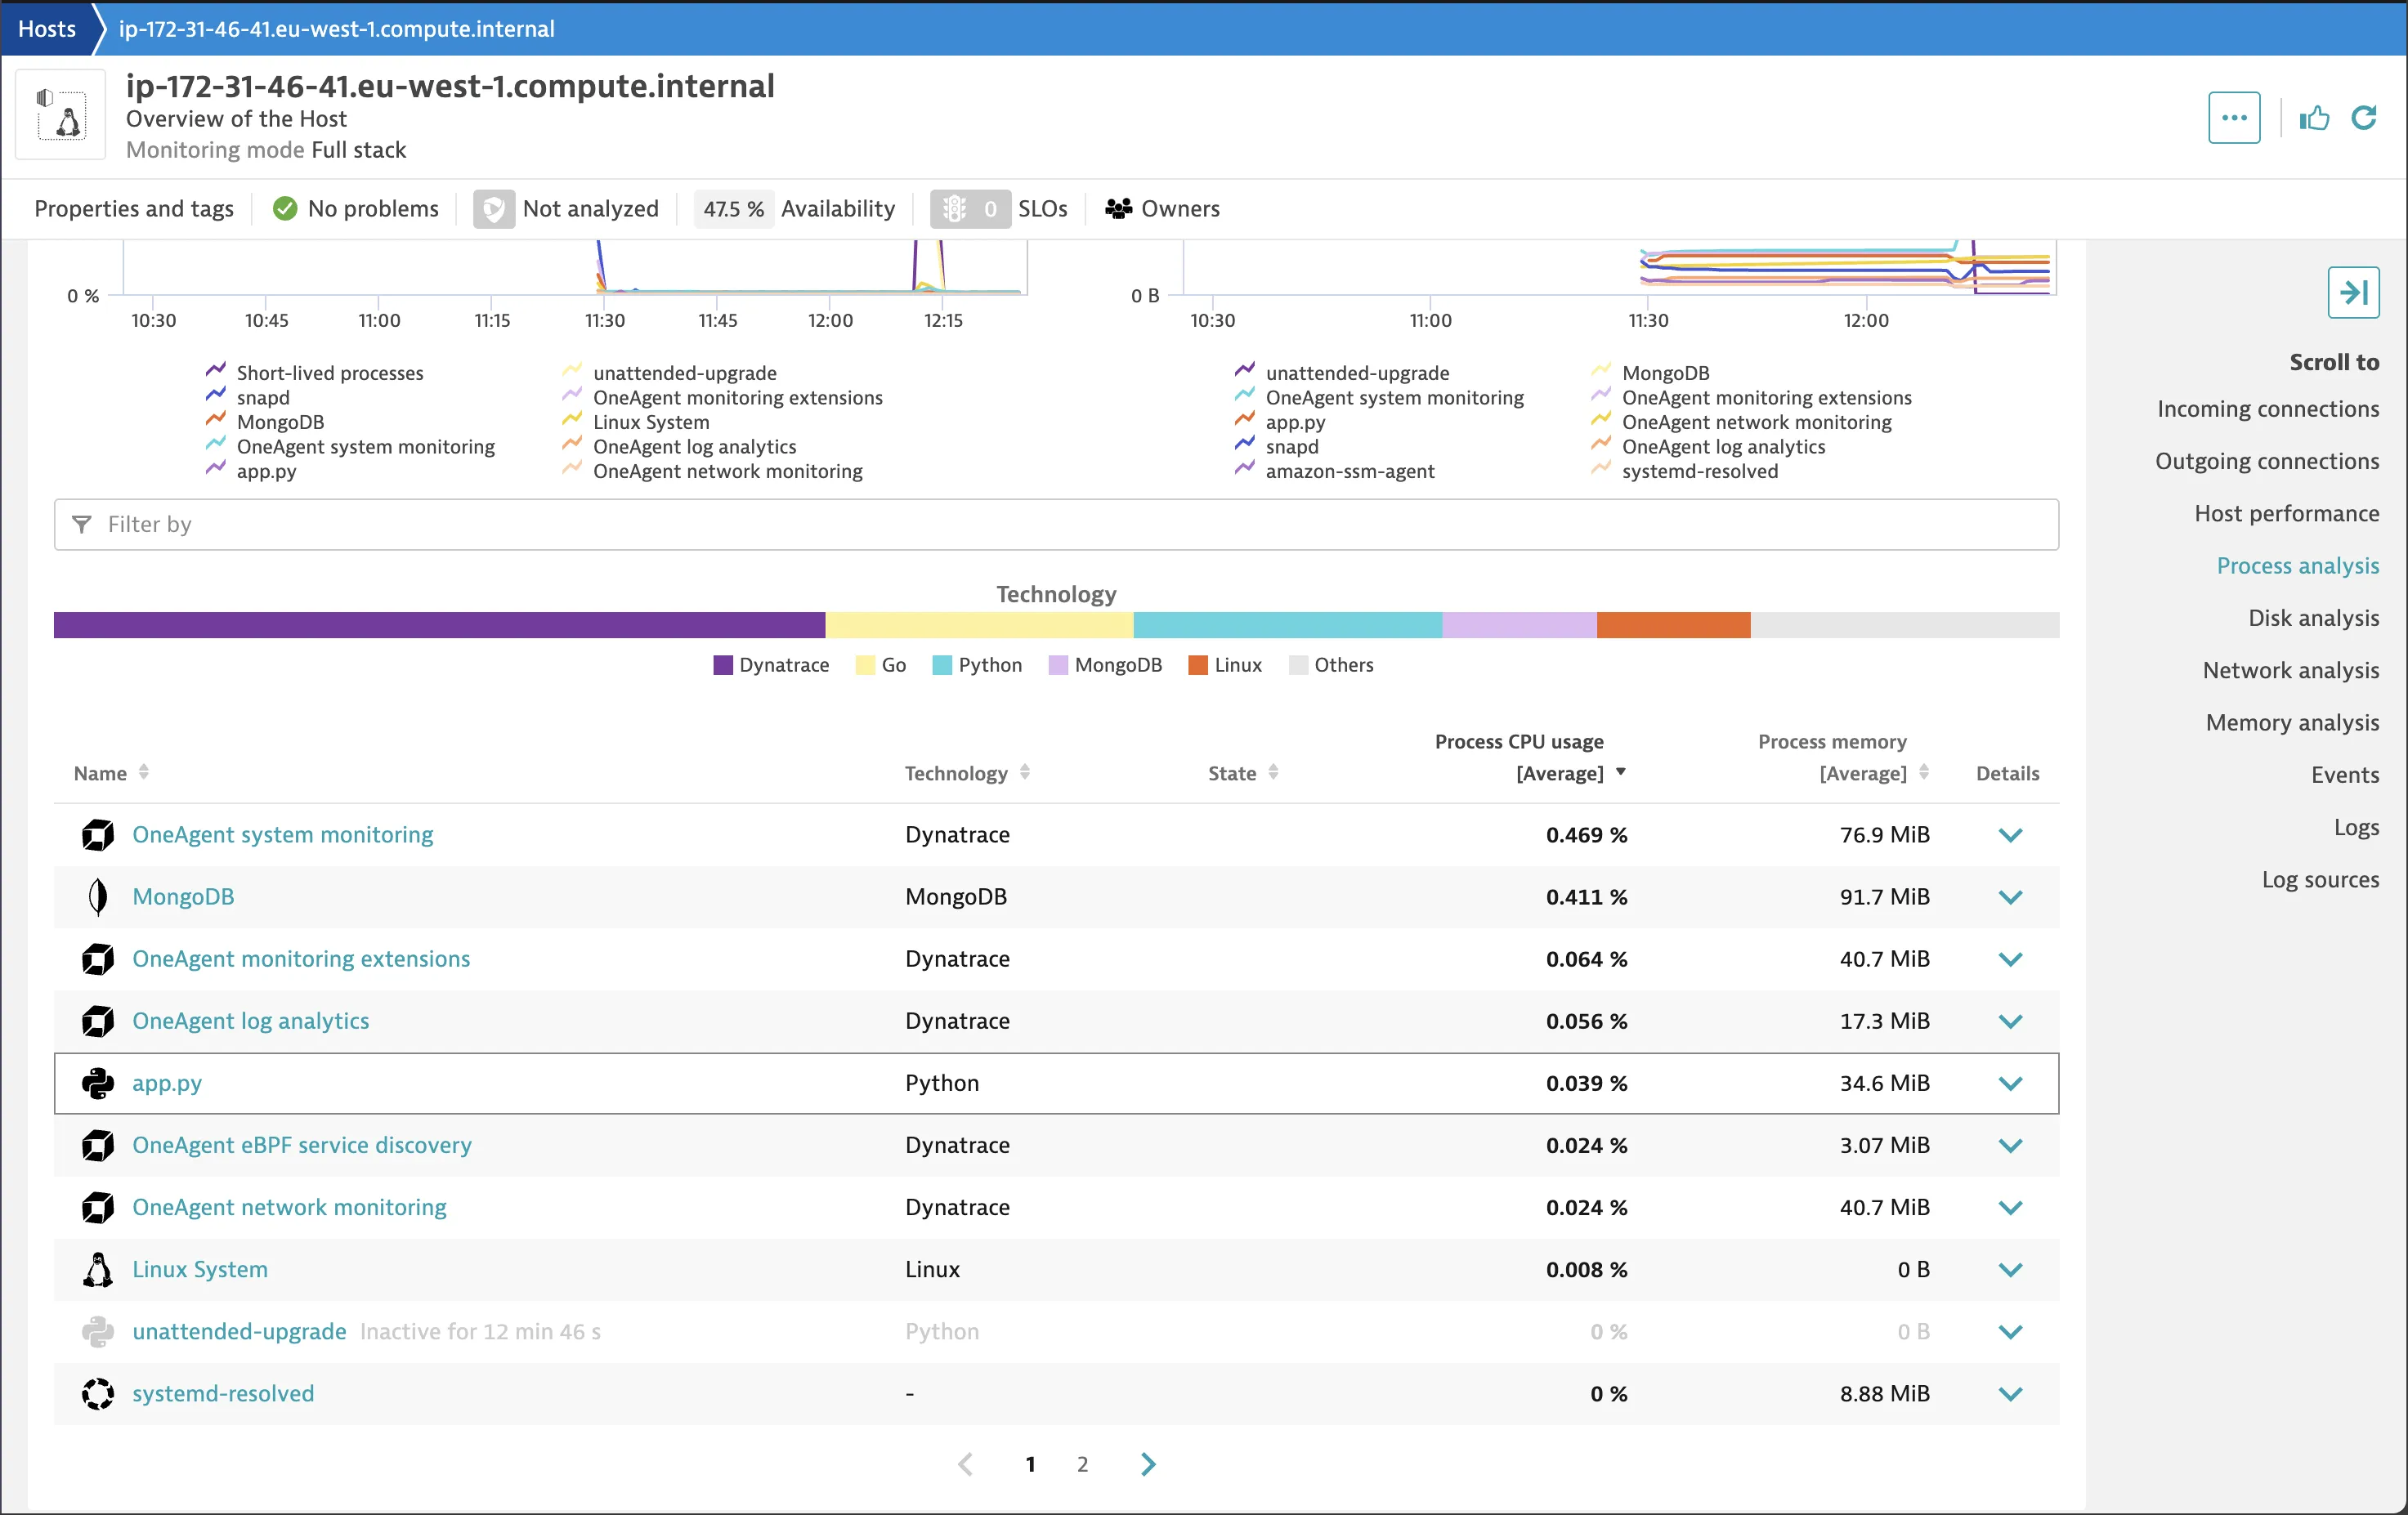
I had to install One Agent on my host machine to monitor my infrastructure. One Agent is what Dynatrace uses for conducting full-stack monitoring of your infrastructure and the services operating within it. It gave me a holistic view of my infrastructure performance, including incoming and outgoing connections, host performance, process analysis, disk usage, and more. The only drawback was not being able to set it up on macOS, as it doesn’t support it. I had to install it on a Ubuntu VM instead.
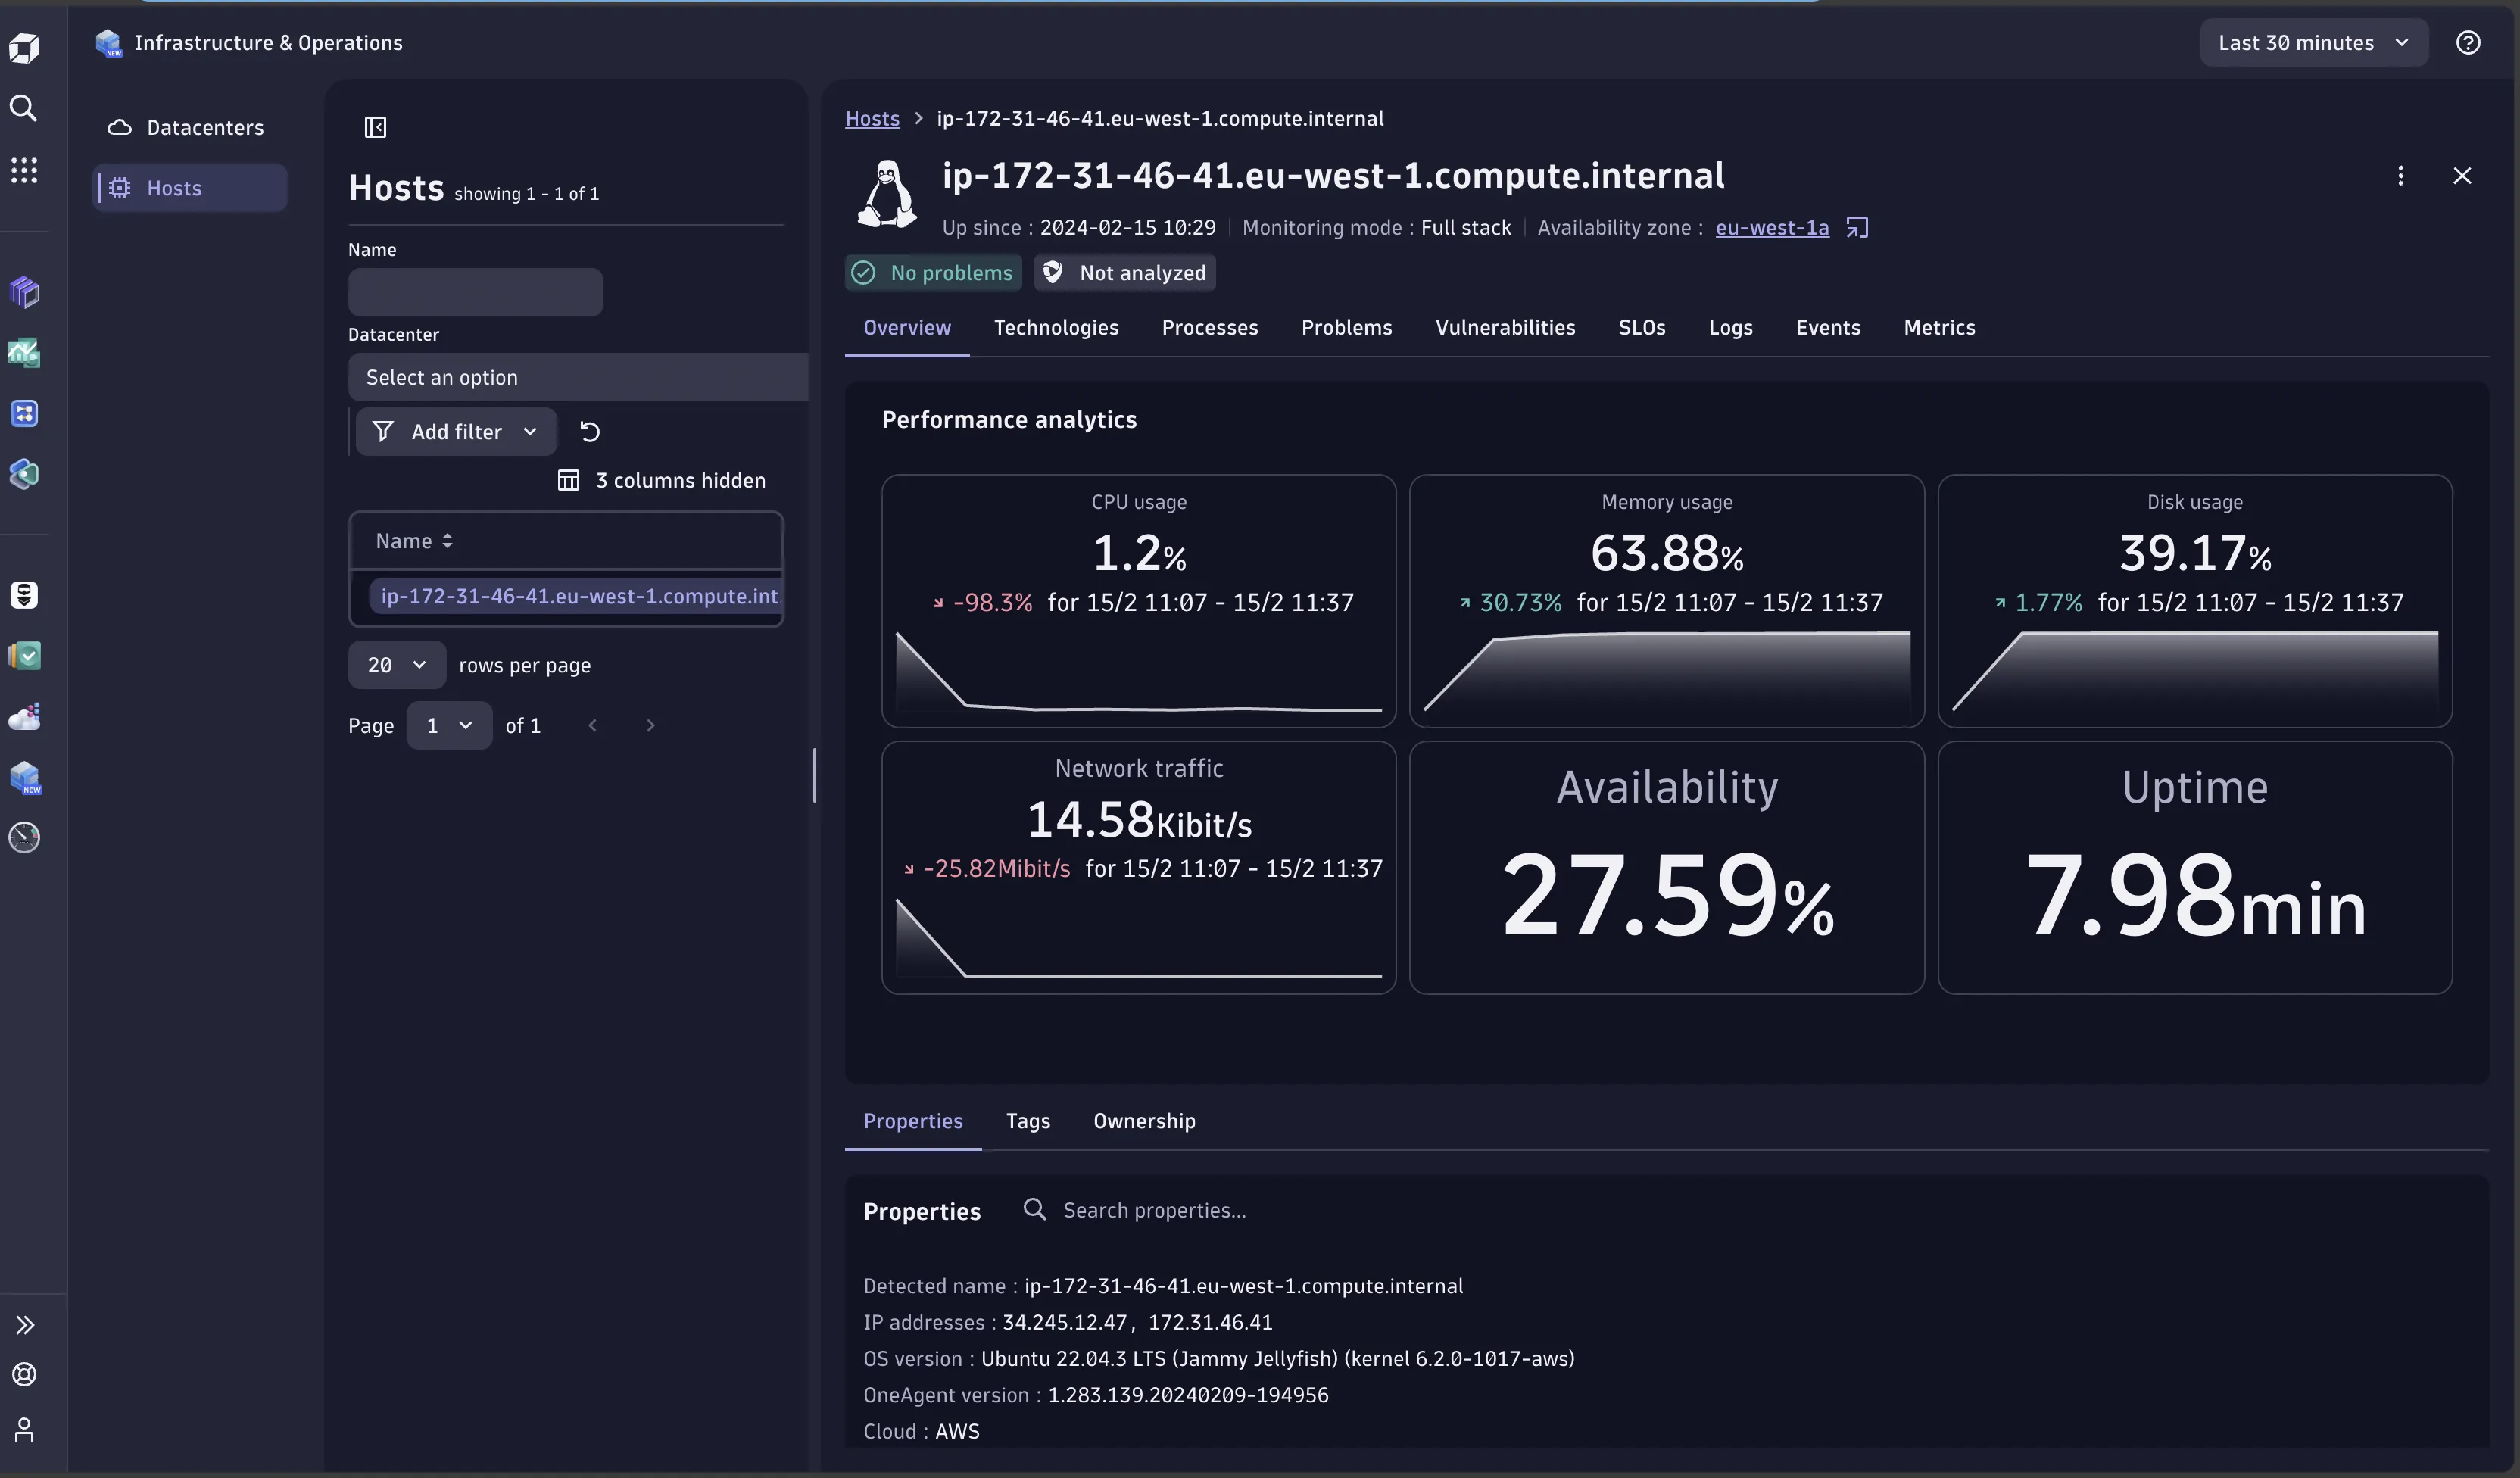
The Process Analysis section provided me with information on all the running processes on my infrastructure, along with vital stats on memory and CPU usage. This level of detail is useful for keeping tabs on my system's performance and making informed decisions about resource allocation and optimization.
New Relic
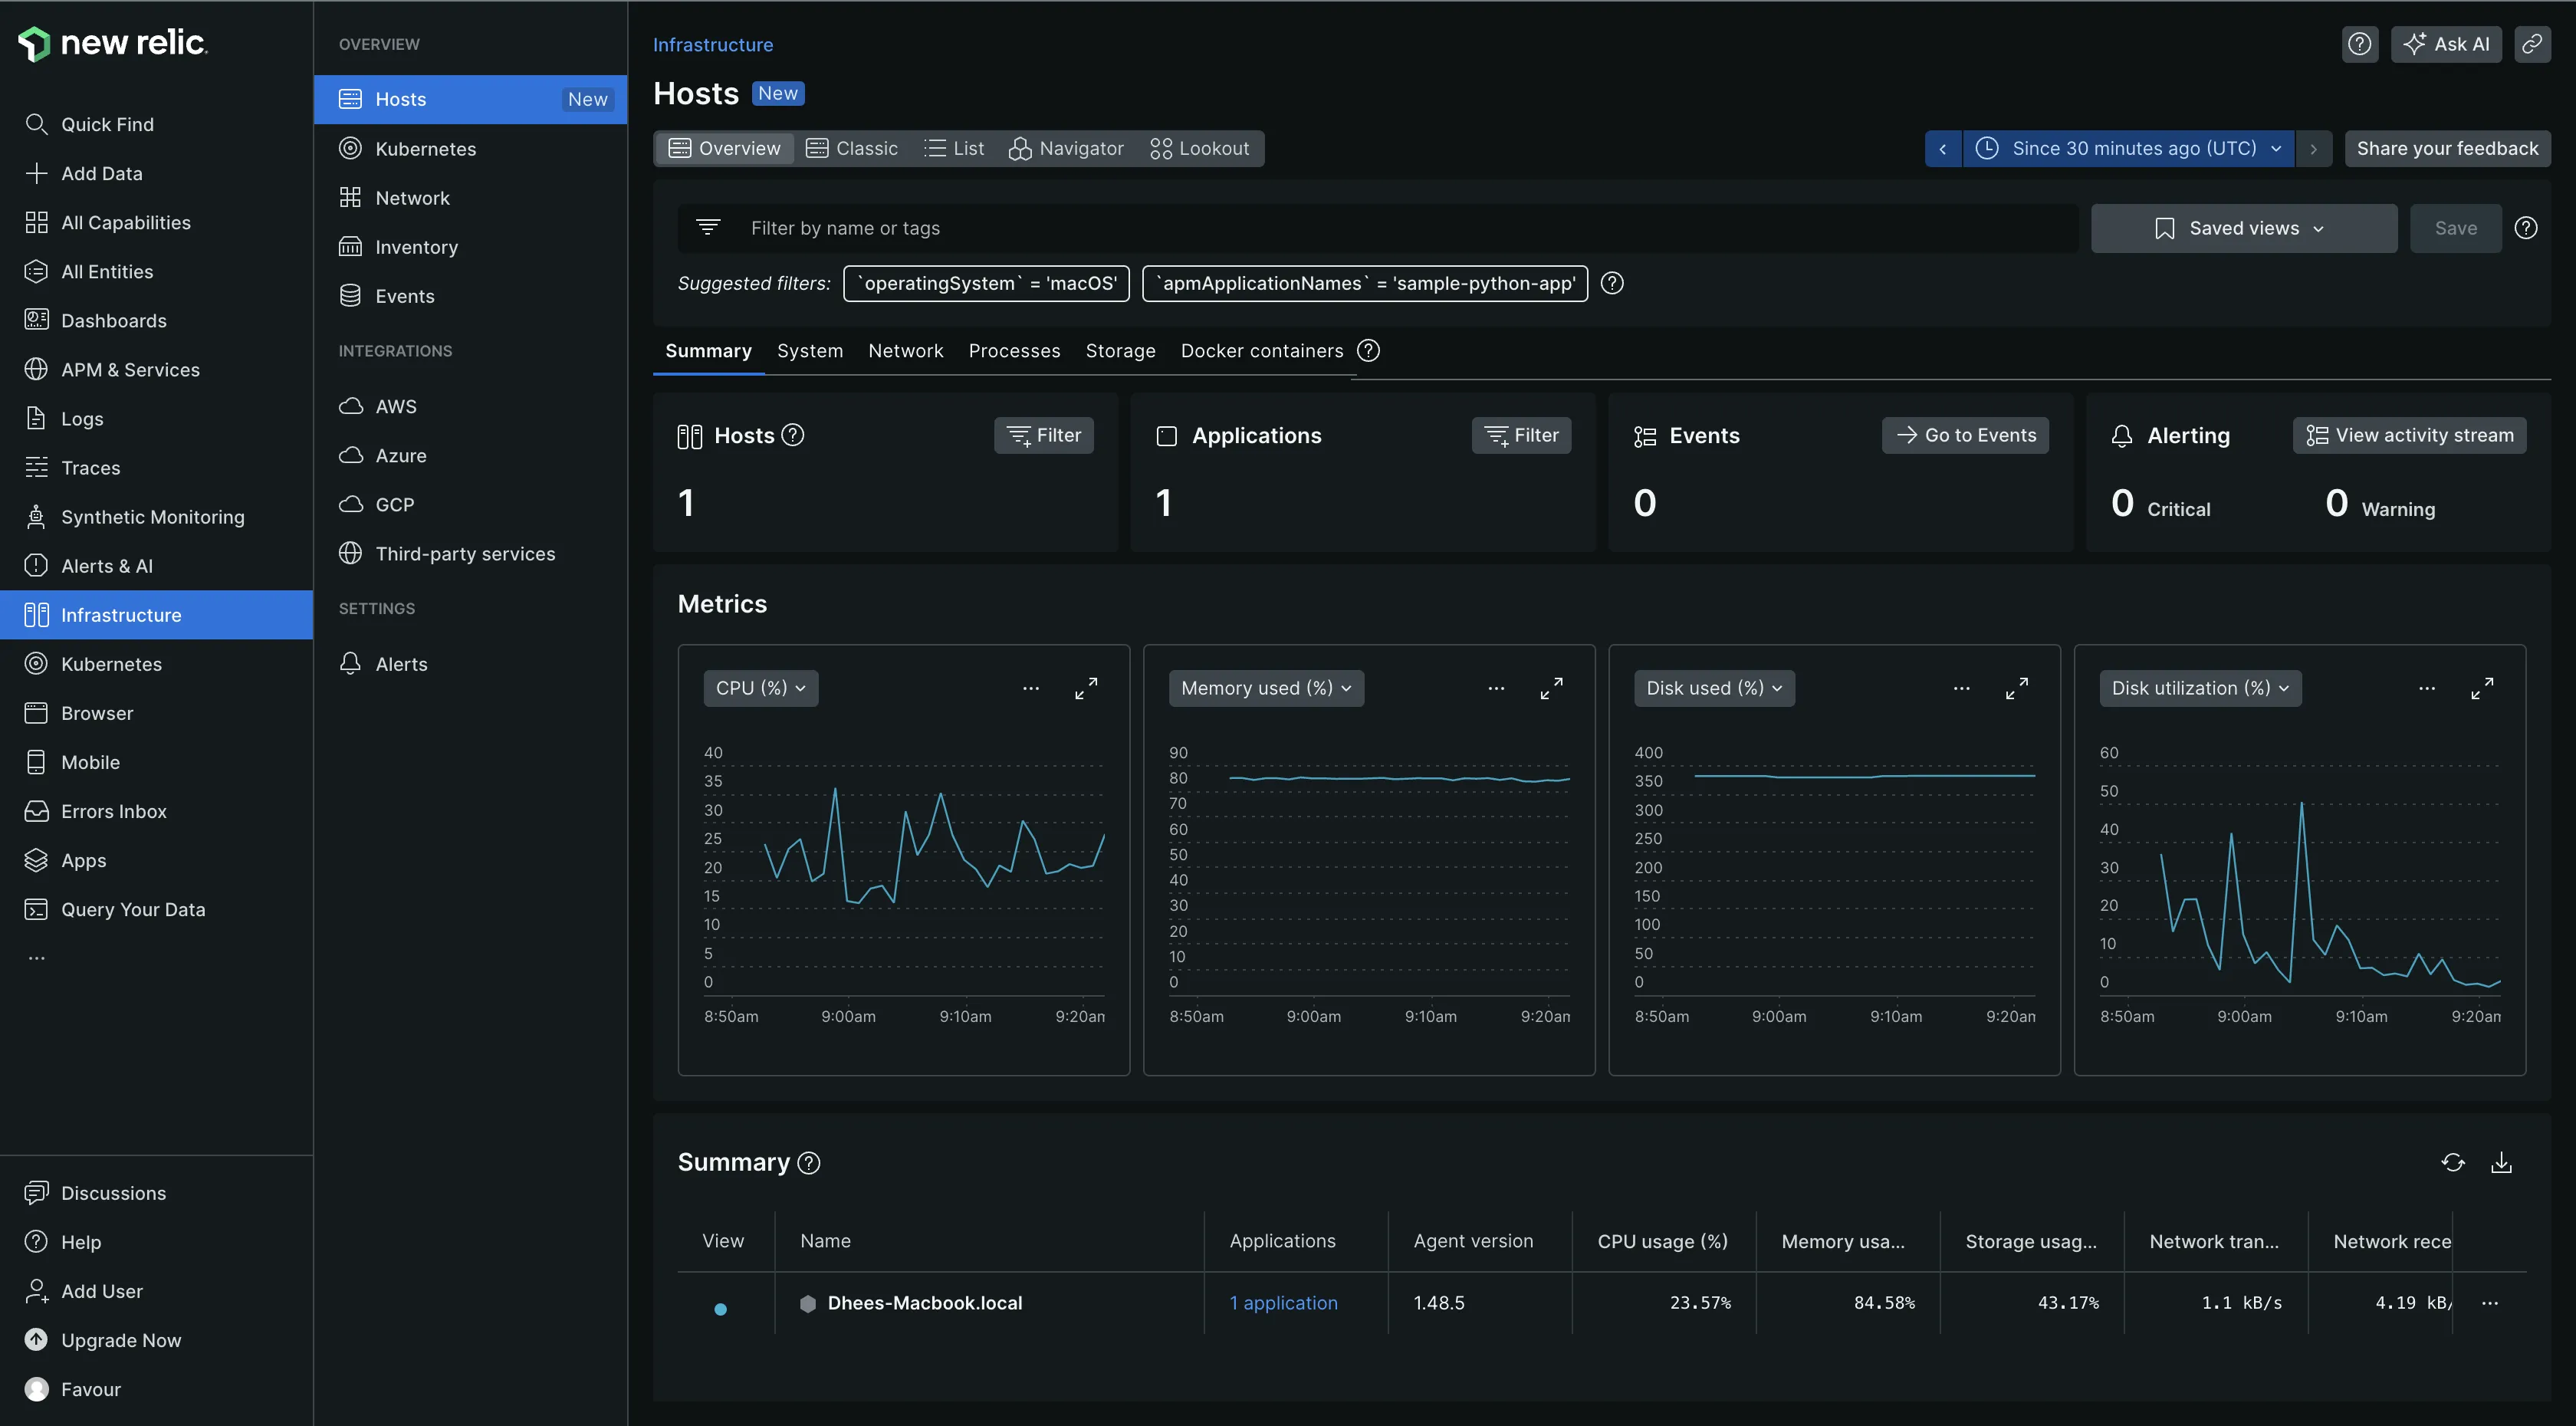
New Relic facilitates the monitoring of a variety of infrastructure components through the deployment of an infrastructure agent. Upon installation on a macOS host, which is supported by New Relic, the agent automatically collects and sends data to the New Relic platform. It collects data on the infrastructure and the services running on it.
While New Relic provides a solid foundation for monitoring infrastructure and services, I found that Dynatrace offered a broader array of capabilities and a deeper level of insight into my infrastructure. Dynatrace's comprehensive features provide a more detailed analysis of the system's performance.
If your goal is to gain a comprehensive understanding of all activities occurring within your infrastructure, Dynatrace stands out as a robust solution.
APM: New Relic
Dynatrace
I had a hard time understanding the APM setup for Dynatrace because APM is not immediately visible as an option within the user interface. I found in the Dynatrace docs that you can instrument your application with OpenTelemetry or utilize the One Agent SDK, which complements the Dynatrace One Agent. The latter approach necessitates modifications to the application code, which may not be ideal for everyone.
New Relic
New Relic has an APM & Services section, which is easy to locate. Monitoring an application requires adding that application as a data source and installing the agent for the application on your host machine. For example, a Python application requires a Python agent. Once your application is started with the agent, New Relic automatically collects your application data for monitoring. The process is very seamless.
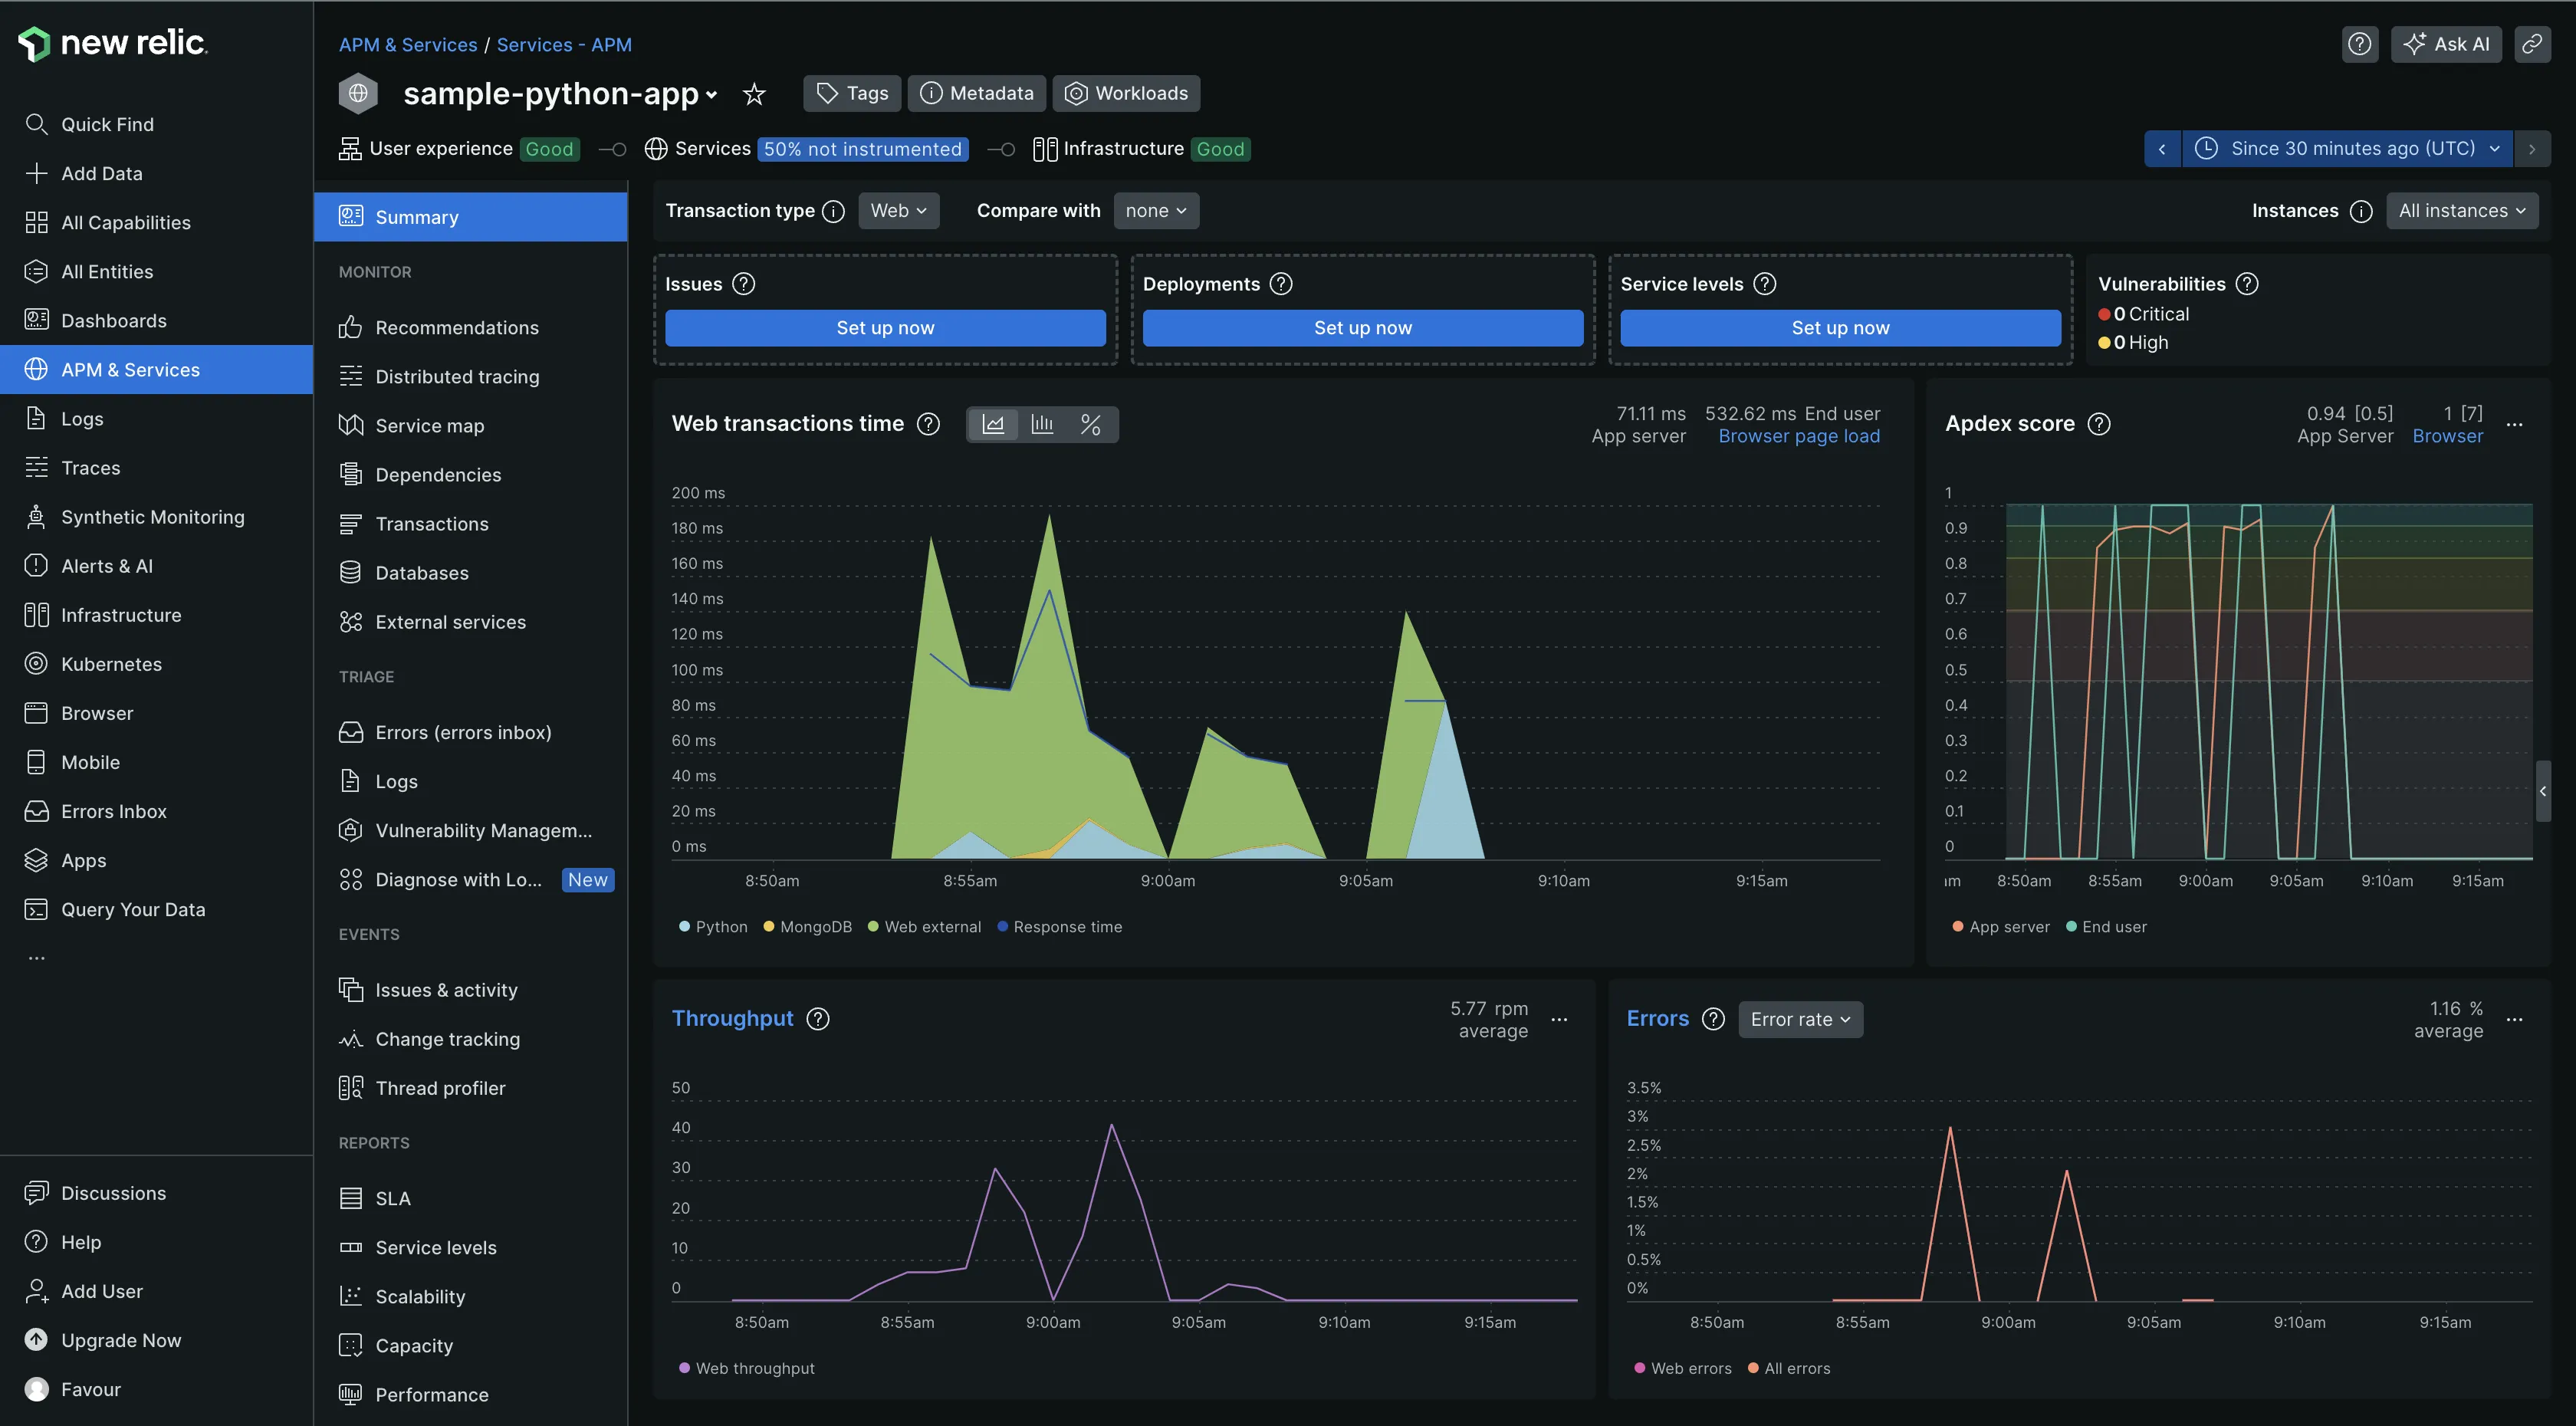
In the case of APM, a direct comparison between Dynatrace and New Relic is challenging due to the limited amount of information obtained from Dynatrace for comparison purposes. However, considering the ease of setup and simplicity of New Relic, it is the better option when it comes to APM.
Log Management: Dynatrace
Dynatrace
Log management in Dynatrace is powered by Grail, which is designed to manage log data efficiently without requiring schemas or indexing and allows users to store petabytes of data that can be queried at any time. Once the OneAgent is deployed on a host, it seamlessly ingests log data into the Dynatrace platform.
Users can define custom log ingestion rules with OneAgent and control the retention of log data by placing it into designated data retention buckets. This flexibility allows for retention periods that align with business and compliance requirements, whether for debugging or auditing purposes.
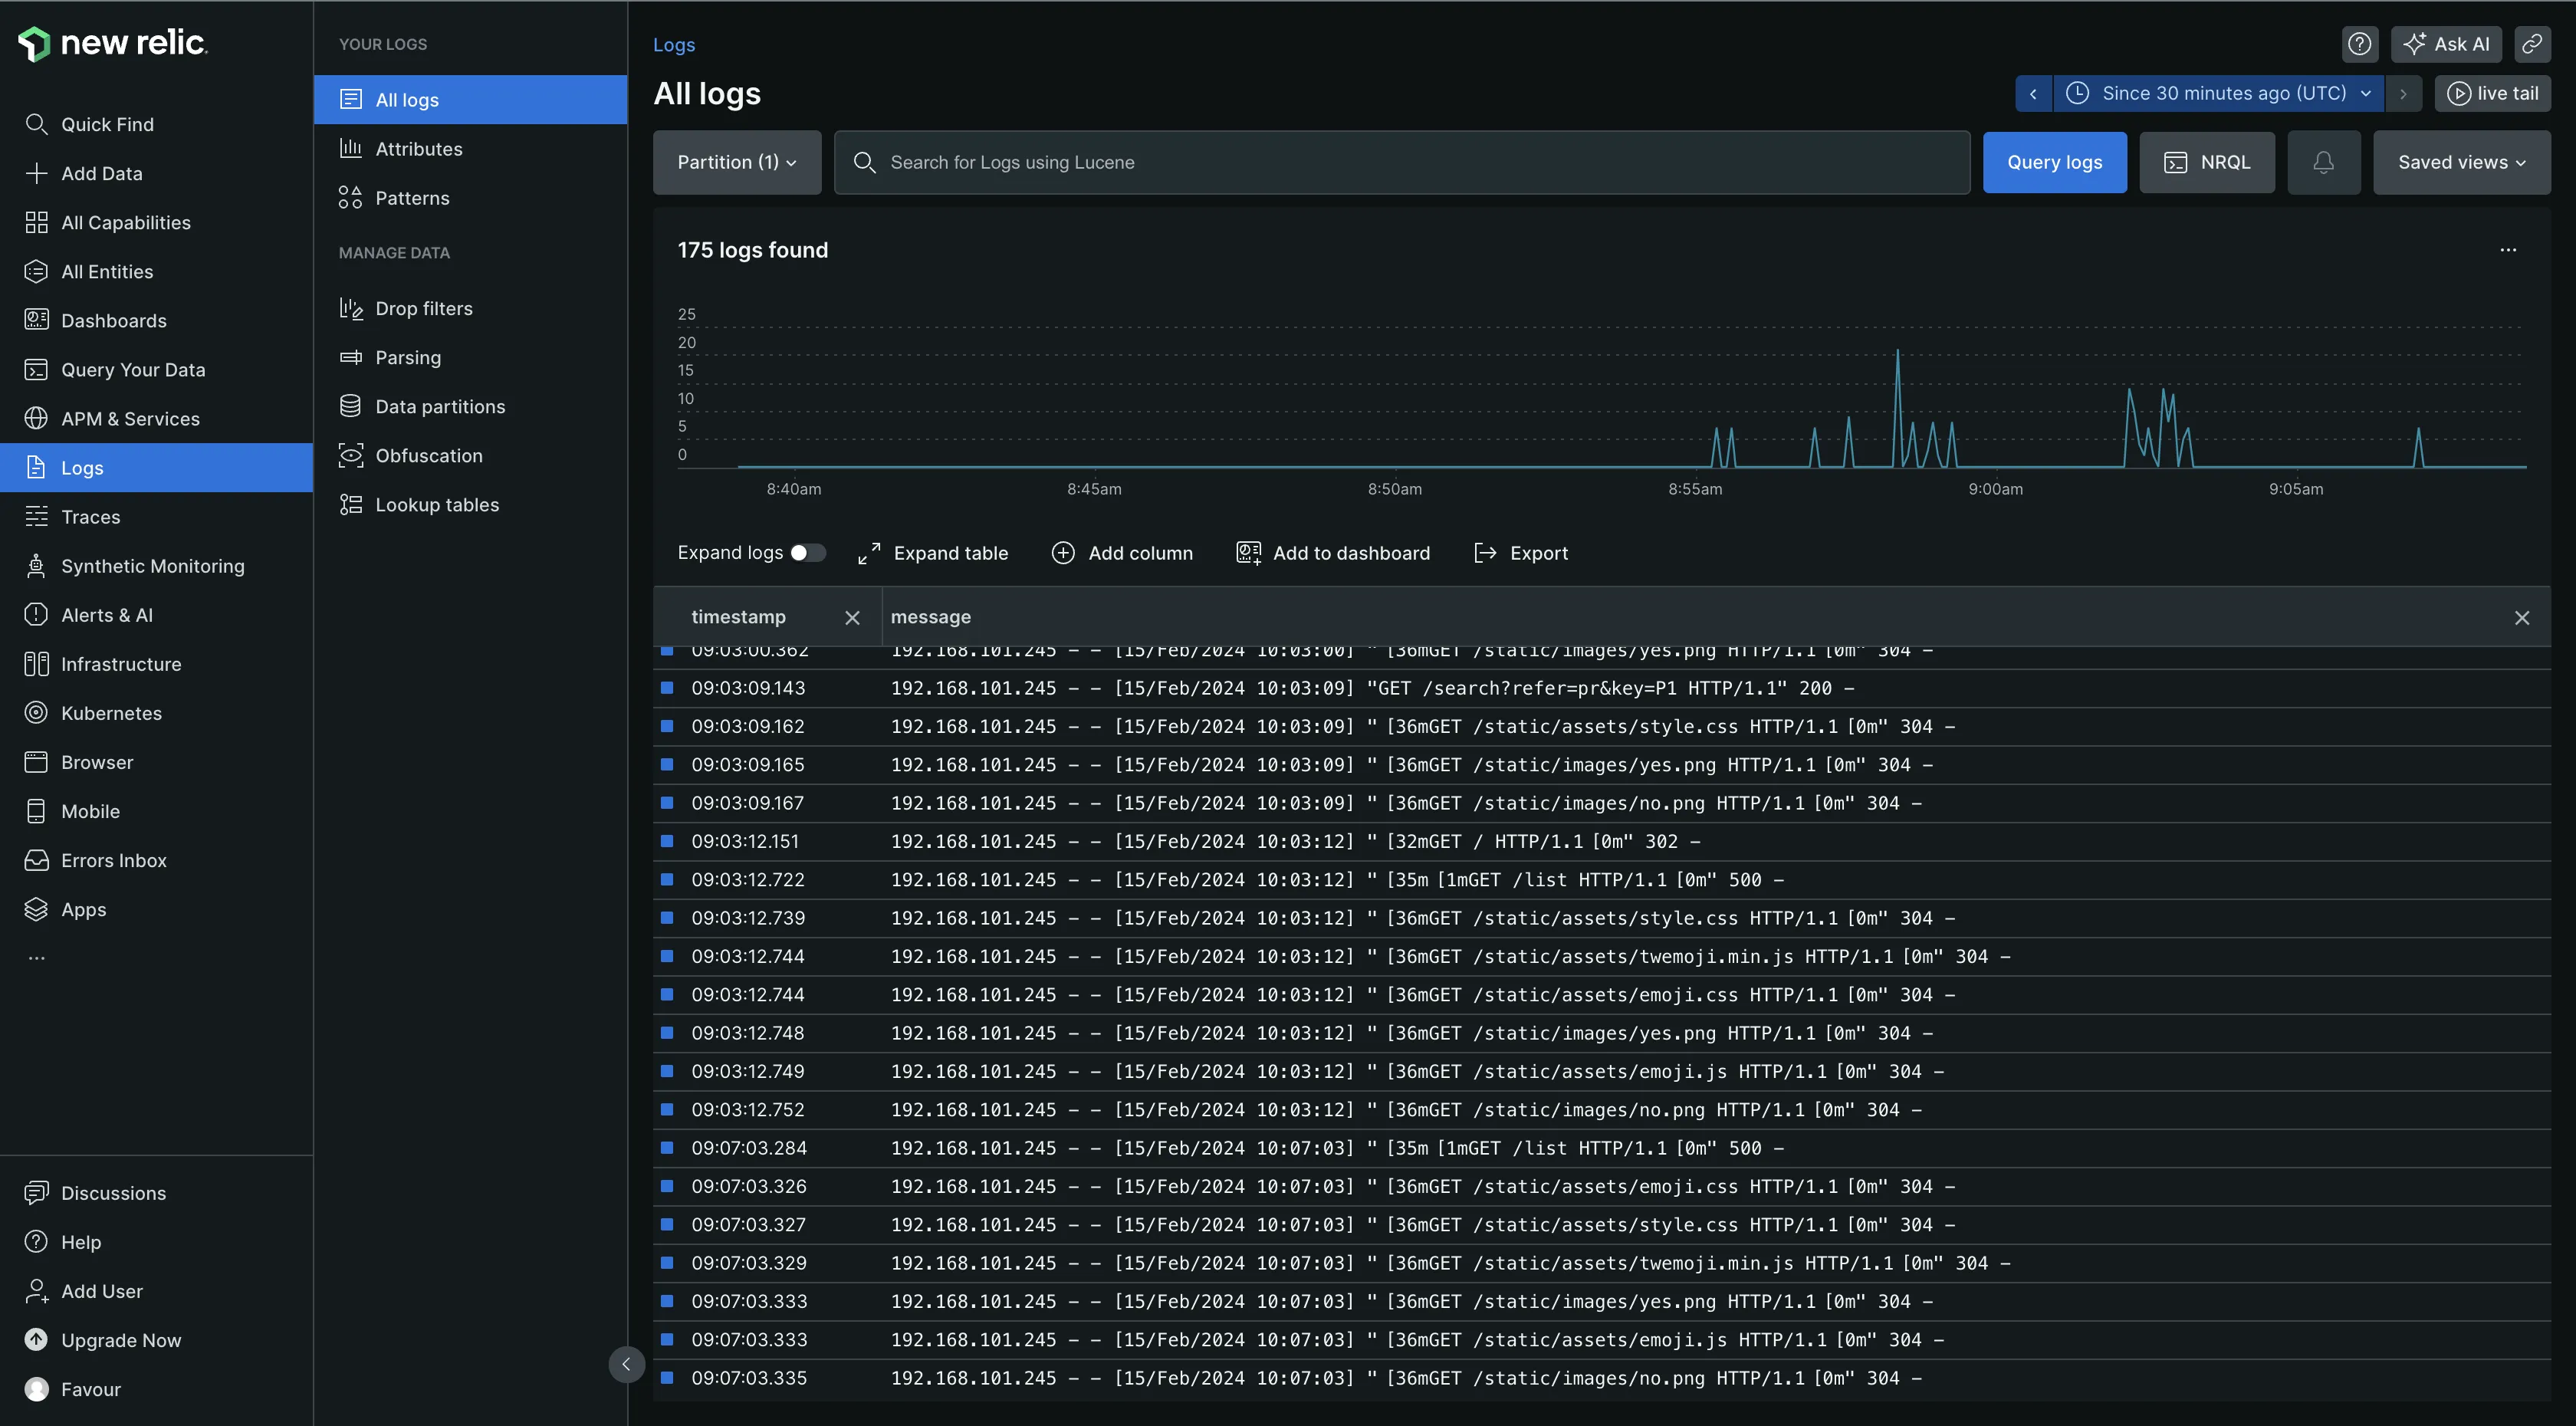
New Relic
New Relic automatically ingested both my infrastructure and application logs, eliminating the need for additional configuration steps. The Logs UI offers functionalities such as log querying and real-time log streaming, which enhance visibility and troubleshooting capabilities. It also enables you to establish alerts and access log data visualizations across the entire platform, ensuring comprehensive monitoring and analysis.
Overall, Dynatrace is a better option for log management, as it has more log management capabilities than New Relic.
Documentation and Community Support: Both
Dynatrace
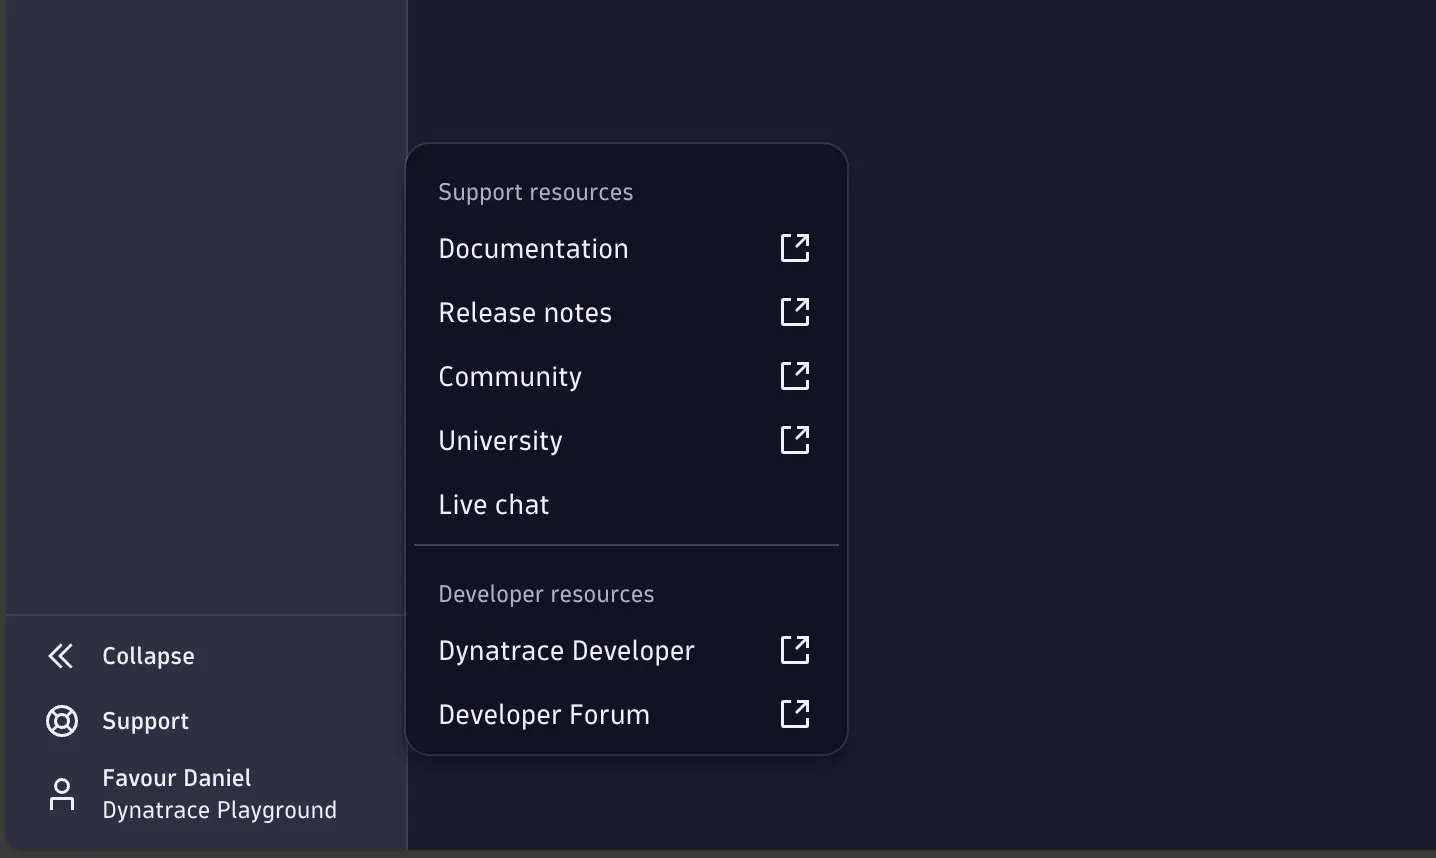
I found the documentation good, but I struggled to understand some things and had to watch videos on their YouTube channel for better clarity. As for community support, Dynatrace has various support resources, as shown in the image below.
New Relic
I found New Relic’s documentation to be good as well. As for community support, it has a support center where you can create support cases, a knowledgebase, a developer forum, a New Relic university for learning all things New Relic, and more.
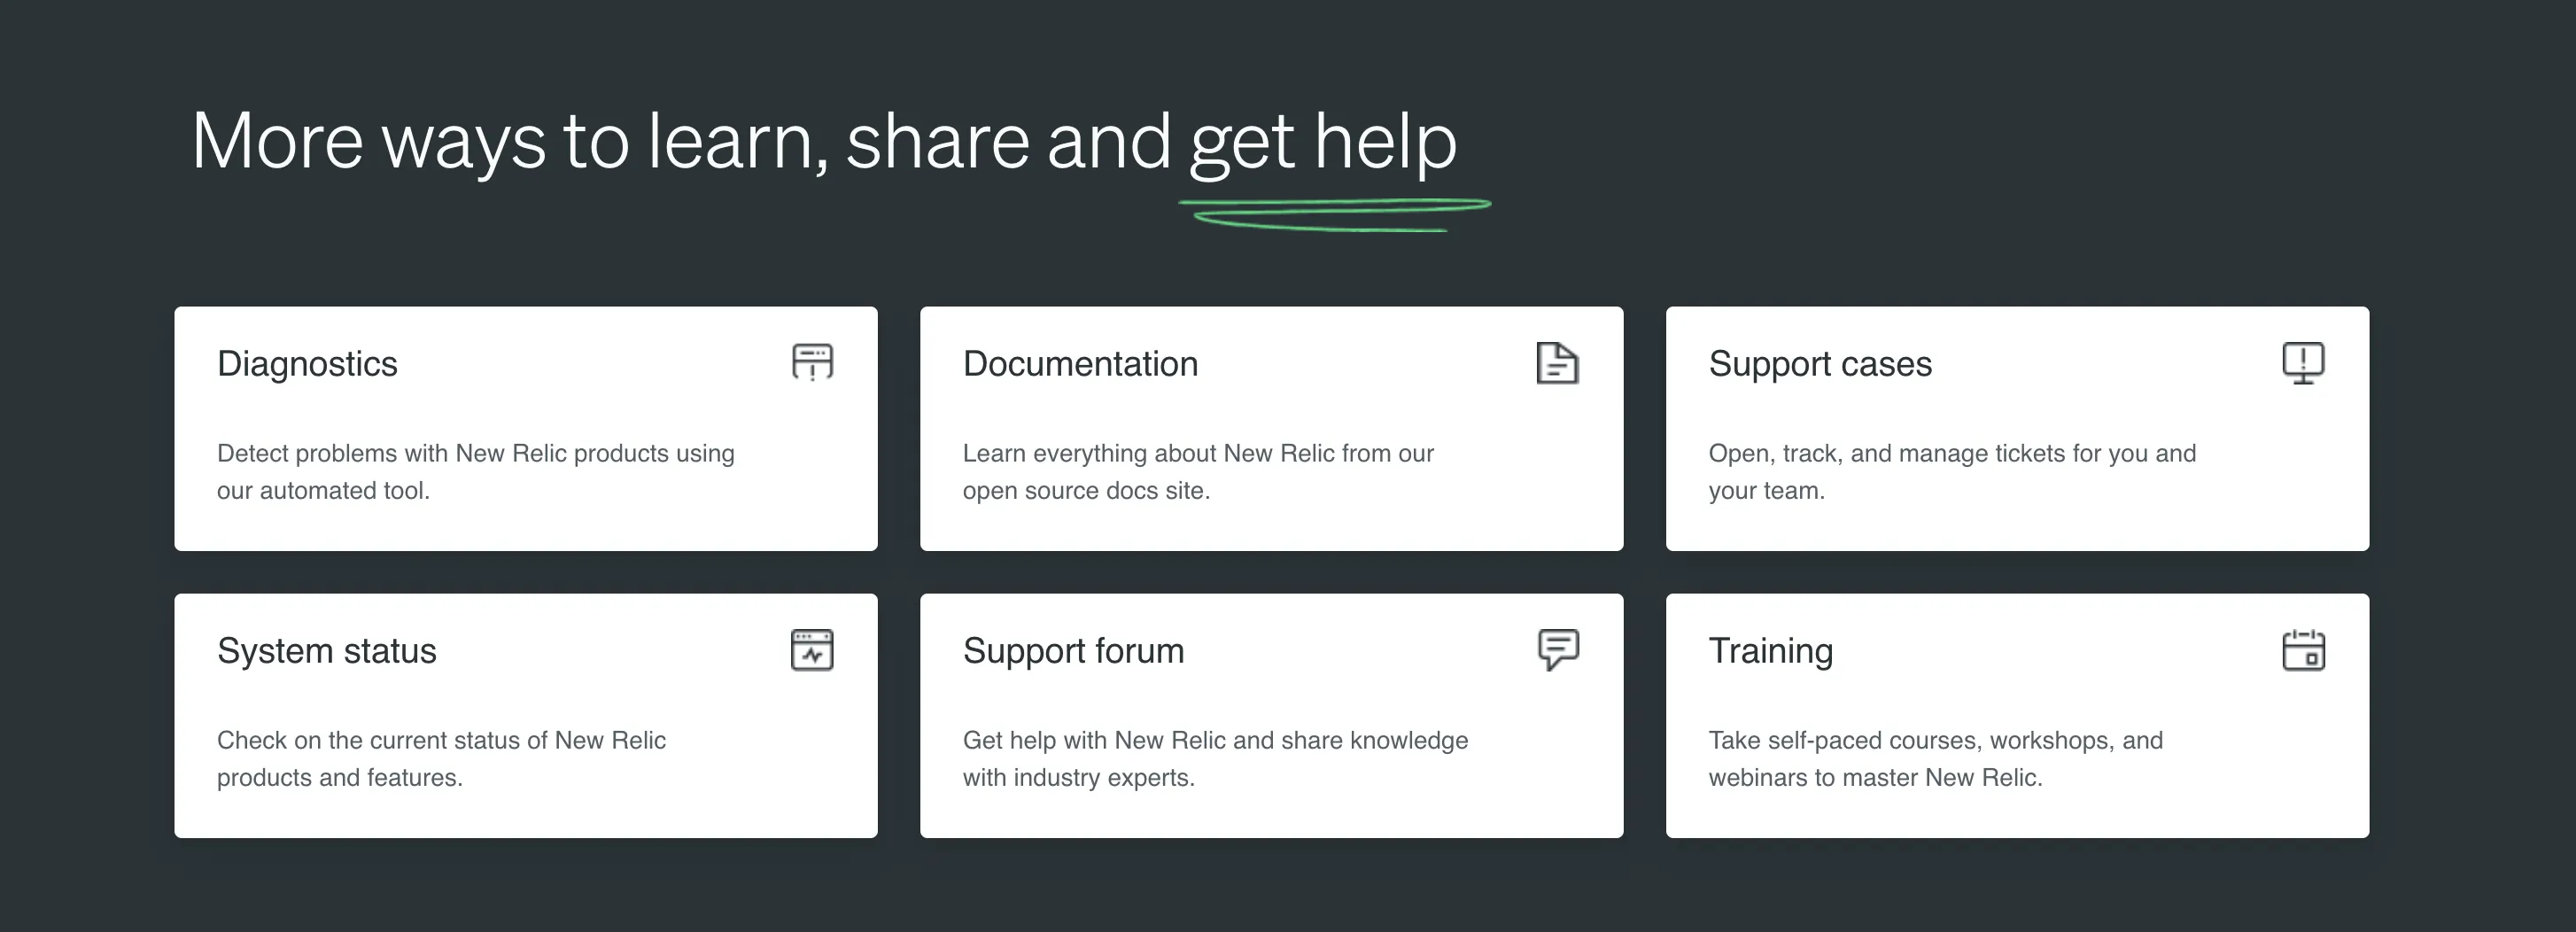
Overall, both tools have great community support and documentation.
Pricing: New Relic
Dynatrace
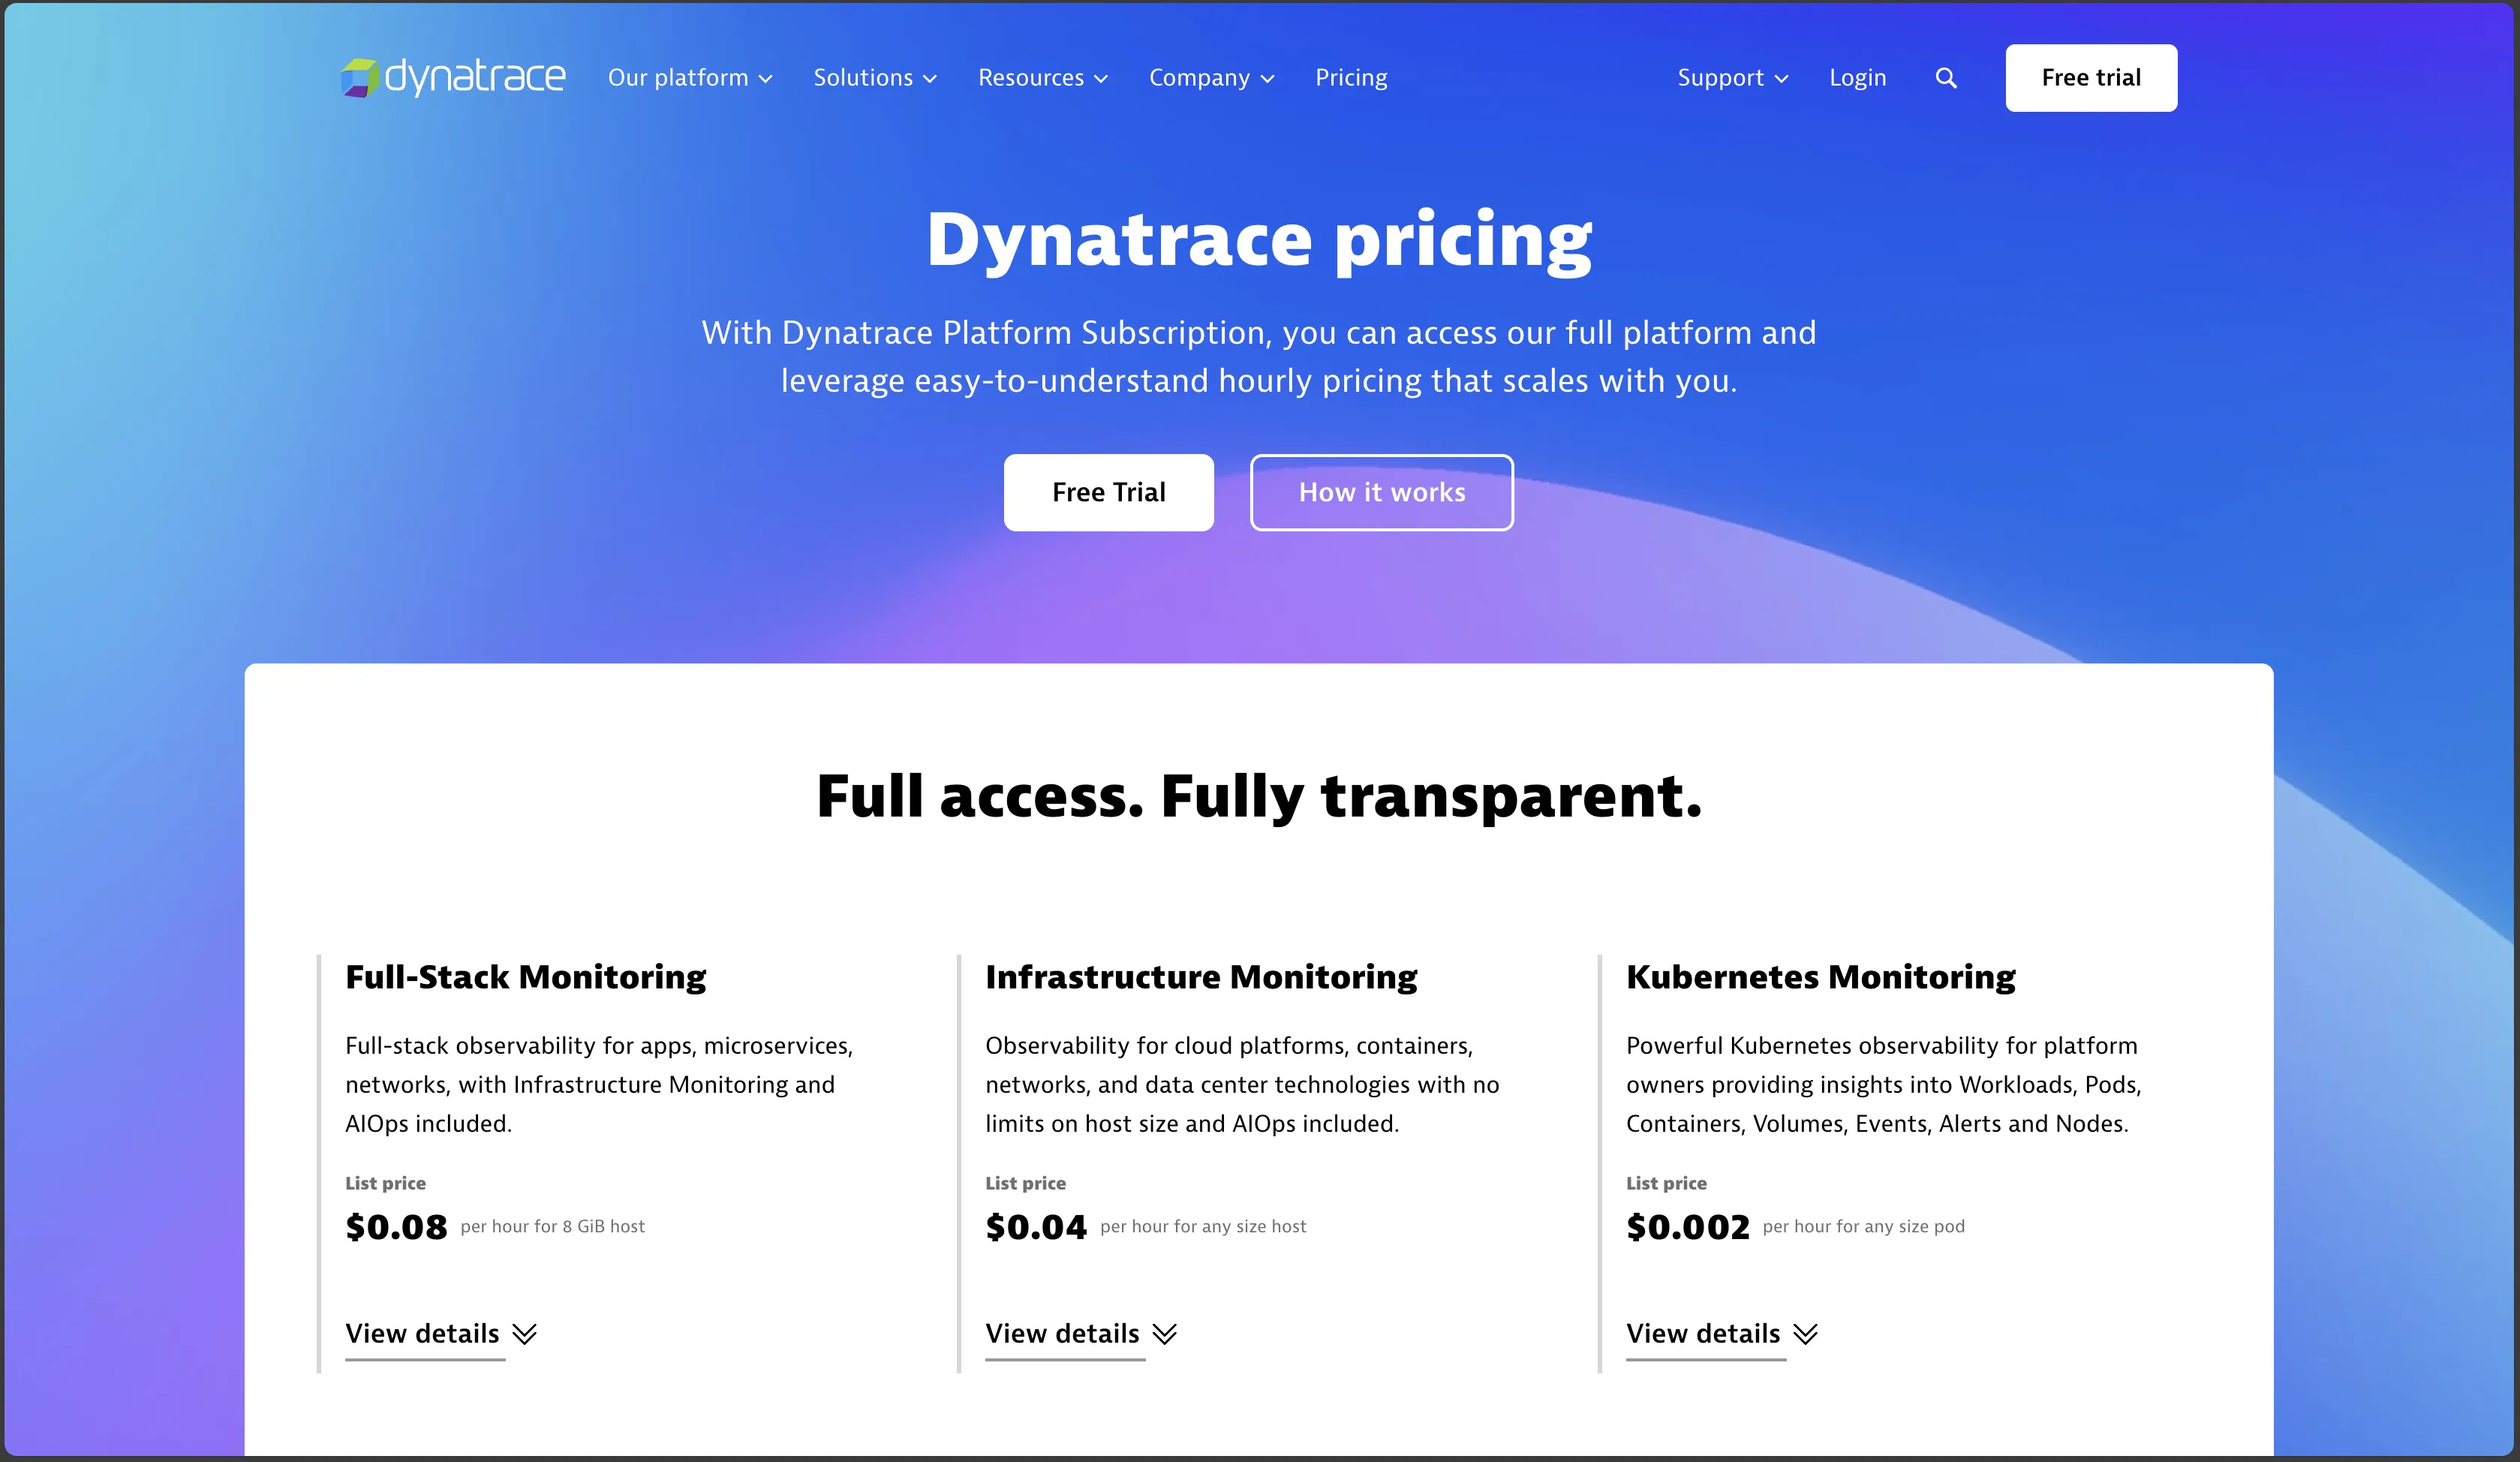
Dynatrace pricing model varies across each service used. It has a 15-day free trial, which gives you access to the platform’s features.
New Relic
New Relic’s pricing is usage-based. Pricing is calculated by the volume of data ingested per month and the number of users.
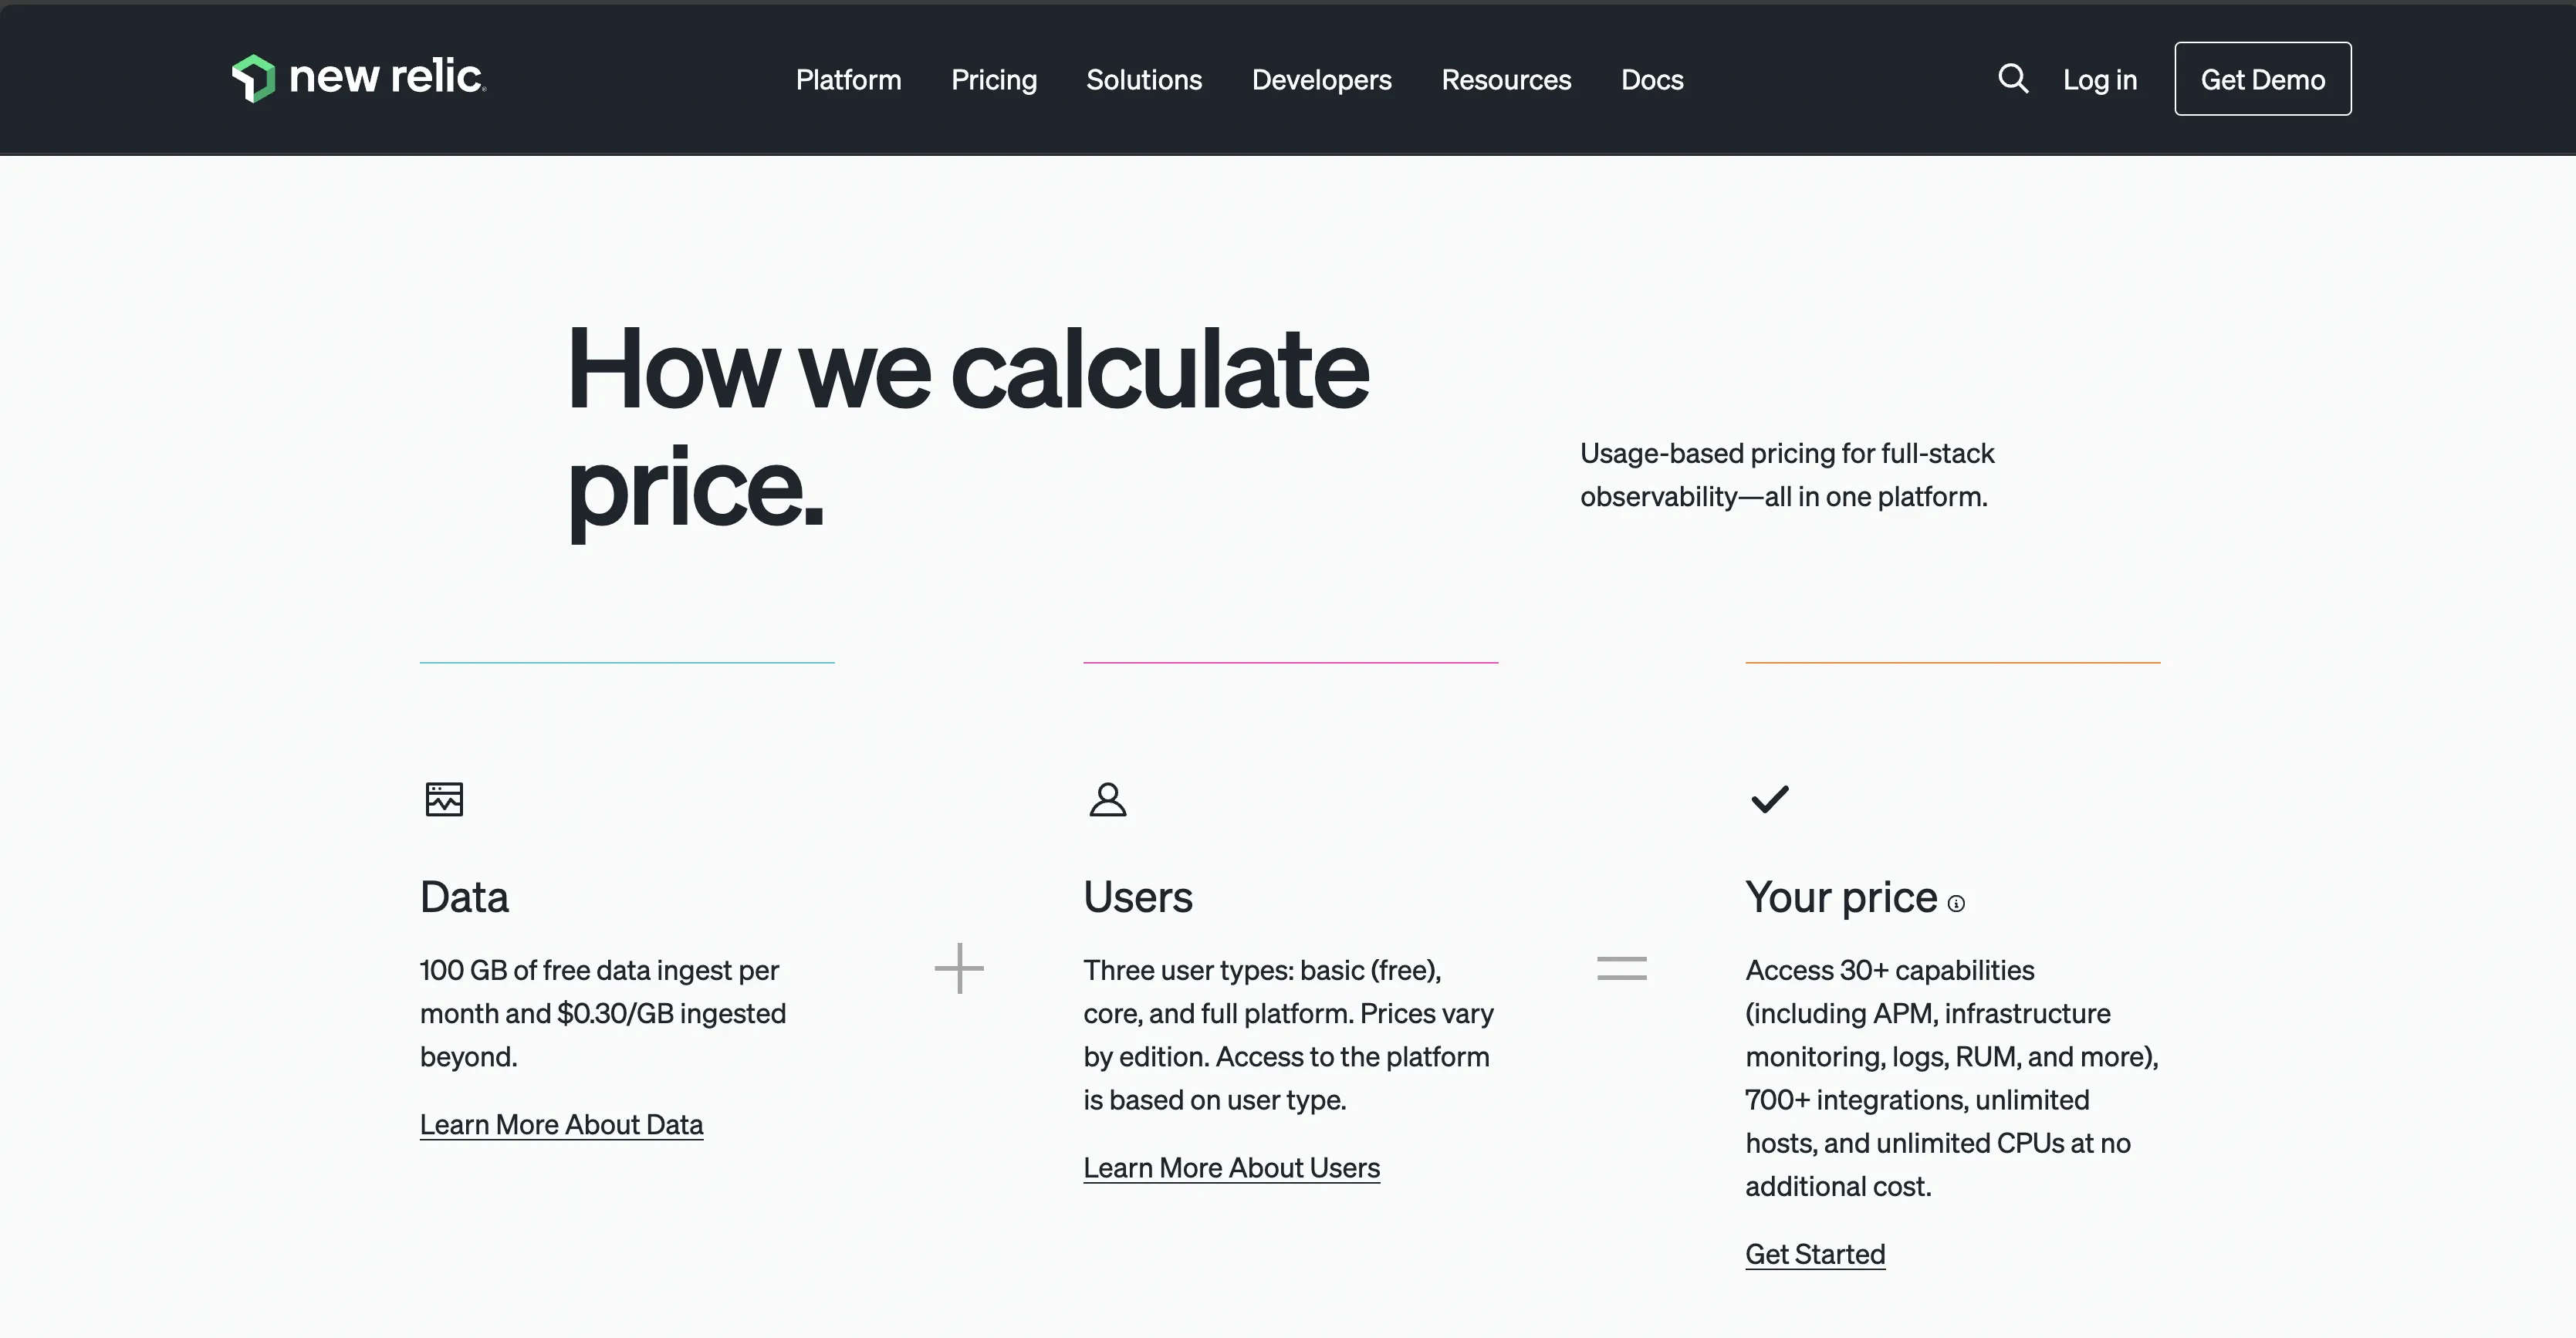
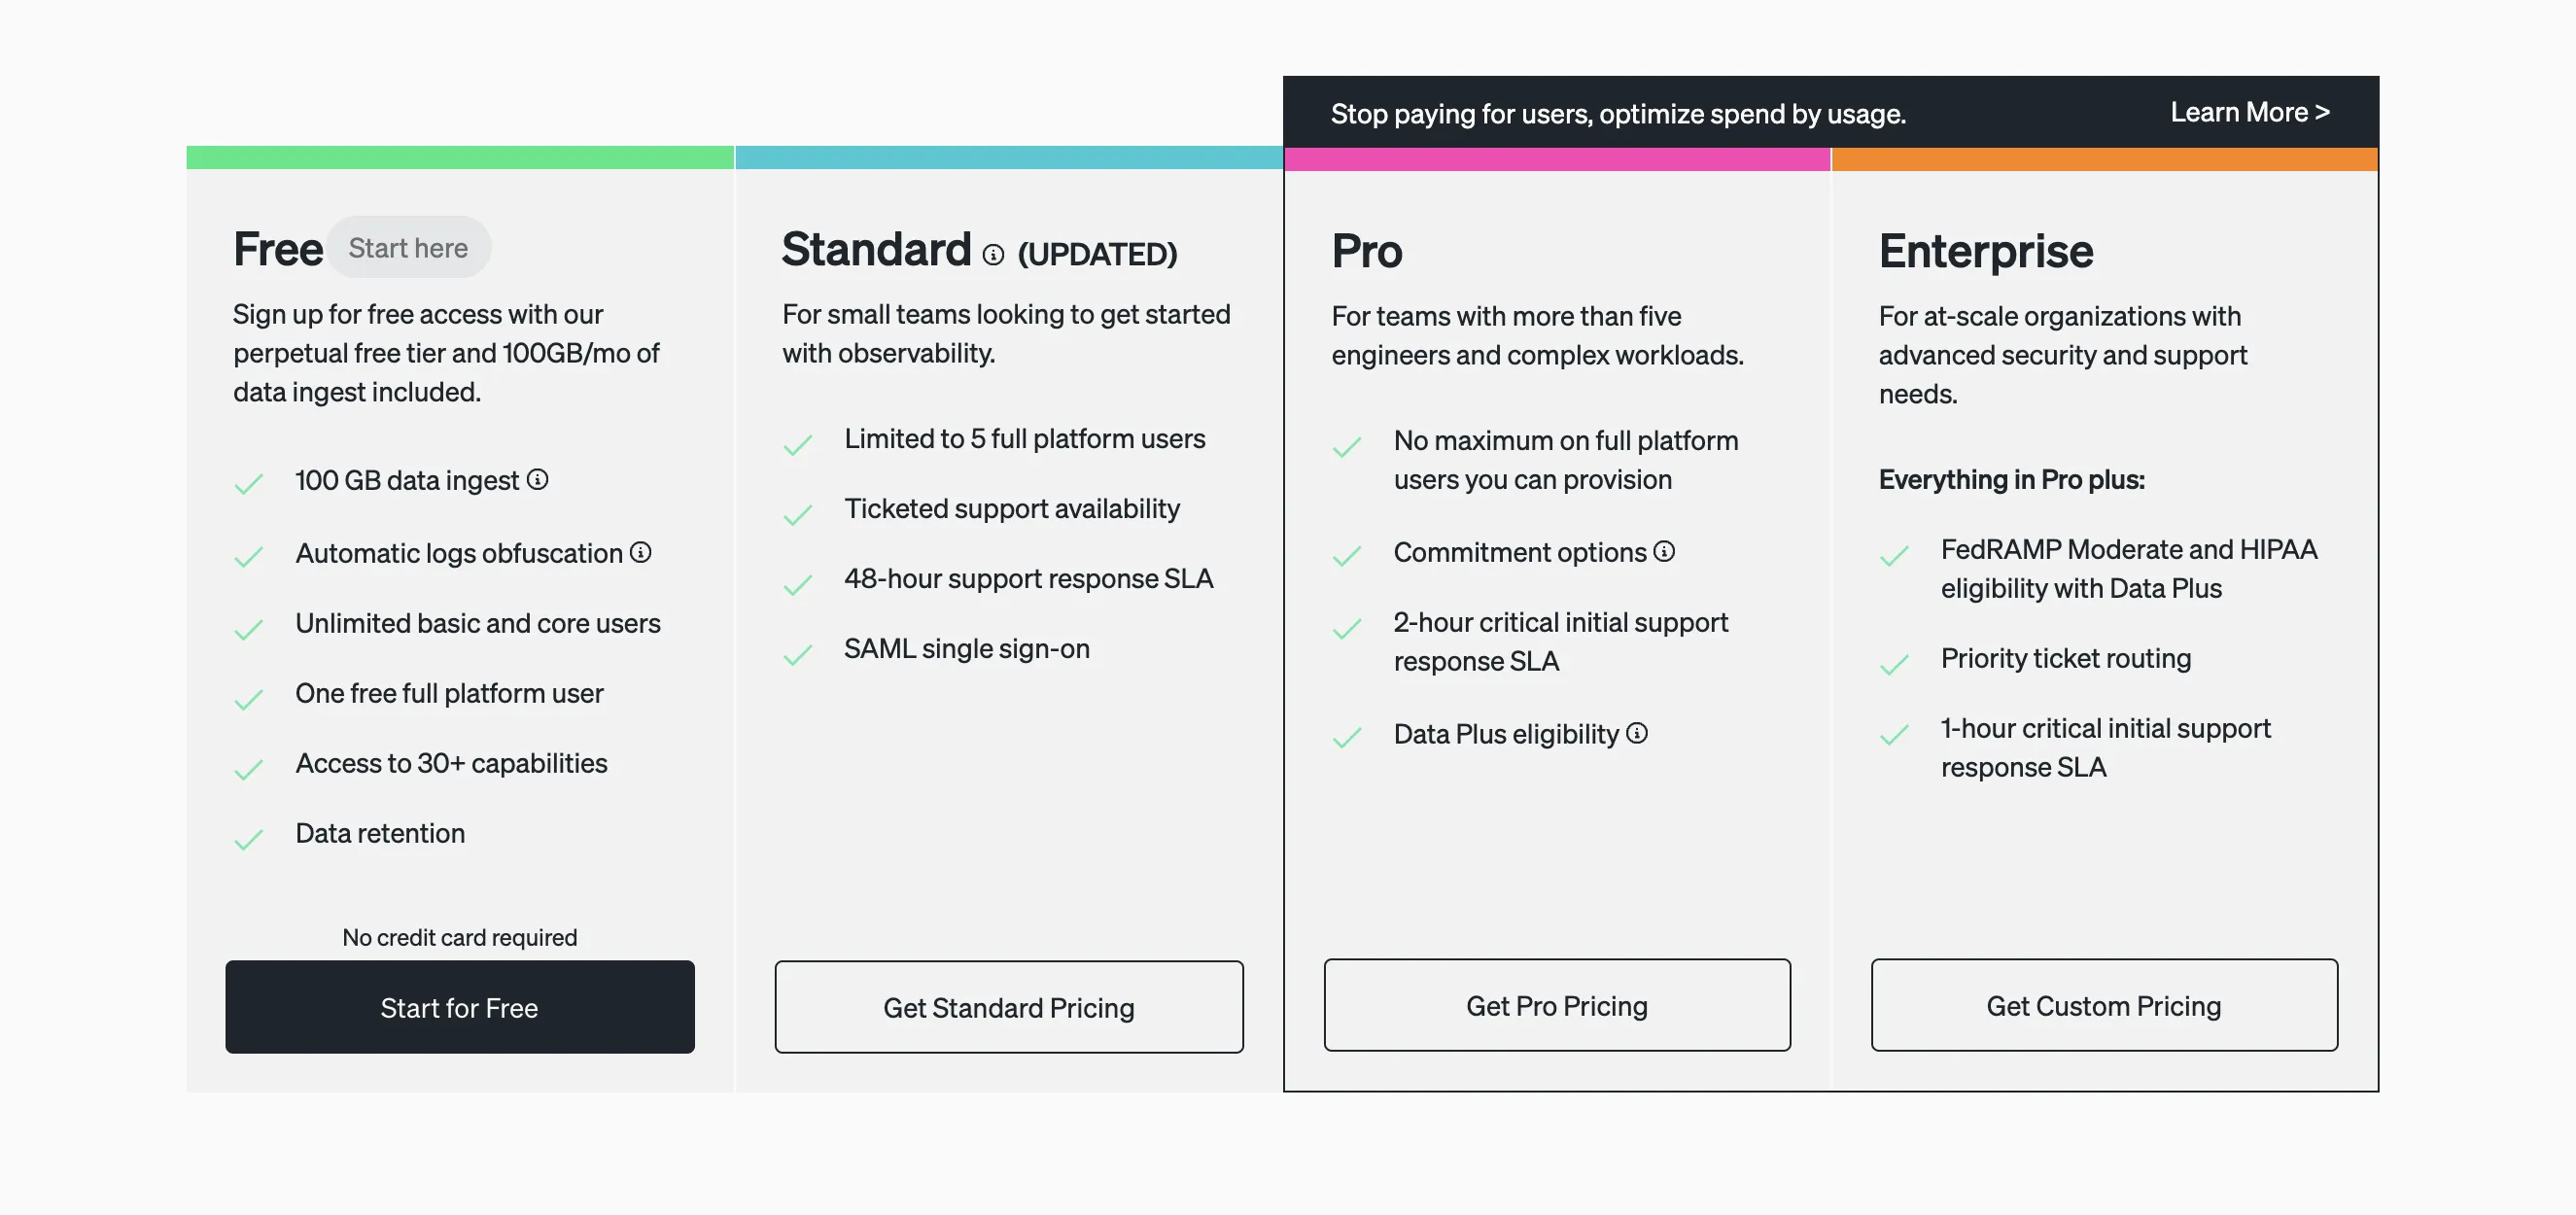
It has four different pricing tiers, with a free forever tier offering access to all 30+ New Relic platform capabilities and 100 GB of free data ingestion per month.
New Relic can be seen as a good option based on its free forever plan, which allows new users to evaluate its capabilities without incurring immediate costs.
UI/UX: New Relic
Dynatrace
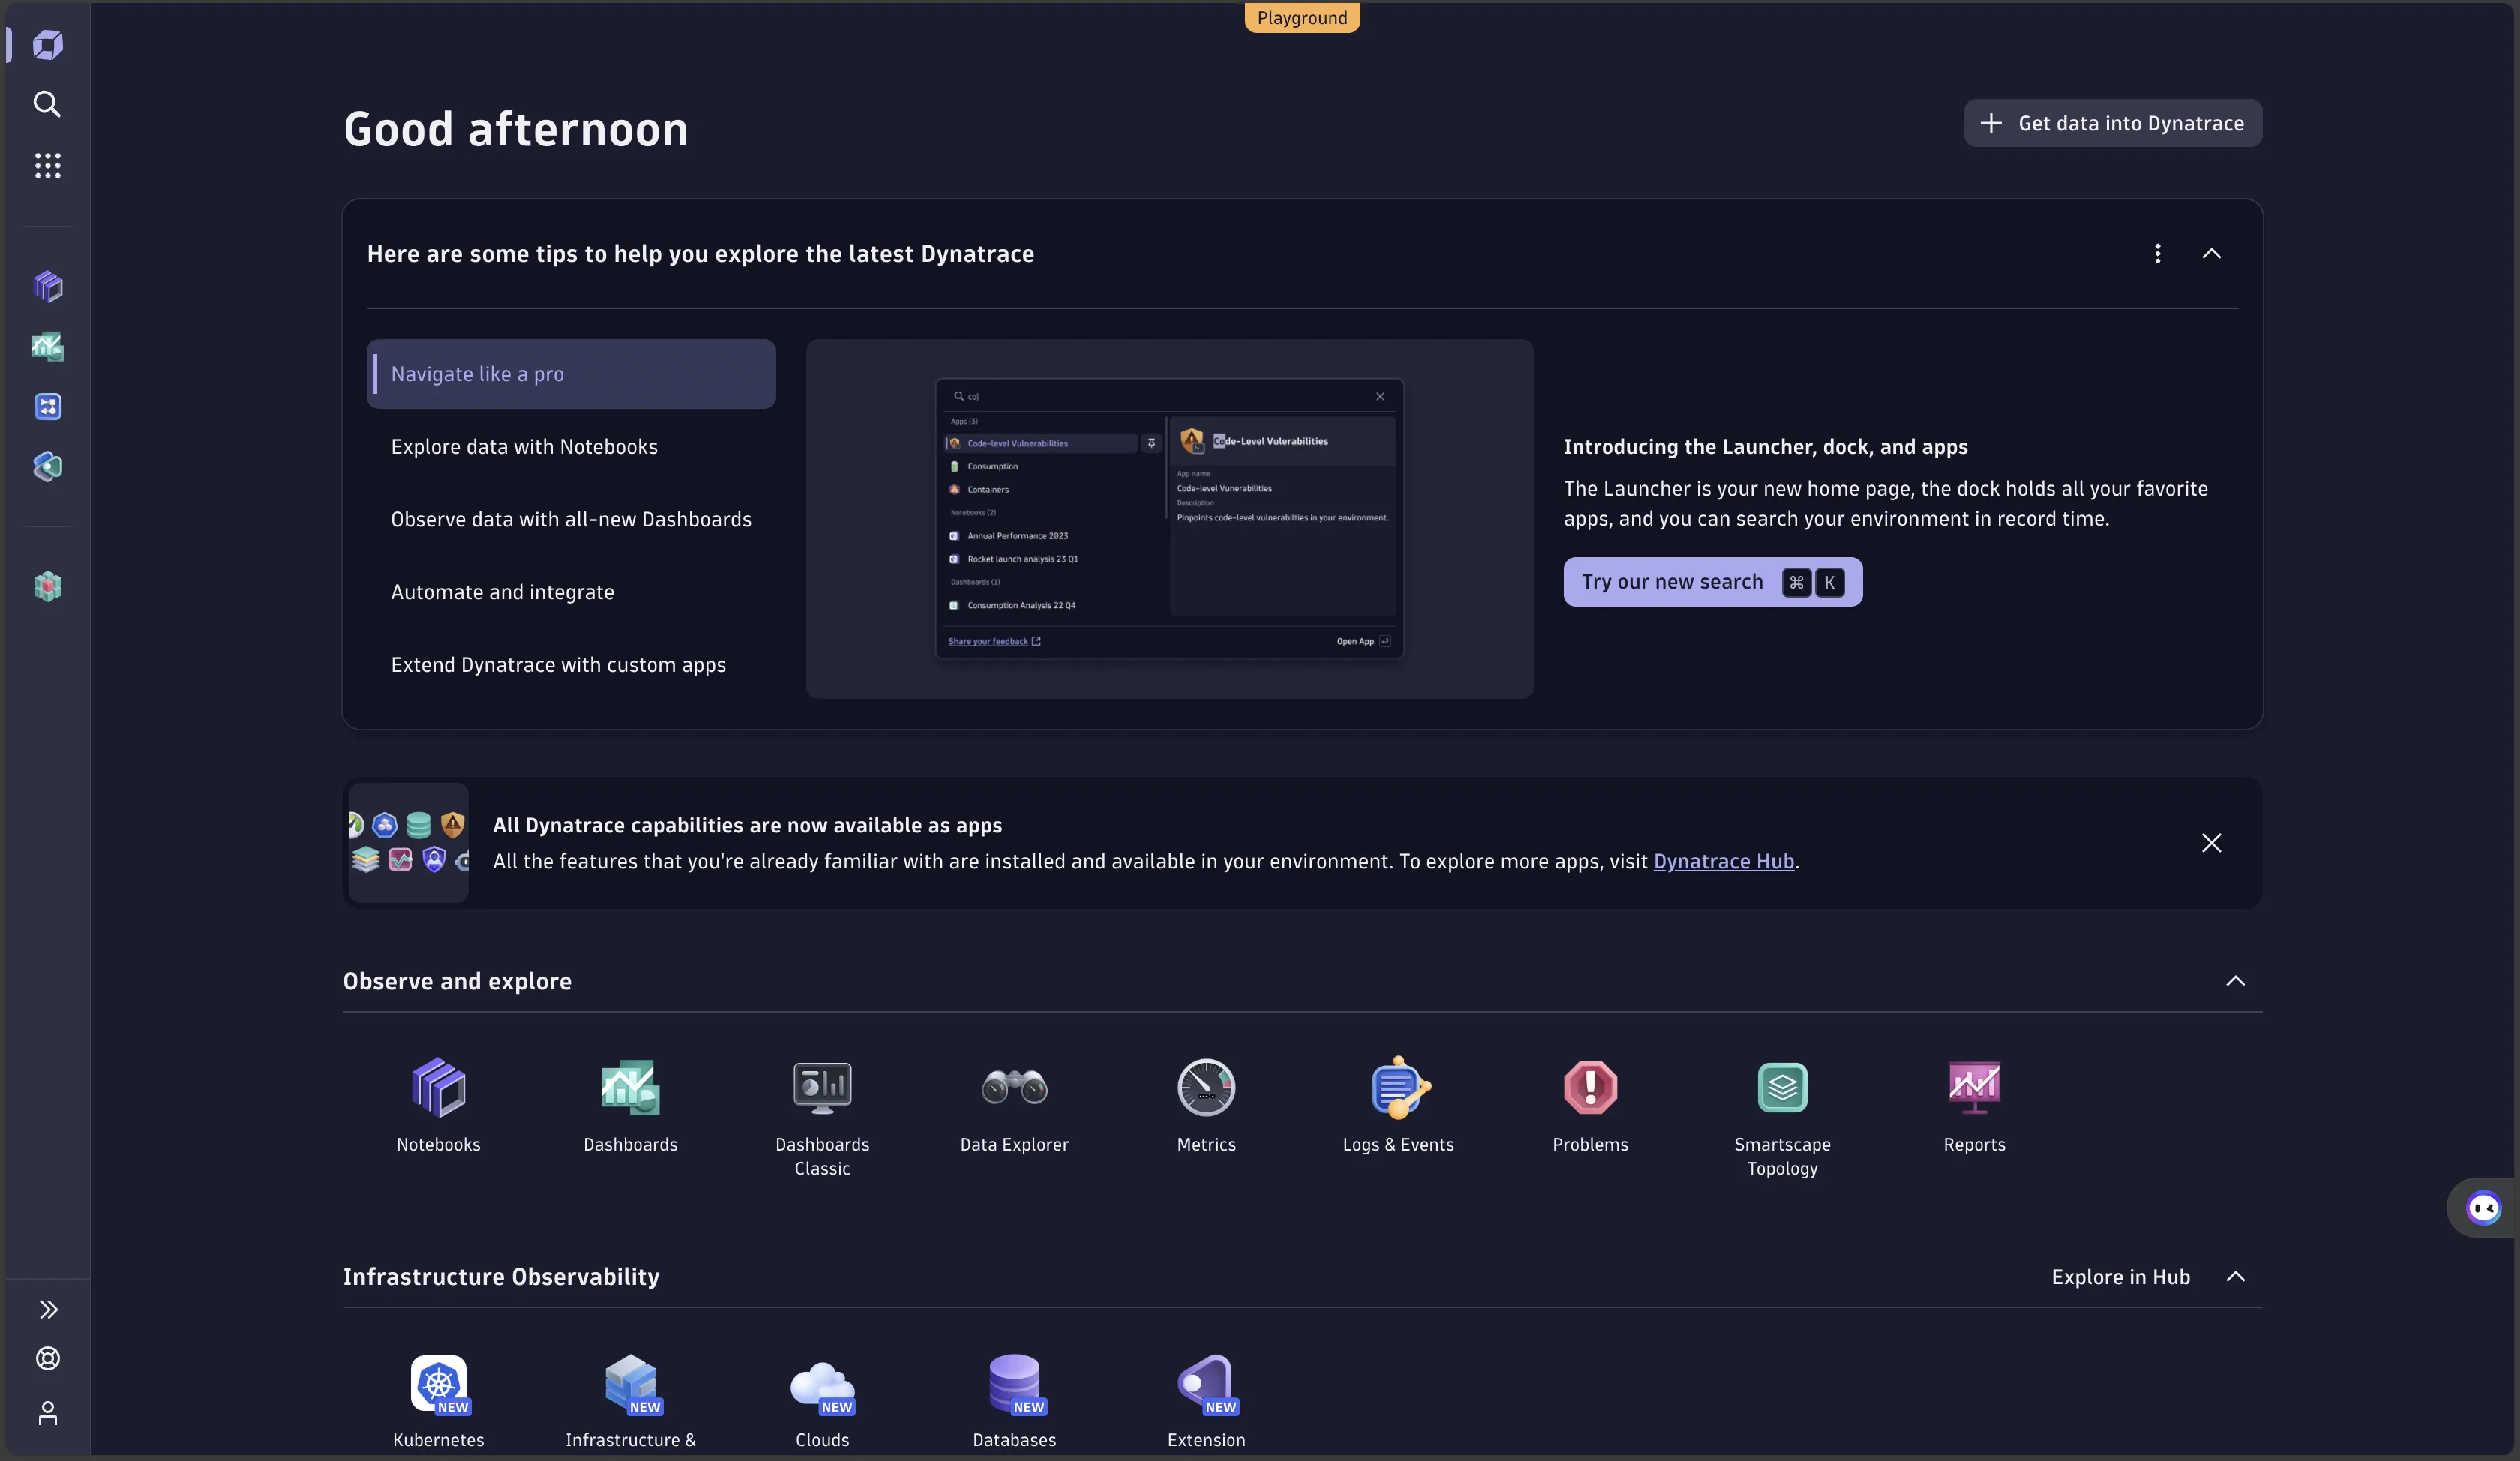
My experience with Dynatrace's user interface was challenging, lacking clarity and intuitiveness. Navigating the platform required frequent reference to the documentation, degrading the overall user experience.
New Relic
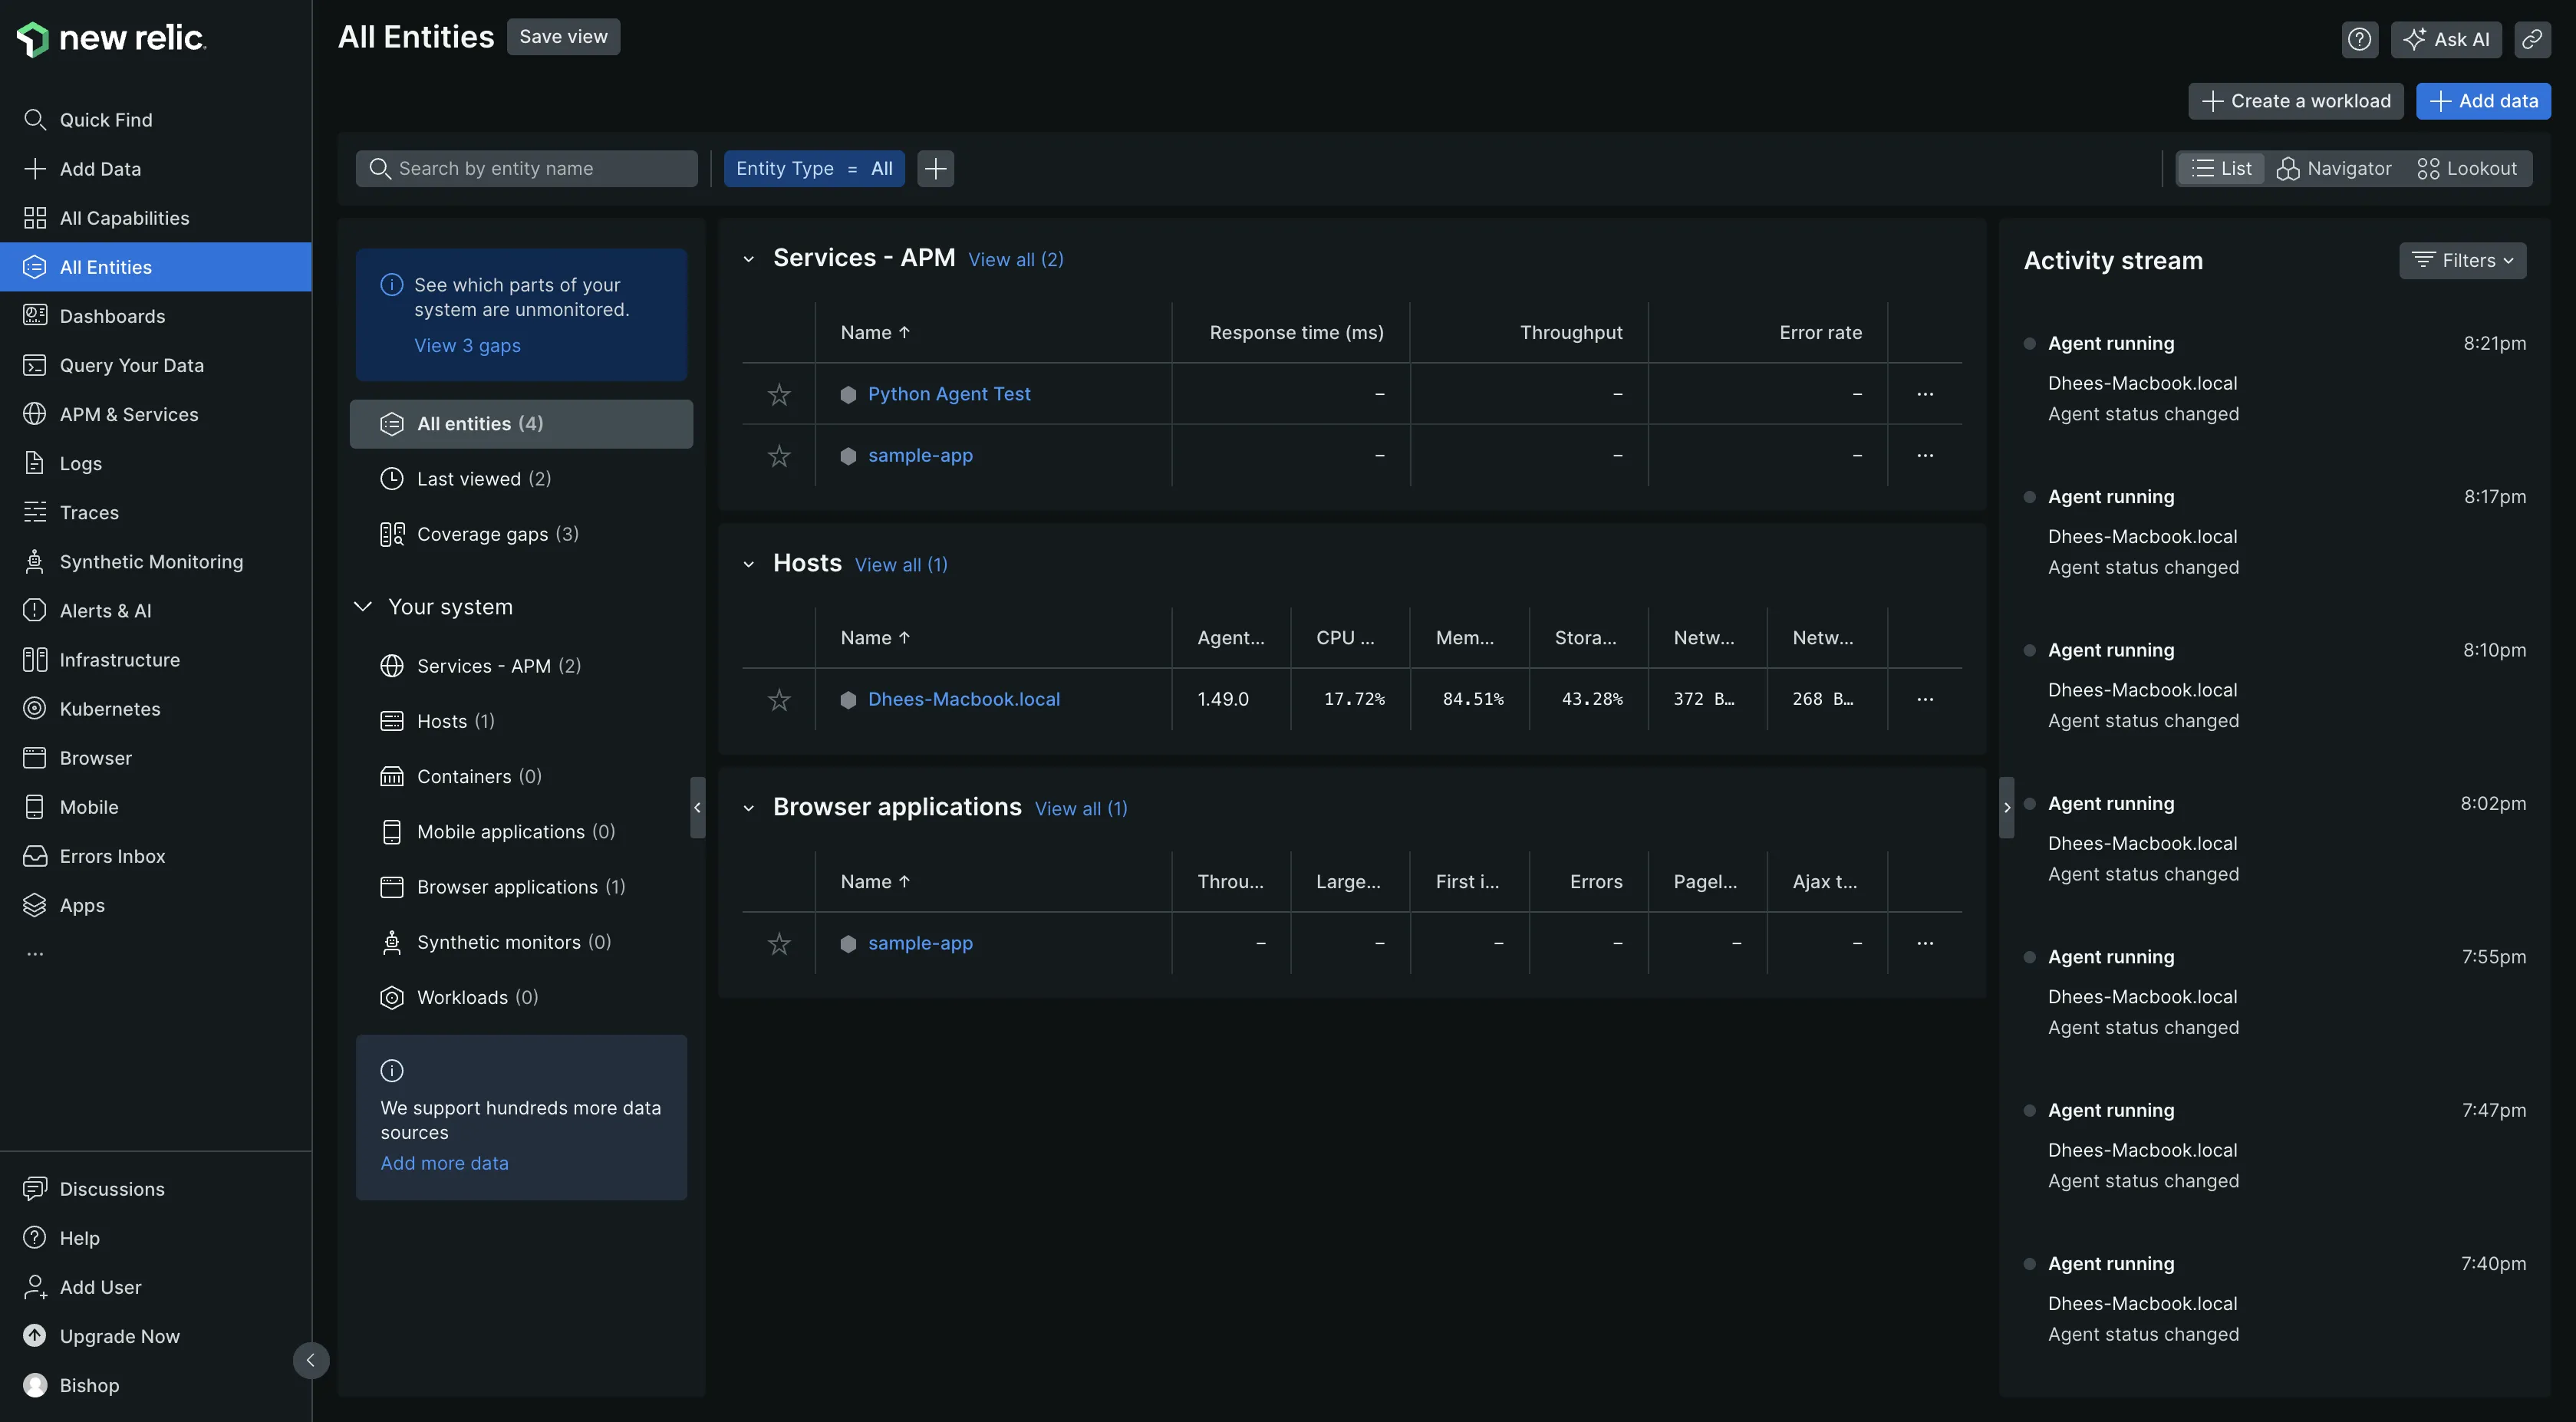
Contrarily, New Relic's user interface is designed to be straightforward and accessible. It offers ready-made dashboards and alert configurations tailored to common needs. The UI is praiseworthy for its simplicity, informativeness, and ease of use. It is very beginner-friendly and improves the user experience.
Dynatrace vs New Relic: The Final Verdict
Both Dynatrace and New Relic are powerful monitoring tools, each with its own strengths and weaknesses. If you require a comprehensive and robust monitoring platform with AI-driven application performance analysis and real-time troubleshooting, Dynatrace is the preferred choice.
However, it's essential to note that Dynatrace can be complex, with a steep learning curve for beginners. On the other hand, New Relic is a solid option if you prioritize user friendliness and simplicity without compromising on monitoring capabilities.
Worth noting on the AI and pricing angle: Dynatrace leans on Davis, its deterministic AI engine that uses the topology model to pinpoint root cause, while New Relic pairs anomaly-style detection with a usage-based pricing model built around data ingest and per-user seats. The core contrast is Dynatrace's automated, agent-driven depth versus New Relic's broad, consumption-priced platform.
A better Dynatrace and New Relic Alternative: SigNoz
While Dynatrace and New Relic offer commendable monitoring capabilities, they come with certain limitations, like cost and complexity, that may prompt you to explore alternative solutions.
SigNoz is a full-stack open-source application performance monitoring and observability tool that serves as an excellent Dynatrace and New Relic alternative.
One of SigNoz's key strengths is its native integration with OpenTelemetry, the emerging industry standard for telemetry data generation and management. It also uses Clickhouse - a powerful OLAP database, as its storage backend for faster ingestion and aggregation.
SigNoz provides additional features that enhance its capabilities, such as:
- Comprehensive log management capabilities.
- Monitoring of crucial application metrics, such as p99 latency, error rates, and performance of services, external API calls, and specific endpoints.
- Facilitated root cause analysis through access to detailed traces, enabling users to identify and address underlying issues effectively.
- Aggregation of trace data to derive meaningful business metrics.
- Robust alerting functionality to notify users of critical metrics or performance anomalies.
Getting Started with SigNoz
SigNoz cloud is the easiest way to run SigNoz. Sign up for a free account and get 30 days of unlimited access to all features.

You can also install and self-host SigNoz yourself since it is open-source. With 16,000+ GitHub stars, open-source SigNoz is loved by developers. Find the instructions to self-host SigNoz.
Further Reading:
