Graylog vs. Splunk - The Ultimate Log Management Showdown
Log management is critical for monitoring modern applications, especially in cloud-native environments where microservices and containers produce high volumes of logs. As your infrastructure scales, choosing the right log management solution becomes essential for maintaining security, performance, and reliability.
In this comprehensive comparison, we'll examine Graylog, Splunk, and SigNoz—three powerful log management and analysis tools—with a focus on their suitability for cloud-native applications.
If you're short on time: Choose Graylog for cost-effective log management with technical expertise, Splunk for enterprise-grade features with budget flexibility, or SigNoz for unified observability (logs, metrics, and traces) in cloud-native environments.
Comparison at a Glance
Here's a quick comparison table to help you understand the key differences between these tools:
| Feature | Graylog | Splunk | SigNoz |
|---|---|---|---|
| Core Focus | Log management and analysis | Comprehensive machine data analytics | Full-stack observability (logs, metrics, traces) |
| Pricing Model | Open-source core with paid enterprise features | Commercial with volume-based pricing | Open-source with optional cloud service |
| Cost (100GB/day) | ~$20K/year (Enterprise) | $150K+/year | Free (self-hosted) or ~$9K/year (Cloud) |
| Technology | Elasticsearch/OpenSearch + MongoDB | Proprietary indexing and search | ClickHouse (columnar database) |
| Query Language | Lucene-based | SPL (Search Processing Language) | SQL/PromQL + UI query builder |
| Cloud-Native Fit | Moderate | Legacy-to-cloud transition | Excellent (built for Kubernetes) |
| Deployment | On-prem, cloud, self-managed | On-prem, cloud, hybrid | Kubernetes-native, Docker, Cloud |
| Scalability | Good (with proper tuning) | Excellent (with sufficient resources) | Very good (efficient resource usage) |
| Learning Curve | Moderate | Steep | Gentle |
Core Features and Capabilities
Graylog: Focused Log Management
Graylog is an open-source platform centered on log collection and analysis. It excels at gathering logs from diverse sources and making them searchable.
Key Strengths:
- Diverse Log Ingestion: Supports multiple input methods including syslog, APIs, Beats, and GELF (Graylog Extended Log Format)
- Fast Search: Uses Elasticsearch/OpenSearch for millisecond-level full-text searching across terabytes of data
- Stream Processing: Real-time filtering and routing of logs to dashboards or alerting channels
- Extensibility: Plugin marketplace for extending functionality with custom integrations
Graylog stores logs in Elasticsearch (or OpenSearch) and metadata in MongoDB, providing a solid foundation for log management. Its Lucene-based search language allows for quick full-text queries, and users can save common searches for reuse.
The alerting system runs searches on a schedule and triggers notifications when conditions are met. For security-focused teams, Graylog offers role-based access control and audit logging in its enterprise version.
Splunk: Enterprise Data Analytics Platform
Splunk is a commercial platform with capabilities extending beyond log management. It can ingest virtually any machine-generated data and provides powerful analytics tools.
Key Strengths:
- Comprehensive Data Handling: Indexes structured and unstructured data from any source in near real-time
- Powerful Search Language: SPL (Search Processing Language) enables complex queries, correlations, and transformations
- Advanced Analytics: Built-in Machine Learning Toolkit for anomaly detection and predictive analytics
- Rich Ecosystem: Thousands of apps and add-ons via Splunkbase for specialized use cases
Splunk's architecture includes forwarders (for data collection), indexers (for storage), and search heads (for queries). Its proprietary indexing technology is optimized for speed, enabling it to handle enterprise-level volumes.
The platform excels at security use cases with Splunk Enterprise Security (SIEM) offering threat detection, compliance reporting, and security analytics. However, this power comes with complexity—SPL has a learning curve, and the plethora of features can be overwhelming for simple use cases.
SigNoz: Unified Observability for Cloud-Native
SigNoz is an open-source observability platform that goes beyond log management to include metrics and distributed tracing in one tool. It's designed specifically for modern, cloud-native applications.
Key Strengths:
- Unified Telemetry: Combines logs, metrics, and traces in a single platform
- OpenTelemetry Native: Leverages the CNCF standard for instrumentation, avoiding vendor lock-in
- Efficient Storage: Uses ClickHouse columnar database for fast queries and lower resource usage
- Kubernetes Ready: Designed for container environments with easy deployment via Helm charts
SigNoz provides a simple query builder and supports filters for log analysis, along with SQL/PromQL for advanced users. Its integrated approach allows you to jump from a metrics dashboard to related logs or from an error log to the trace of that request—streamlining troubleshooting.
While newer than Graylog or Splunk, SigNoz offers essential log management features (search, filters, alerts) and excels at correlating logs with traces and metrics. This makes it particularly valuable for debugging microservice architectures.
SigNoz's ClickHouse backend has shown impressive performance in benchmarks—ingesting logs 2.5× faster than ELK stacks while using 50% fewer resources. This efficiency is crucial for cloud environments where resource optimization impacts costs.
Deployment Options
Graylog: Flexible but Requires Setup
Graylog offers flexible deployment models suitable for both on-premises and cloud environments:
- On-Premises: Self-hosted on your infrastructure as Java services with Elasticsearch/OpenSearch and MongoDB
- Cloud: Can be deployed on cloud VMs or containerized (Docker/Kubernetes)
- Managed Service: Graylog Cloud for those who prefer SaaS
For production deployments, Graylog typically requires a cluster of nodes behind a load balancer and an Elasticsearch cluster for indexing. While a single instance is straightforward to set up, production clusters need careful planning.
Real-world examples include organizations handling over 1 TB/day of logs using Graylog in OpenStack environments. The platform scales horizontally as log volume grows, but requires expertise to manage effectively.
Splunk: Powerful but Resource-Intensive
Splunk supports various deployment models with some complexity:
- Self-Managed: Installed on your servers (commonly Linux)
- Cloud: Splunk Cloud hosted on AWS/GCP
- Hybrid: On-premises forwarders with cloud indexing
Large Splunk deployments involve multiple components (forwarders, indexers, search heads) distributed across machines. This architecture can become complex—Splunk often recommends professional services for designing big deployments.
Splunk is not lightweight; each server can be resource-intensive (CPU, memory, storage I/O). Recent enhancements like SmartStore (which offloads index storage to S3) make it more cloud-friendly, but achieving elasticity in a cloud-native sense requires planning.
SigNoz: Cloud-Native by Design
SigNoz was built with modern deployment patterns in mind:
- Kubernetes-Native: Distributed as Docker containers and Helm charts
- Self-Hosted: Can run on any K8s cluster or even Docker Compose for smaller setups
- Managed Service: SigNoz Cloud provides a fully managed SaaS option
Thanks to its modular architecture (collectors, query service, ClickHouse DB), SigNoz scales horizontally as demand increases. Getting it running on a Kubernetes cluster is relatively quick with one-line Helm installation and sensible defaults.
This cloud-native approach means teams can embed SigNoz into their infrastructure-as-code workflows (Terraform, Helm) and leverage container orchestration for scaling and resilience.
Pricing Models and Total Cost of Ownership
The cost structures of these tools vary dramatically, which significantly impacts total cost of ownership (TCO), especially at scale.
Graylog: Cost-Effective Open Source
- Graylog Open: Free to use (self-hosted)
- Graylog Enterprise: Based on daily ingest volume
- 5 GB/day: Free
- 20 GB/day: ~$12K/year
- 50 GB/day: ~$20K/year
- Graylog Cloud: Starts at $1,250/month for 10 GB/day
Organizations using Graylog Open only need to budget for infrastructure and maintenance. One team reported handling ~250GB/day of logs with Graylog on cloud VMs for about $3.7K/month in infrastructure costs.
The "hidden" cost is the effort to manage it; high availability and scaling require expertise. However, for large-scale log data needs, Graylog's open-source model can drastically lower direct costs compared to commercial alternatives.
Splunk: Premium Pricing
- Traditional Licensing: Based on peak daily data ingest
- 100 GB/day: $150K+/year
- 600 GB/day: $1M+/year
- 3 TB/day: $3.5M/year (reported by one organization)
- Additional Costs:
- Add-ons (Enterprise Security, etc.): $2K-$4K/month
- Infrastructure: $10K-$15K/month for cloud or on-prem resources
Splunk has introduced more nuanced pricing recently, including infrastructure-based pricing (per host) and workload-based pricing. However, for log management, volume-based pricing remains common and can become prohibitively expensive as data grows.
The total cost includes licensing, infrastructure (if self-managed), and potentially certified Splunk admins or consultants. Some justify the cost because Splunk might replace multiple tools (logs, SIEM, etc.) with one platform.
SigNoz: Predictable and Scalable Costs
- Open Source: Free to run on your infrastructure
- SigNoz Cloud: Usage-based pricing
- Starting at $49/month
- Logs & traces: $0.30 per GB (15-day retention)
- Metrics: $0.10 per million samples (30-day retention)
- SigNoz Enterprise: Self-hosted with support, starting ~$4K/month
For comparison, 100 GB of logs in SigNoz would cost about $30, whereas in Splunk it could be hundreds of dollars. Because SigNoz uses efficient storage (ClickHouse), infrastructure costs may also be lower than Elasticsearch-based stacks for the same data volume.
This predictable cost model helps avoid the sudden budget spikes that can occur with Splunk's model when data volumes grow unexpectedly.
Processing 1 TB of logs daily could cost over $1.5M annually with Splunk, around $150K with Graylog Enterprise, and approximately $90K with SigNoz Cloud (or just infrastructure costs if self-hosted).
Performance and Scalability
Handling high log ingestion rates and large volumes is crucial, especially in cloud environments where microservices generate massive logs during peak loads.
Graylog: Proven at Scale with Proper Architecture
Graylog's performance is largely tied to its Elasticsearch backend. With proper tuning, it can handle substantial volumes:
- Real-world deployments report processing 1,600 log messages/sec with bursts up to 20,000/sec
- Deutsche Telekom ran Graylog for >1 TB/day across multiple data centers
- Search performance is excellent due to pre-indexing, with millisecond response times
Bottlenecks typically come from Elasticsearch (disk I/O, CPU for indexing) and memory for caching searches. Scaling involves adding more ES nodes or Graylog servers.
For cloud deployments, Graylog can leverage managed OpenSearch services and SSD storage. Using message queues (e.g., Kafka) as an ingest buffer helps smooth out traffic spikes.
Splunk: Enterprise-Grade with Resource Requirements
Splunk is engineered for enormous data volumes but requires substantial resources:
- Large enterprises run Splunk on clusters of dozens of servers
- One Splunk Cloud deployment indexes 2.5 TB/day using 39 indexers and 3 search heads
- Indexers can ingest hundreds of GB per day per node with sufficient CPU and SSDs
Splunk's SmartStore feature stores warm/cold data in S3, using local disks mainly for hot data. This improves scalability but can impact search speed on older data.
Running Splunk in Kubernetes can yield performance improvements—Splunk reports a 50% increase in ingestion per server for some indexers moved to K8s due to better resource utilization.
SigNoz: Modern Architecture for Efficiency
SigNoz leverages ClickHouse, a distributed columnar database optimized for analytics:
- Benchmark tests show SigNoz ingesting logs 2.5× faster than ELK stacks while using 50% fewer resources
- Query performance for aggregations is significantly faster than Elasticsearch
- Architecture is fully horizontal: add more ingest pods or ClickHouse nodes to scale
SigNoz can buffer data via Kafka to handle traffic spikes and uses backpressure to avoid being overwhelmed. It also offers retention control and tiered storage—configuring how long to keep high-resolution data and archiving older logs to cheaper storage.
While it may not yet have decades of tuning like Splunk in ultra-large deployments, SigNoz's technology stack is fundamentally scalable and resource-efficient—a good fit for cloud-native workloads where you want to maximize performance per CPU/dollar.
User Experience and Interface
A tool's usability is crucial for quickly finding insights from logs. Each platform offers a distinct experience:
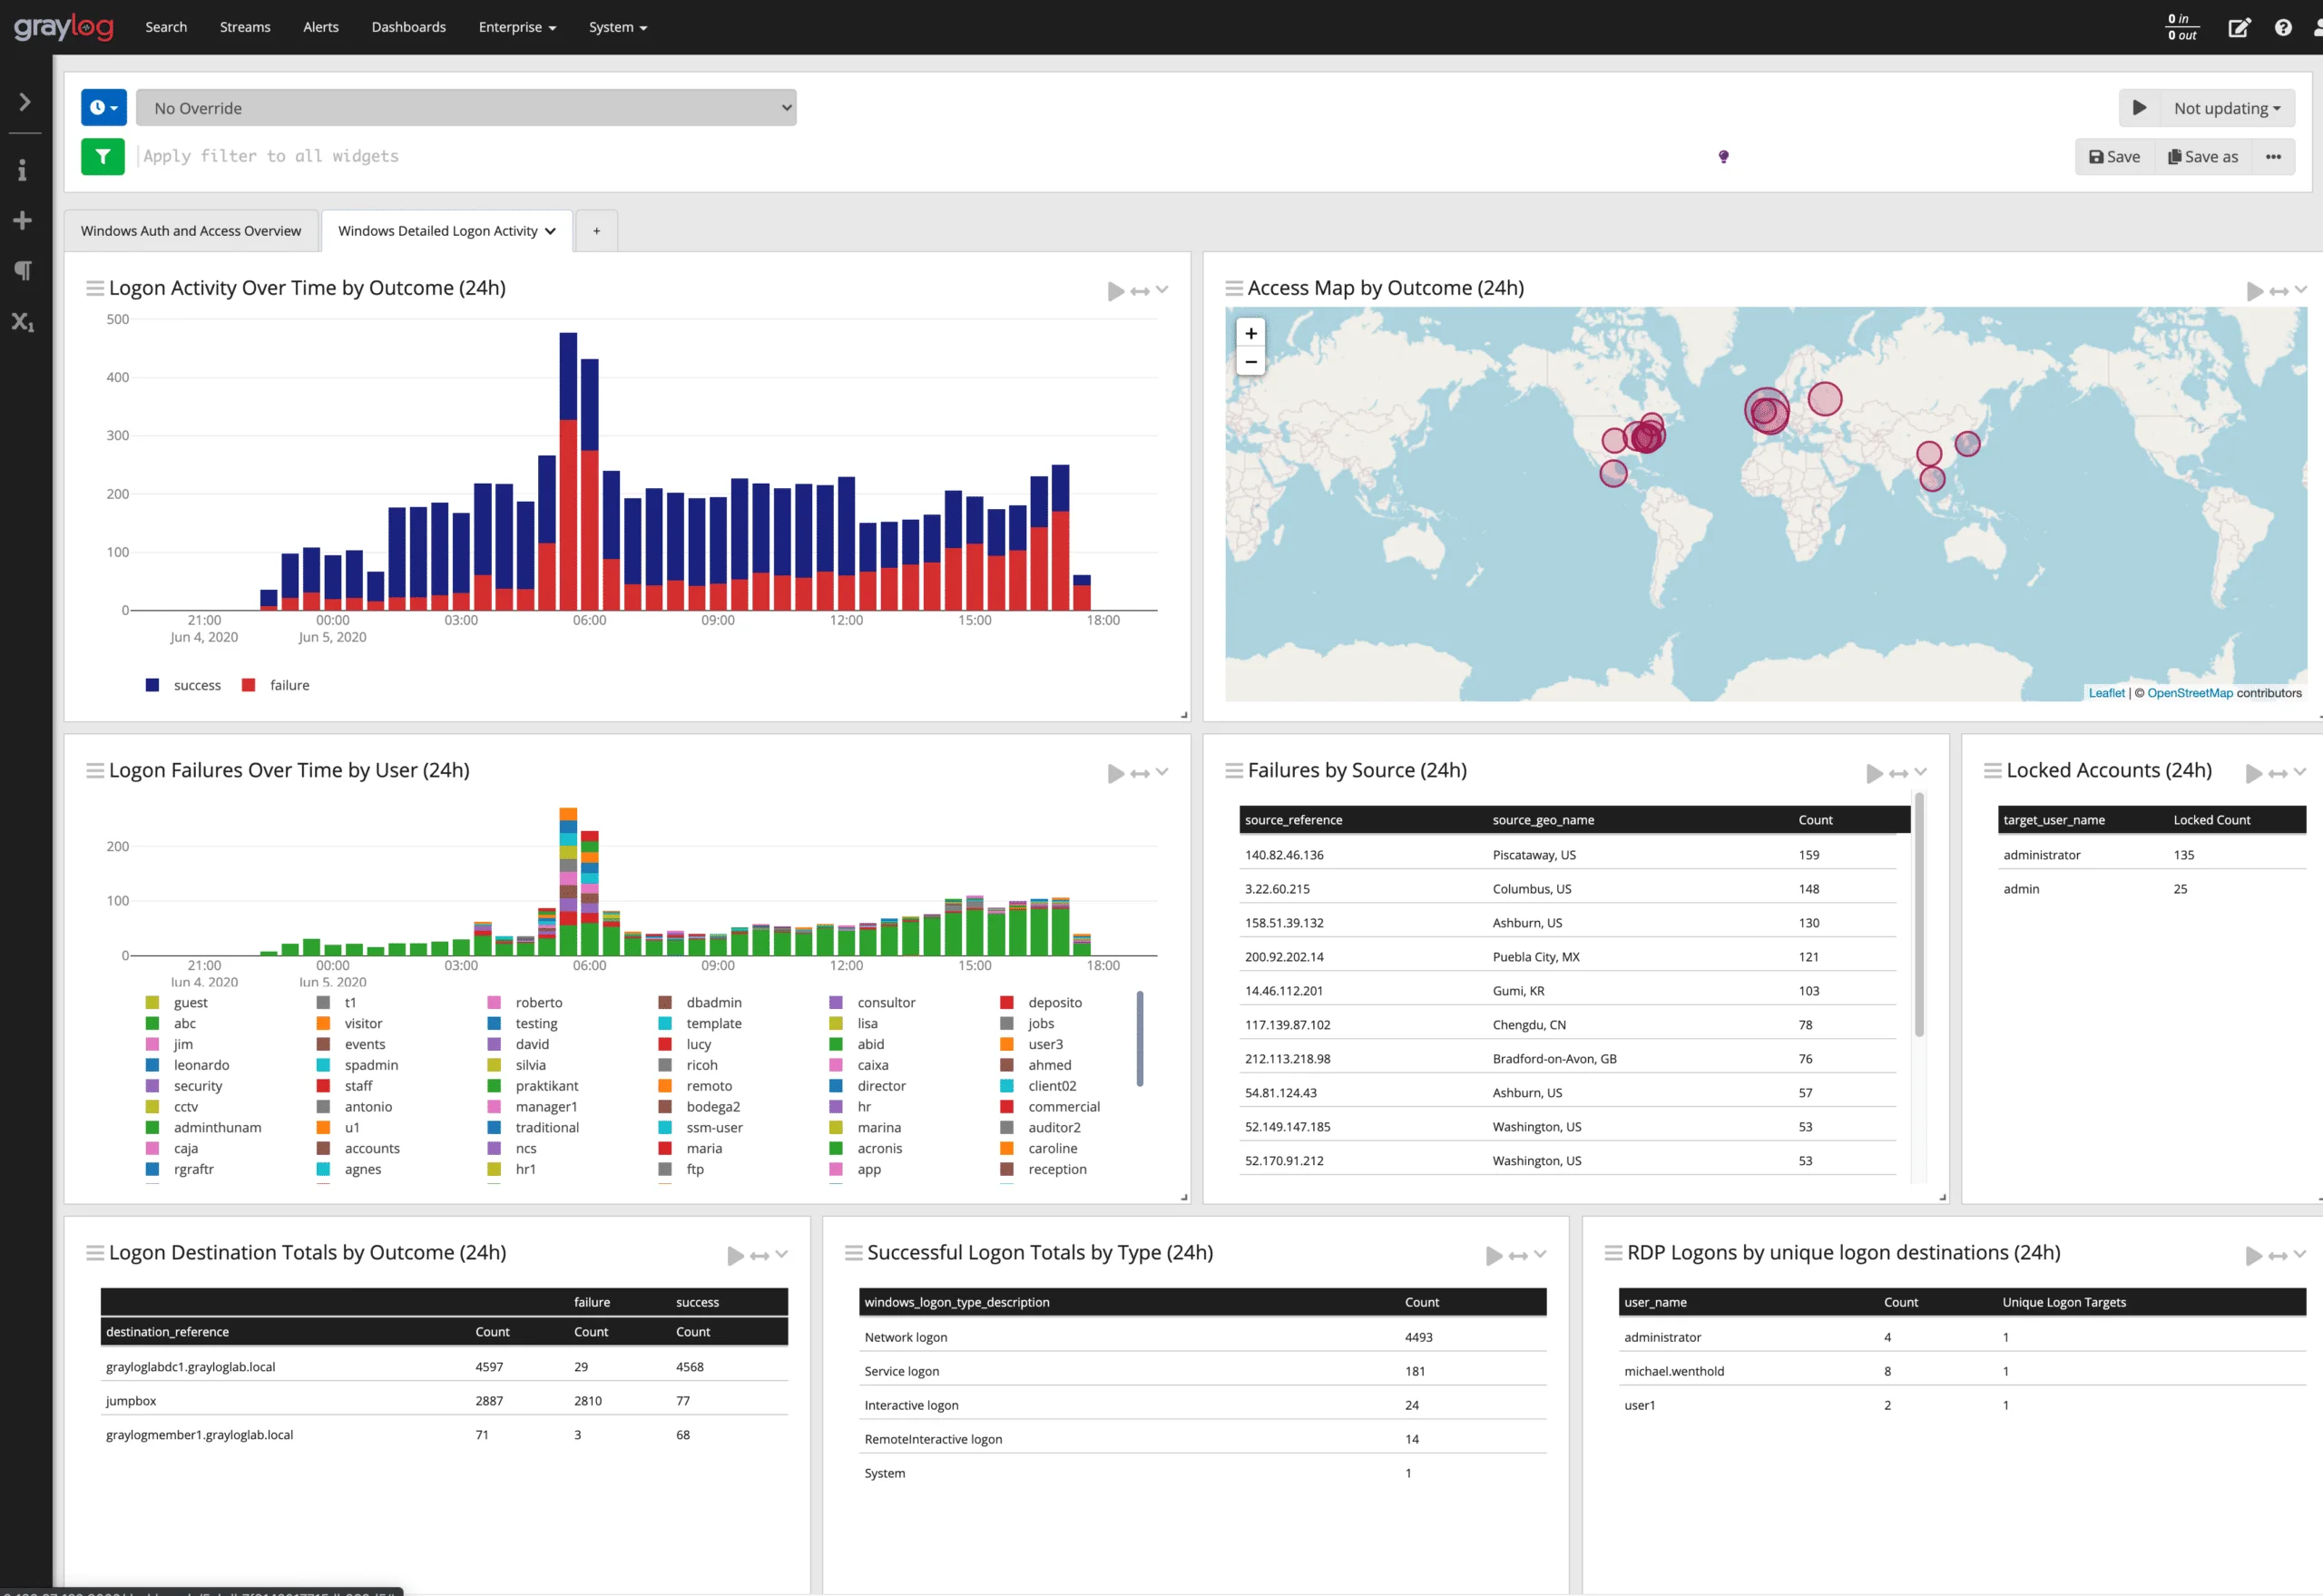
Graylog UI: Simple and Focused
Graylog provides a clean, minimalist interface centered on log data:
- Dashboard-Oriented: View streams of log messages, search results, and widgets
- Search-Focused: Point-and-click creation of searches and filters, or direct Lucene queries
- Collaboration Features: Sharing saved searches and dashboards among team members
The UI emphasizes quick access to search and analysis functions. Users can define streams (filtered views of logs) and create dashboards with charts for metrics like log volume or error codes.
Graylog's interface for alert management is straightforward—configure conditions and notifications in a form-based UI. While less dynamic than Splunk, many users appreciate its uncluttered experience and the fact that basic keyword searches work without learning a proprietary query language.
Splunk UI: Powerful but Complex
Splunk offers a feature-rich interface with extensive customization:
- Search-Centric: The search bar for SPL queries is central to the experience
- Rich Visualizations: Build dashboards with charts, maps, tables, and drill-down capabilities
- App Ecosystem: Different Splunk apps provide specialized interfaces (e.g., security dashboards)
Splunk's Dashboard Studio lets you place UI components freely and apply custom HTML/CSS if needed. This flexibility enables advanced analytics portals but contributes to a steep learning curve.
Navigation can be confusing initially with many screens (search, dashboards, alerts, settings, apps) and sub-menus. However, experienced users become efficient with features like saved searches, time range pickers, and field explorers.
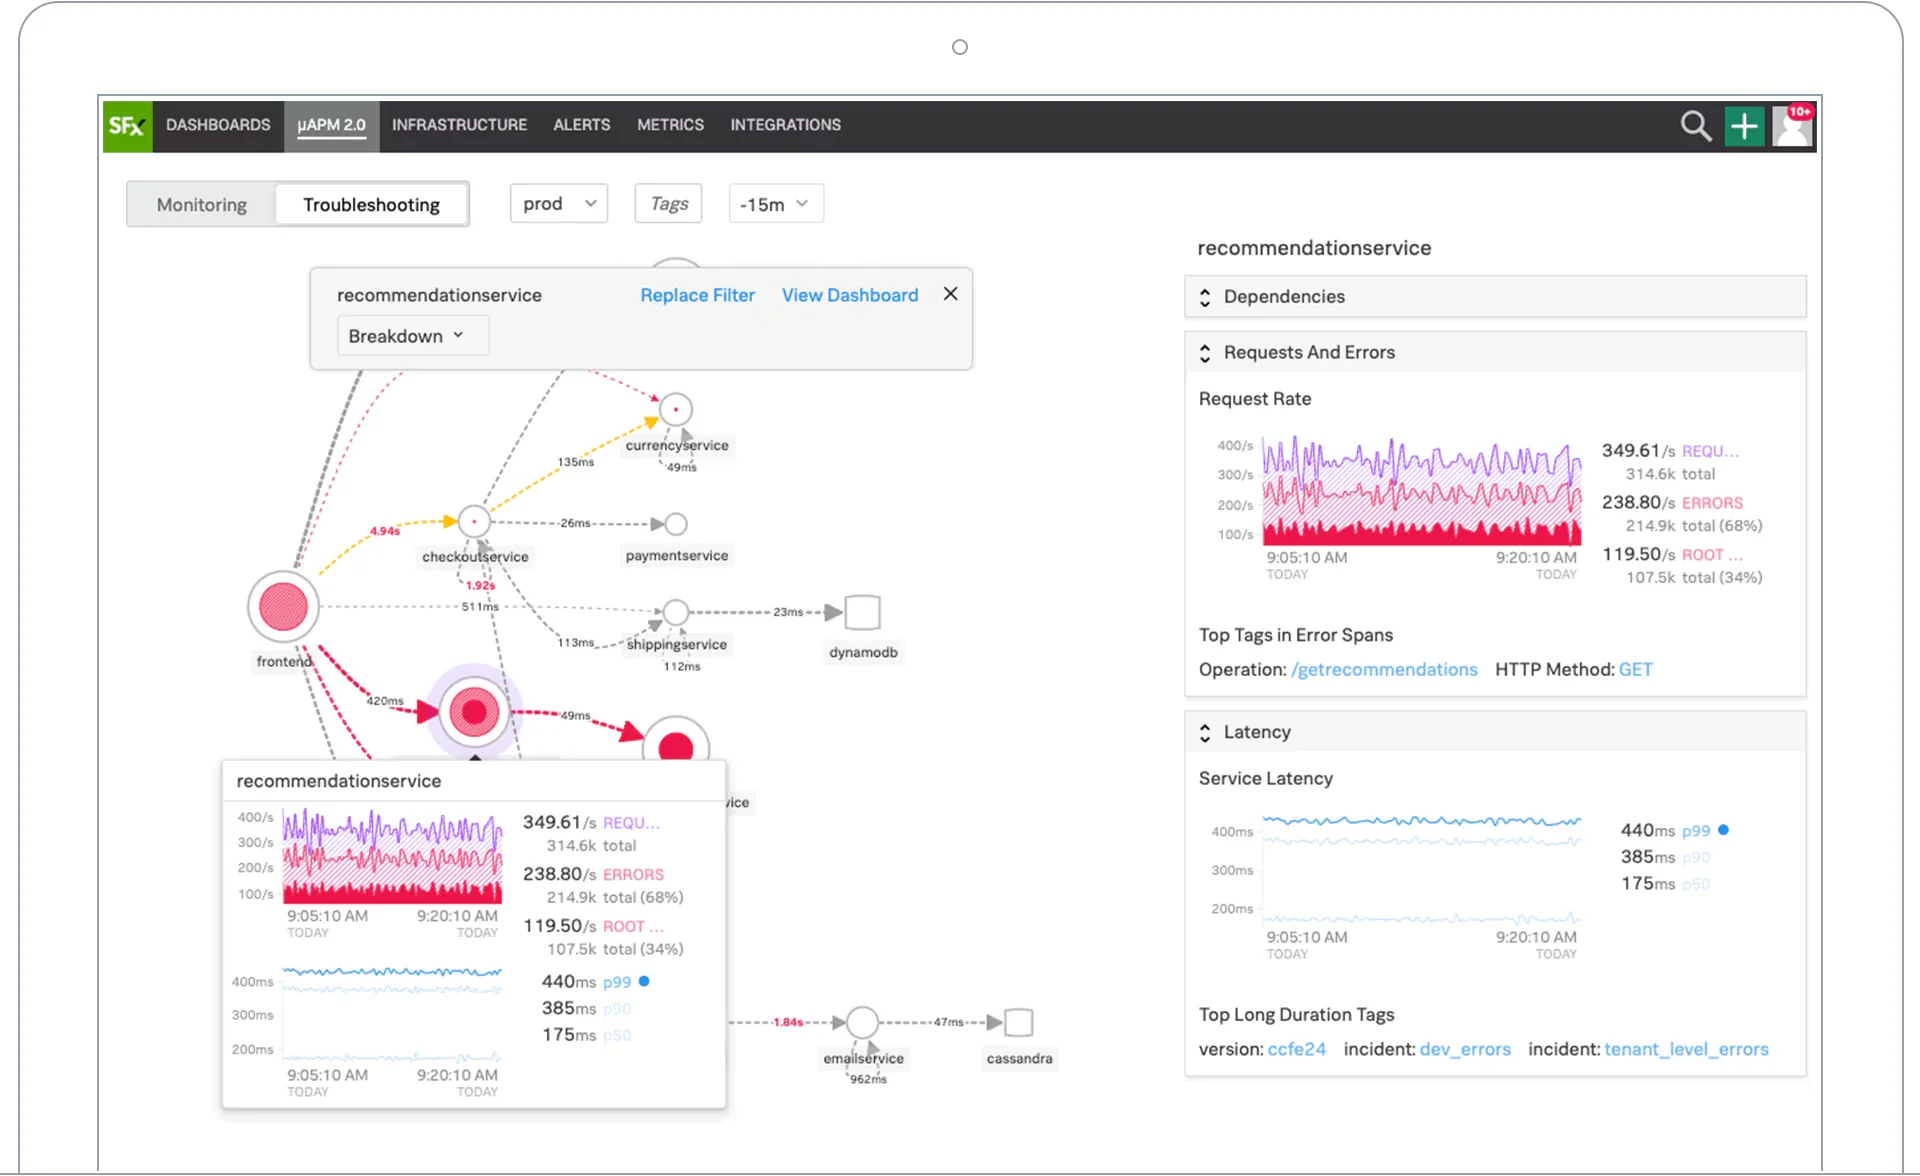
SigNoz UI: Modern and Integrated
SigNoz features a developer-friendly interface that unifies logs, metrics, and traces:
- Unified Navigation: Easily jump from metrics to related logs or from traces to error logs
- Pre-Built Visualizations: Flame graphs and timeline charts for tracing, dashboards for metrics
- Intuitive Filtering: Log view with field filtering, full-text search, and structured log support
The UI emphasizes reducing clicks to reach relevant data. For example, you might spot a spike in error rates on a dashboard, drill down to the trace of a failing request, and then view the exact error log—all within the same interface.
New users find SigNoz easier to learn because it doesn't require a proprietary query language for basic use. The interface continues to evolve rapidly with community contributions focusing on usability improvements.
Graylog offers a straightforward, no-frills experience for log analysis. Splunk provides powerful but complex tools requiring training. SigNoz delivers a modern, integrated approach that connects logs with metrics and traces for faster troubleshooting.
SigNoz vs. Graylog and Splunk for Cloud-Native Applications
In cloud-native contexts, SigNoz positions itself as a more comprehensive and modern alternative to traditional log managers.
SigNoz vs. Graylog
The primary difference is scope—SigNoz is a full observability platform (logs, metrics, and traces) whereas Graylog focuses on log management:
Advantages of SigNoz:
- Unified telemetry eliminates the need for separate tools (Prometheus, Jaeger, etc.)
- Built for Kubernetes with minimal setup (Helm charts)
- More resource-efficient storage with ClickHouse
- Native OpenTelemetry support for standardized instrumentation
Where Graylog Shines:
- Mature plugin ecosystem for custom inputs, outputs, and processing
- More specialized log parsing and transformation capabilities
- Better security/SIEM features in Enterprise version
- Established community and documentation
For teams primarily focused on logs with separate systems for metrics/tracing, Graylog remains solid. But for a unified, cloud-native observability stack, SigNoz offers broader functionality out of the box.
SigNoz vs. Splunk
SigNoz challenges Splunk on several fronts important to cloud-native users:
Advantages of SigNoz:
- Dramatically lower cost (open-source or usage-based pricing)
- Built on open standards (OpenTelemetry) to avoid vendor lock-in
- Unified UI for metrics, traces, and logs without multiple products
- Lightweight deployment on Kubernetes
Where Splunk Excels:
- Battle-tested at extreme scale (multi-terabyte deployments)
- Extensive feature set developed over 15+ years
- Rich ecosystem of pre-built content and integrations
- Enterprise-grade compliance and security features
Splunk's high cost at scale is a significant pain point that SigNoz addresses. For many cloud-native teams, SigNoz provides the visibility they need while saving substantially on costs. However, organizations with specialized requirements or existing Splunk investments might still prefer Splunk's mature ecosystem.
When to Choose Each Tool
Choose Graylog When:
- You need cost-effective log management with open-source flexibility
- Your team has technical expertise to manage Elasticsearch/OpenSearch
- Log management is your primary focus (rather than full observability)
- You have moderate log volumes or are scaling gradually
- You want a balance of features and simplicity
Choose Splunk When:
- Budget is less constrained and you need enterprise-grade features
- You require advanced security analytics and SIEM capabilities
- Your organization handles massive data volumes (multi-TB/day)
- You need extensive compliance reporting and certified security
- You value a mature ecosystem with pre-built content for various use cases
Choose SigNoz When:
- You're building or operating cloud-native, containerized applications
- You want unified observability (logs, metrics, traces) in one tool
- Cost efficiency is important, especially as data volumes grow
- You prefer open standards like OpenTelemetry to avoid vendor lock-in
- Your team values modern UI and integrated troubleshooting workflows
Key Takeaways
- Graylog offers focused log management with an open-source core, making it cost-effective but requiring technical expertise to scale.
- Splunk provides comprehensive data analytics with powerful features but comes with high costs and complexity.
- SigNoz delivers unified observability for cloud-native applications, combining logs, metrics, and traces with modern architecture and reasonable costs.
- For cloud-native environments, consider your scale, budget, and need for integrated observability when choosing between these tools.
- The most cost-effective approach for large-scale deployments is typically self-hosted open-source (Graylog or SigNoz), but this requires operational expertise.
FAQ
Can Graylog match Splunk in scalability?
While Graylog can handle multi-terabyte workloads, it requires careful architecture and tuning. Real-world deployments process over 1 TB/day, but Splunk may have an edge for extreme-scale enterprise deployments due to its purpose-built indexing technology.
Which tool is better for security monitoring?
Splunk excels in security monitoring with its advanced SIEM features, machine learning capabilities, and extensive security content library. Graylog Enterprise offers security monitoring features, but Splunk's security ecosystem is more mature. SigNoz currently focuses more on application performance than security analytics.
Is SigNoz mature enough for production use?
Yes, SigNoz is production-ready for most organizations. As a CNCF project with active development, it has a growing user base running it in production. While newer than Graylog or Splunk, its modern architecture and focus on cloud-native environments make it well-suited for contemporary applications.
How do these tools handle container logs in Kubernetes?
All three can collect Kubernetes logs, but with different approaches:
- Graylog: Typically uses Filebeat or Fluentd to collect container logs
- Splunk: Offers a Kubernetes monitoring solution with dedicated forwarders
- SigNoz: Native integration with OpenTelemetry collectors for Kubernetes
SigNoz has the most cloud-native approach, with Helm charts for deployment and built-in understanding of Kubernetes concepts.
What's the learning curve for each platform?
Graylog has a moderate learning curve with its straightforward interface and Lucene-based queries. Splunk has the steepest learning curve due to its SPL language and feature complexity. SigNoz offers the gentlest learning curve for teams familiar with modern observability tools, with an intuitive UI and standard query languages.
