Top LogicMonitor Alternatives in 2026
LogicMonitor is a popular IT monitoring platform that offers comprehensive infrastructure visibility. However, no single monitoring solution works best for everyone. Your specific needs, budget, and technical requirements might make other options more suitable for your business.
This guide compares the top LogicMonitor alternatives for 2026, helping you choose the right monitoring tool for your needs.
For developers and SREs: SigNoz and Prometheus+Grafana are top open-source alternatives with full observability capabilities. For enterprises, Datadog offers 750+ integrations and unified monitoring, while Dynatrace provides AI-powered automation. New Relic's usage-based pricing (with 100GB free) works well for growing teams, and specialized tools like Splunk excel at log analytics and security monitoring.
Why People Look for LogicMonitor Alternatives
LogicMonitor is a cloud-based IT infrastructure monitoring and analytics platform that provides businesses with real-time insights into the health and performance of their IT systems. It offers comprehensive monitoring across hybrid environments, including on-premises infrastructure, cloud services, and applications, all through an agentless, automated platform.
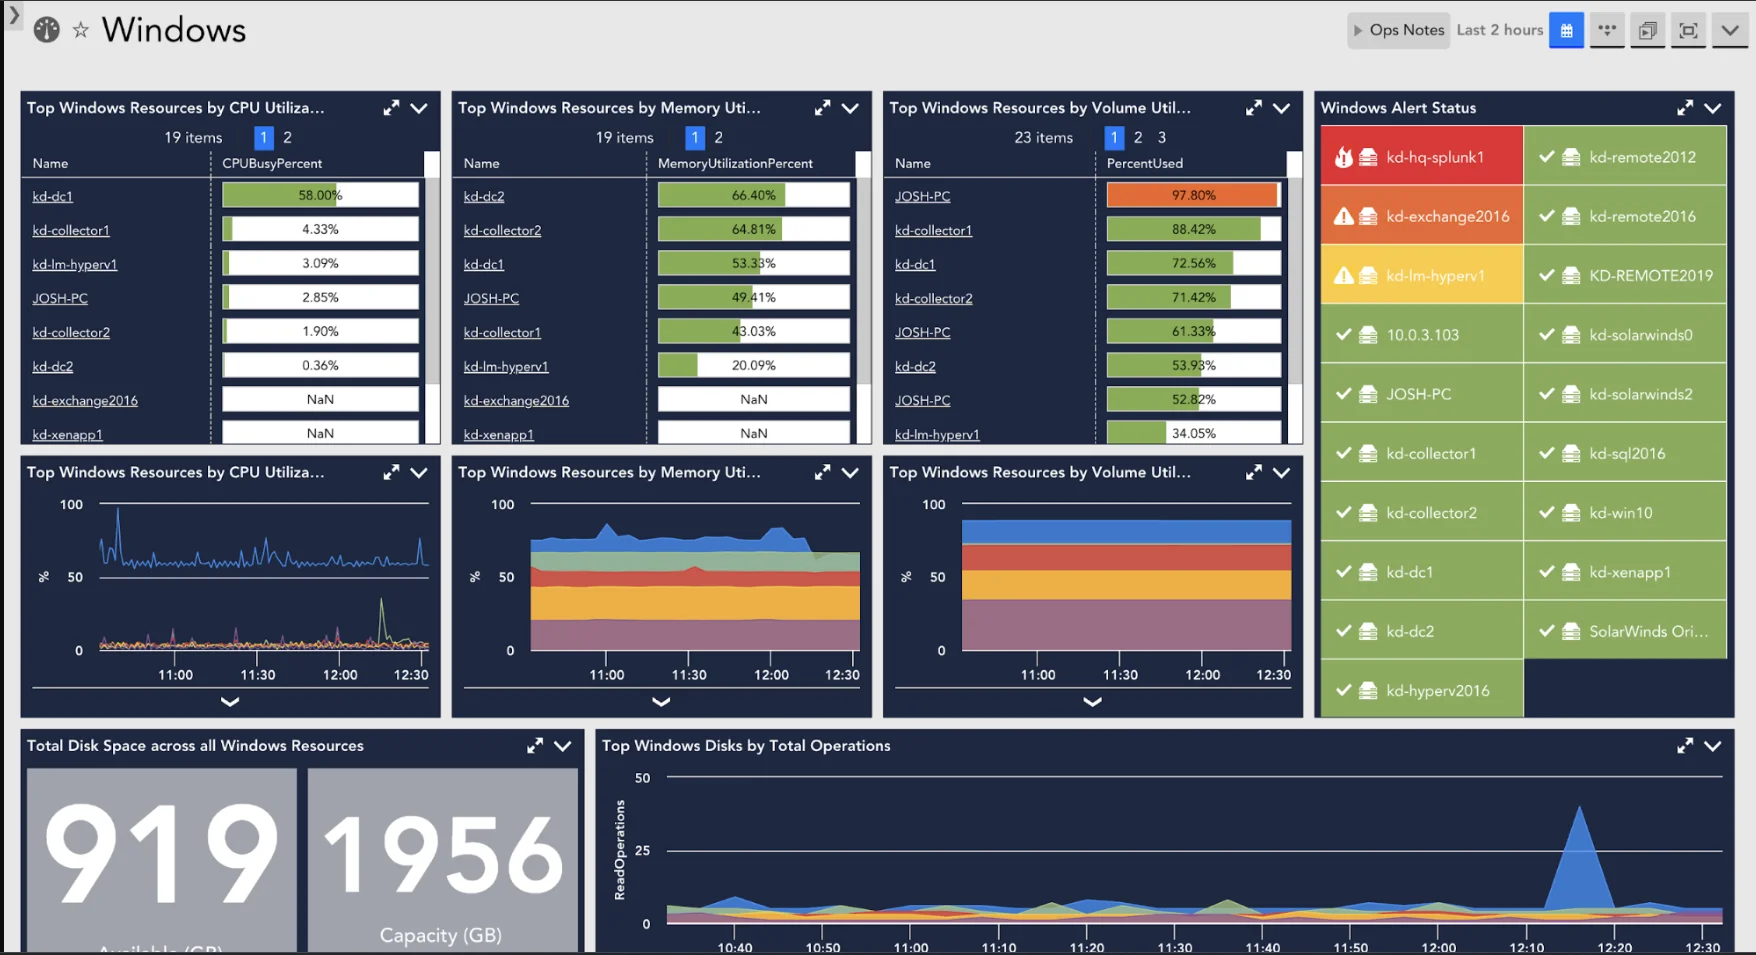
While LogicMonitor is a comprehensive IT infrastructure monitoring solution, some organizations seek alternatives due to specific limitations or requirements:
Cost Issues:
- High enterprise licensing fees, especially as you grow
- Fixed pricing instead of pay-per-use options
- Hidden costs for add-ons and premium features
- Lack of pricing transparency (often requiring sales contact with no free trial)
Technical Limitations:
- Struggles with very large or complex environments
- Difficult integration with hybrid cloud setups
- Missing advanced features available in other tools
- Limited support for modern cloud-native applications and Kubernetes
User Experience Problems:
- Complex interface for new users
- Steep learning curve without proper training
- Incomplete documentation for troubleshooting
- Dashboards that aren't as customizable as some alternatives
Business Concerns:
- Slow support response for critical issues
- Limited availability in some regions
- Incomplete compliance with industry standards like HIPAA and GDPR
Top LogicMonitor Competitors
Let's examine each alternative to help you find the best monitoring solution for your needs.
SigNoz
SigNoz is an open-source observability platform built on OpenTelemetry. It combines logs, metrics, and traces in a single dashboard. Unlike paid tools, you can host it yourself, saving money while keeping complete control of your data.
Key Benefits:
- Free Open-Source Option: Get enterprise features like distributed tracing without the high cost
- Easy Integration: Works natively with OpenTelemetry for simple setup
- Flexible Deployment: Run in the cloud or on your own servers
- No Per-Host Fees: Usage-based pricing model is more predictable for containerized environments
Performance:
- Uses ClickHouse database for fast data storage and retrieval
- Monitors system and application performance in real-time
- Provides unified UI for metrics, traces, and logs with advanced filtering
- Supports real-time application performance insights with root-cause analysis
Limitations:
- Requires some knowledge of OpenTelemetry
- Setup and maintenance effort needed if self-hosting
Pricing:
- Free self-hosted community edition
- Cloud SaaS from ~$49/month (usage-based)
- Logs $0.30/GB, metrics $0.10 per 1M samples (15-30 day retention)
Best For: Organizations seeking unified observability with OpenTelemetry and complete control over their monitoring data, especially cost-conscious teams
Datadog
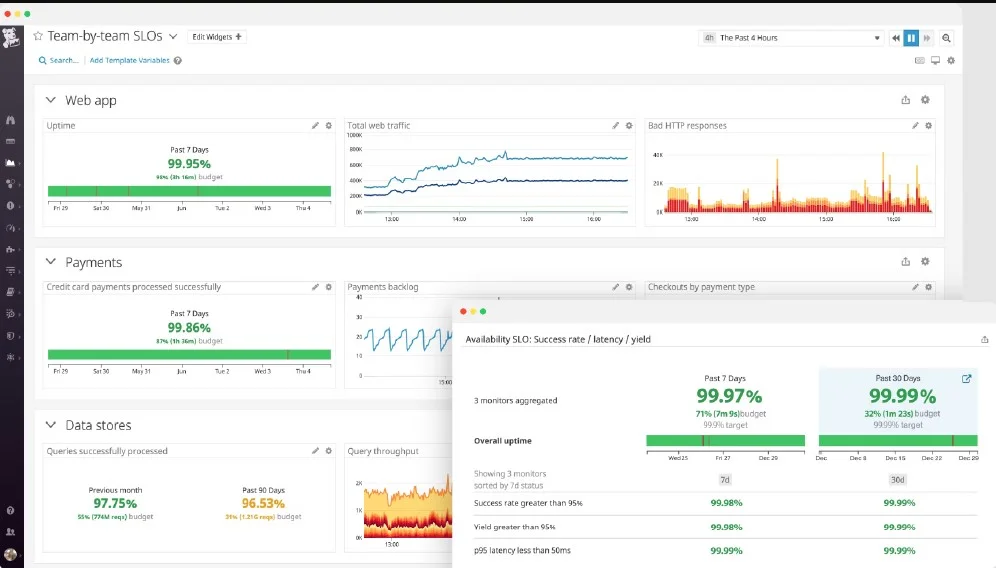
Datadog is a cloud-based platform that monitors infrastructure, analyzes security, and manages logs. With over 750 integrations and AI-powered anomaly detection, it's popular for complex environments.
Key Benefits:
- Complete Monitoring: Watches cloud, on-premises, and hybrid environments
- AI Insights: Uses machine learning to reduce false alarms
- Highly Scalable: Handles large cloud environments with ease
- Unified Platform: Combines metrics, traces, logs, and security in one solution
Performance:
- Provides security monitoring with threat detection
- Tracks compliance with regulations
- Offers polished dashboards for quick insights
- Single agent covers many monitoring needs
- Strong support for Kubernetes and cloud-native applications
Limitations:
- Costs increase quickly as you add data and integrations
- Per-host pricing can be expensive for microservices
- Complex pricing model can lead to unexpected charges
- Data is hosted in vendor's cloud, which may not meet strict governance requirements
Pricing:
- Free tier (up to 5 hosts)
- Pro ~$15/host/month (annual) for core features
- Enterprise ~$23/host with advanced AI and 15-month retention
- Additional costs for log volume and APM
Best For: Enterprise teams managing multi-cloud architectures who need a comprehensive, integrated monitoring solution
New Relic
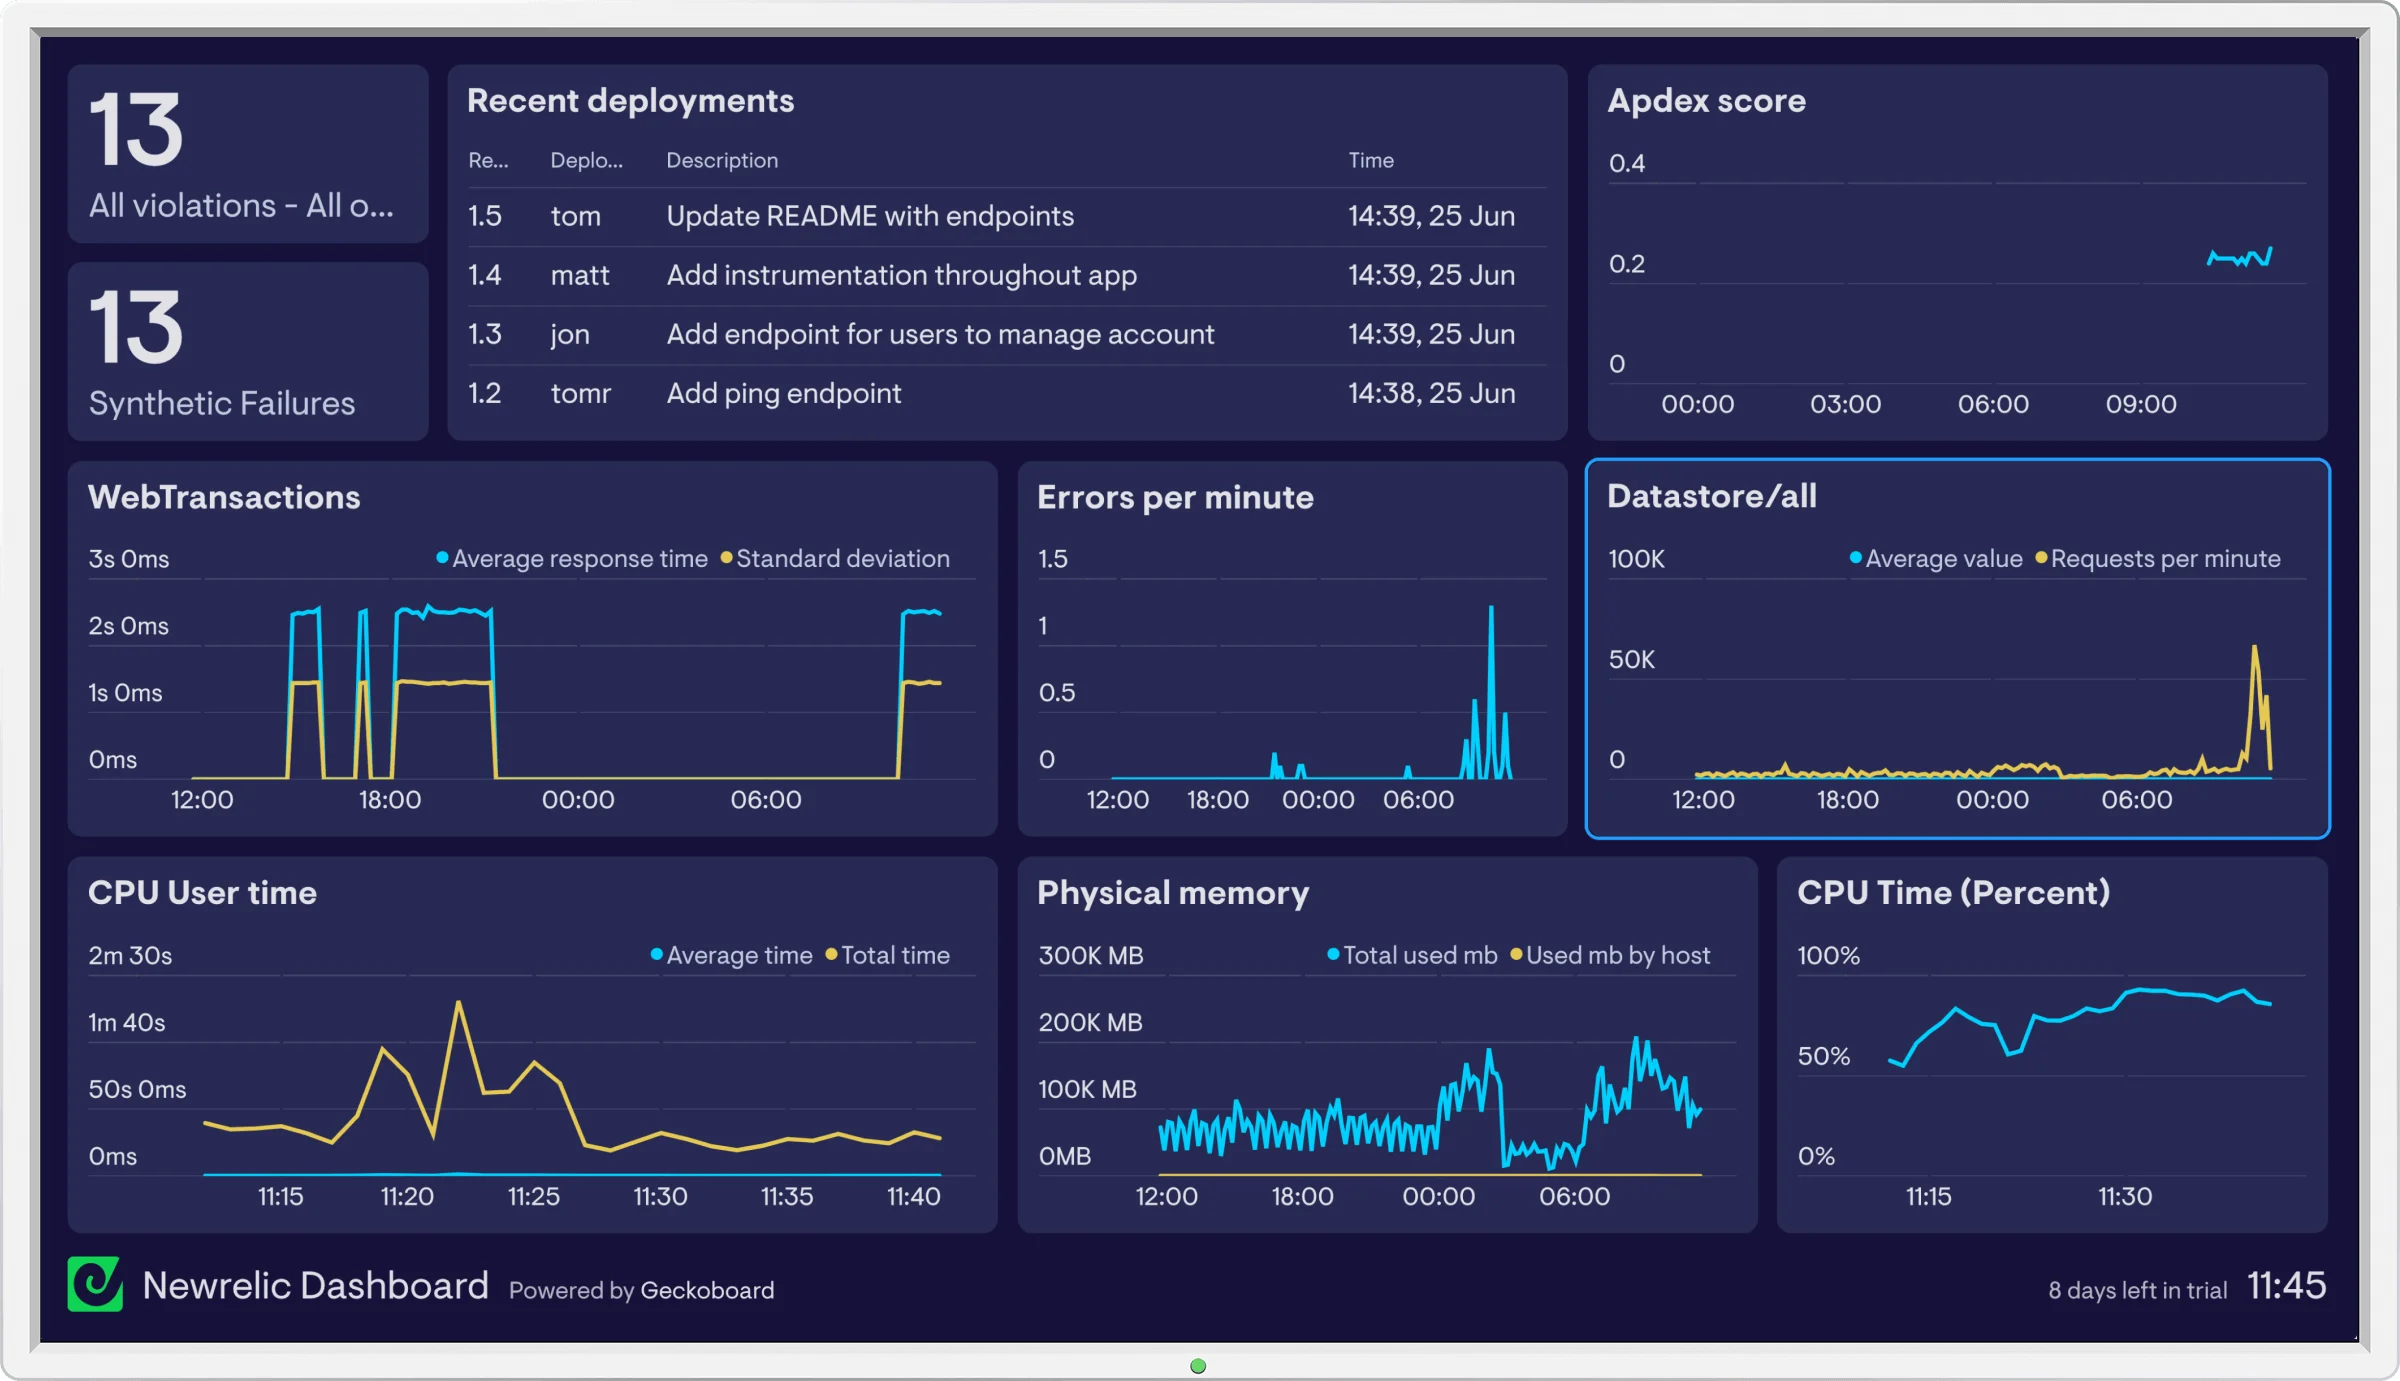
New Relic specializes in application performance monitoring (APM), providing insights into code execution, user experience, and system health. Used by over 15 million developers, it helps identify performance bottlenecks.
Key Benefits:
- Deep Application Insight: Tracks performance from backend to frontend
- Real-Time Data: Shows performance issues as they happen
- Works Everywhere: Integrates with many technologies and environments
- Developer-Friendly: Offers intuitive visualizations and custom queries (NRQL)
Performance:
- Uses AI to detect unusual patterns automatically
- Alerts teams to problems before customers notice
- Auto-instruments many languages with minimal configuration
- Correlates logs with traces and metrics for faster troubleshooting
- Supports OpenTelemetry data ingestion
Limitations:
- Pricing increases with usage, especially for large companies
- Learning curve for full-stack monitoring features
- Per-user fees can make it expensive for large teams
- Interface can feel busy given the breadth of features
Pricing:
- Free tier (100 GB/month, 1 user)
- Usage-based at $0.30 per GB of data beyond free limit
- Additional costs for user licenses
Best For: DevOps teams focused on application performance who need a balance of depth and ease of use
Dynatrace
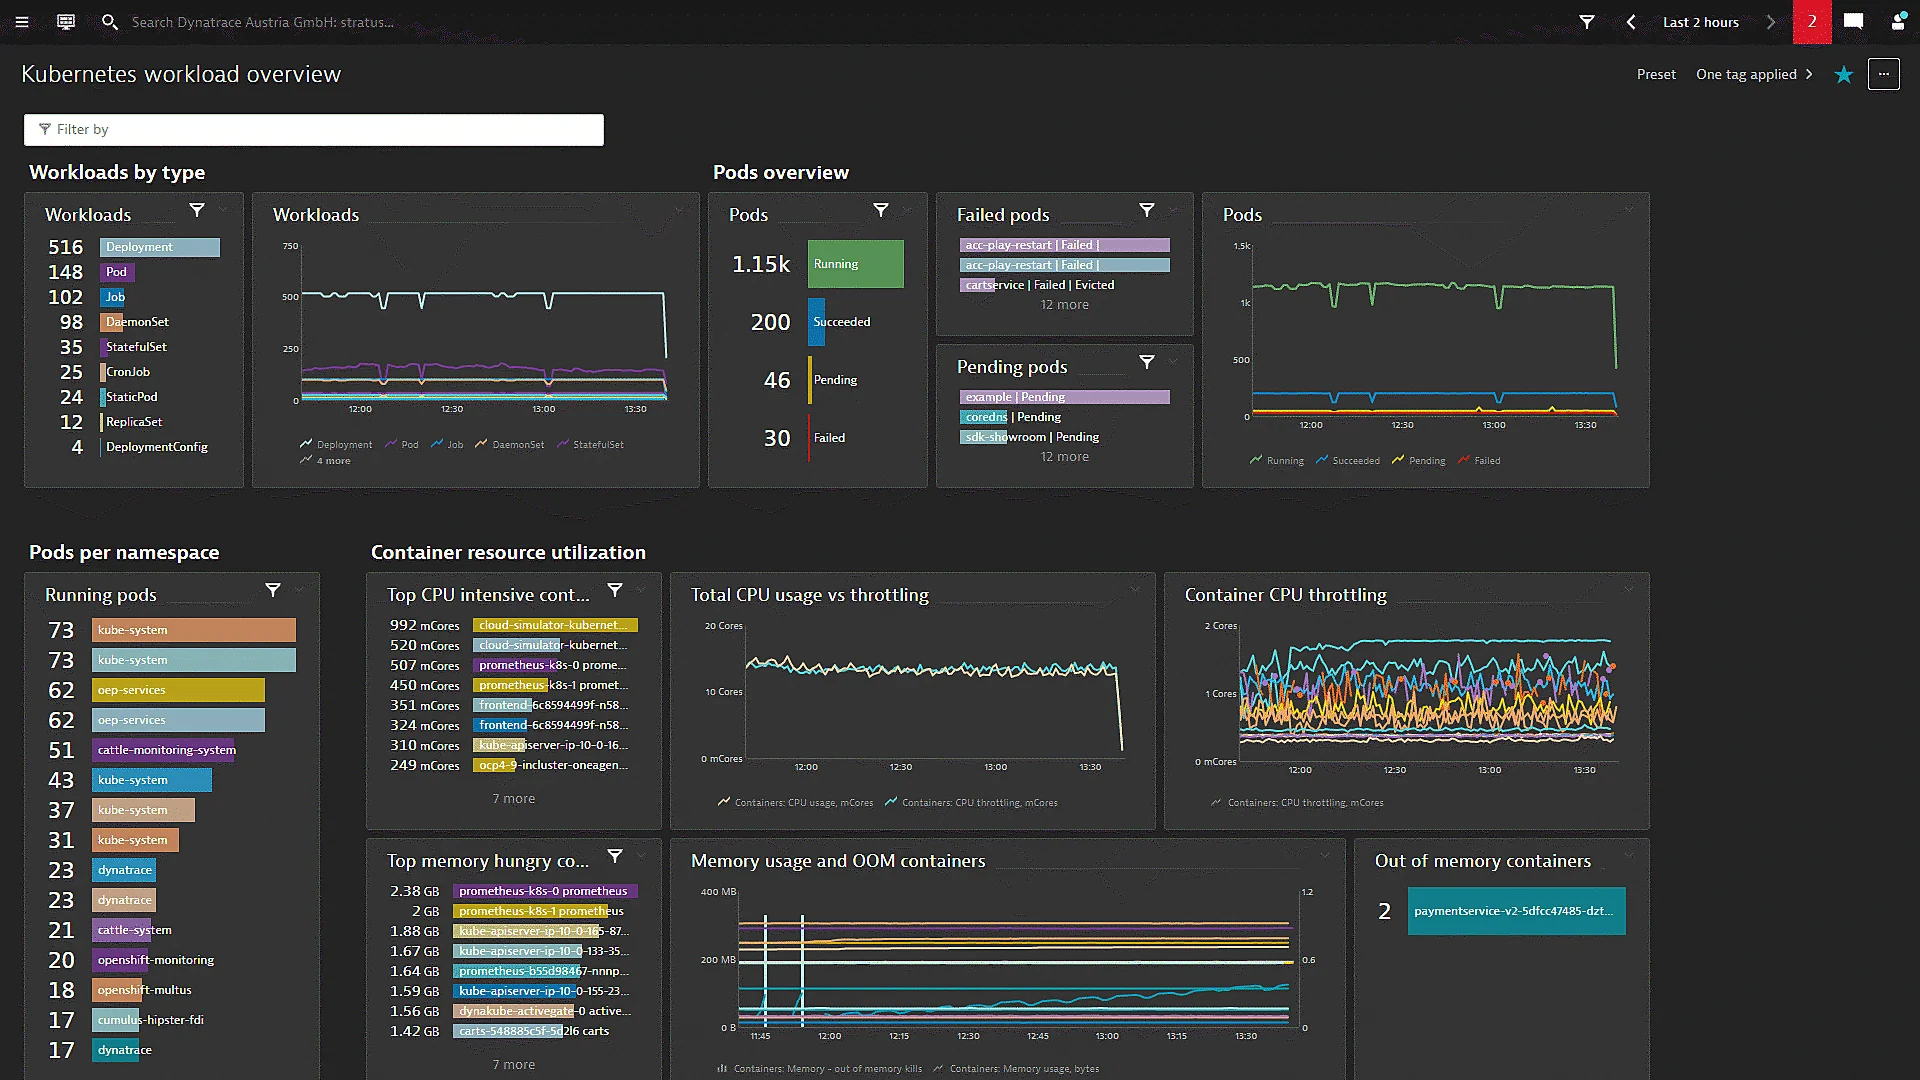
Dynatrace is an advanced APM solution that uses AI to monitor applications, infrastructure, and user experience. It helps enterprises ensure optimal performance through automated root cause analysis.
Key Benefits:
- AI-Powered Analysis: Automatically finds the root cause of problems with Davis AI
- End-to-End Visibility: Monitors everything from user experience to backend systems
- Automatic Mapping: Shows how all your applications connect to each other (Smartscape)
- Built for Cloud: Works well with modern cloud environments including Kubernetes and serverless
Performance:
- Reduces time to detect and fix problems through AI analysis
- Handles complex enterprise environments
- PurePath provides end-to-end code-level tracing for every transaction
- Autodiscovers and maps dependencies in real time
- Excels in cloud-native environments
Limitations:
- Requires training to use advanced features
- Premium pricing not ideal for smaller organizations
- Can feel heavyweight with numerous features
- Less flexible for ad-hoc open-source integrations
Pricing:
- Usage-based pricing (pay-as-you-go): ~$0.08 per hour per 8GiB host for full-stack monitoring
- Custom pricing for enterprise
- Overall higher cost tier but includes advanced automation
Best For: Large enterprises in e-commerce, financial services, and cloud-native organizations that need automated, AI-driven monitoring
Zabbix
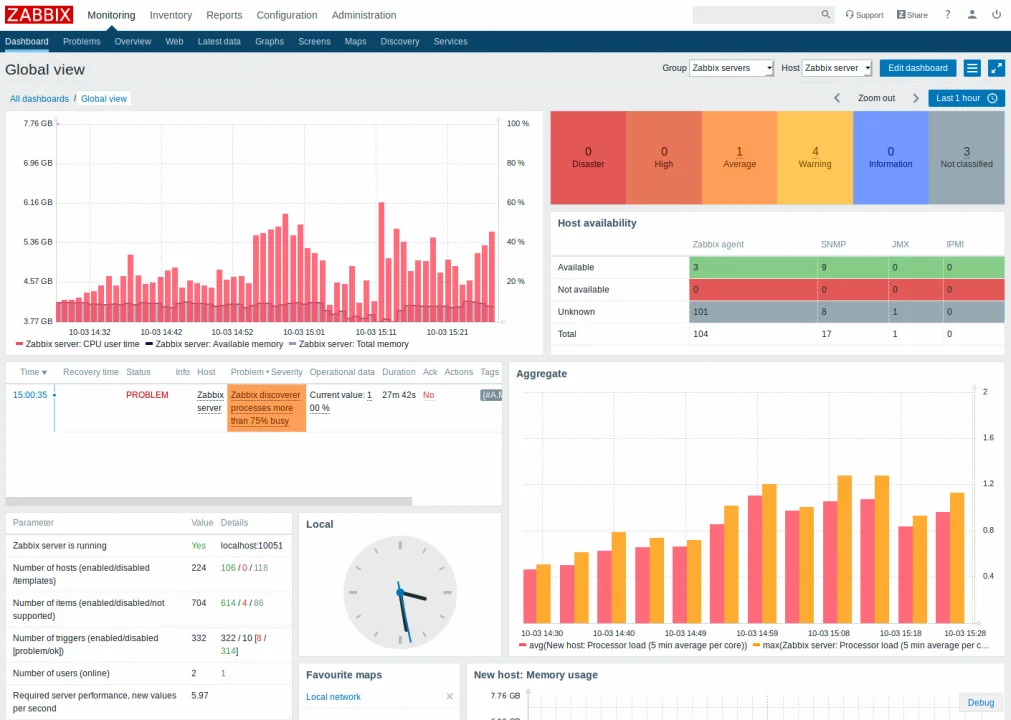
Zabbix is an open-source tool for monitoring IT infrastructure, including servers, applications, and networks. It offers over 400 built-in templates for monitoring different systems.
Key Benefits:
- Free to Use: No licensing fees makes it budget-friendly
- Comprehensive Coverage: Monitors networks, servers, applications, and cloud
- Highly Customizable: Adapts to your specific monitoring needs
- Flexible Deployment: Can be installed on-premises or in the cloud
Performance:
- Stores long-term data for trend analysis
- Automates actions based on triggers you define
- Supports distributed monitoring with proxies
- Handles basic server, network, and service monitoring efficiently
Limitations:
- Requires significant setup for complex environments
- Steeper learning curve than some alternatives
- Focuses on infrastructure and basic application checks
- Limited APM capabilities compared to specialized tools
Pricing:
- Free open-source (costs only for hardware and maintenance)
- Commercial support available separately
Best For: Organizations wanting a customizable, free monitoring solution for infrastructure and basic application monitoring
PRTG Network Monitor
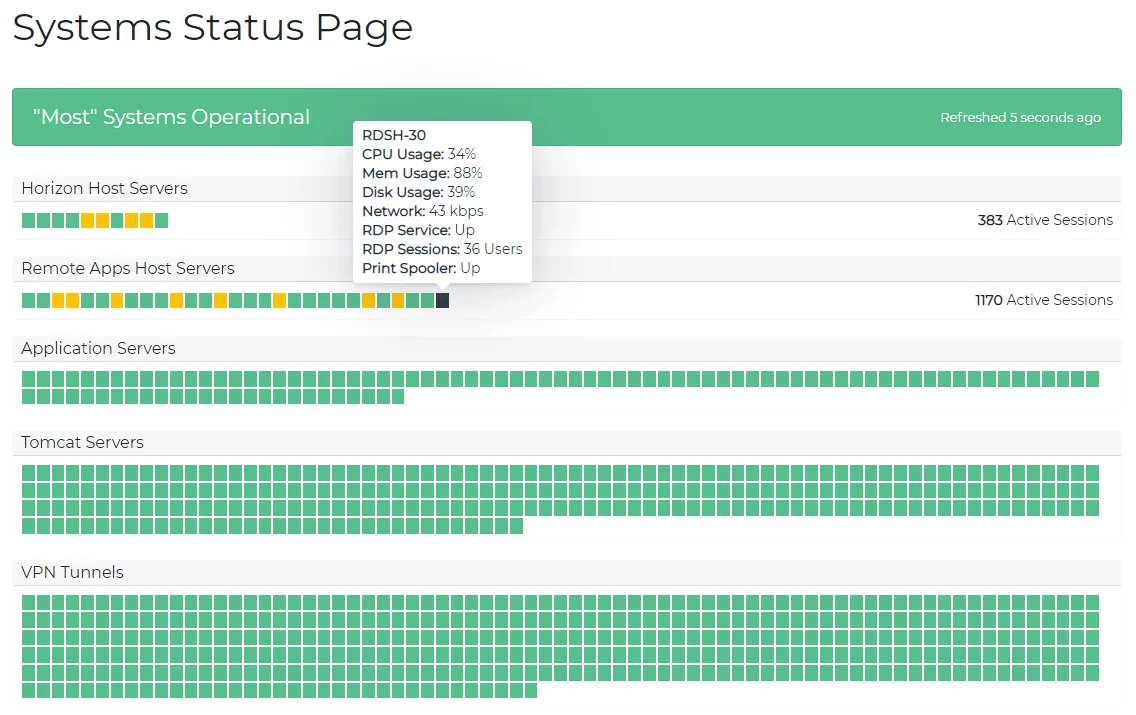
PRTG Network Monitor is a comprehensive solution for network, IT infrastructure, and service monitoring. It shows real-time network health to help you detect and fix issues before they affect operations.
Key Benefits:
- All-in-One Solution: Monitors network devices, servers, and virtual environments
- Custom Alerts: Notifies you based on thresholds you set
- Easy to Use: Features simple setup and user-friendly interface
- Unified View: Provides a single dashboard for all monitored components
Performance:
- Provides real-time visibility into network health
- Detects issues before they impact operations
- Offers detailed migration guides from other tools
- Includes sensors for various technologies and protocols
Limitations:
- May need extra configuration for advanced use
- Can be resource-intensive when monitoring many devices
- Less focused on application-level monitoring
- Limited cloud-native and container monitoring
Best For: IT teams in businesses of all sizes needing easy-to-use network monitoring
Splunk
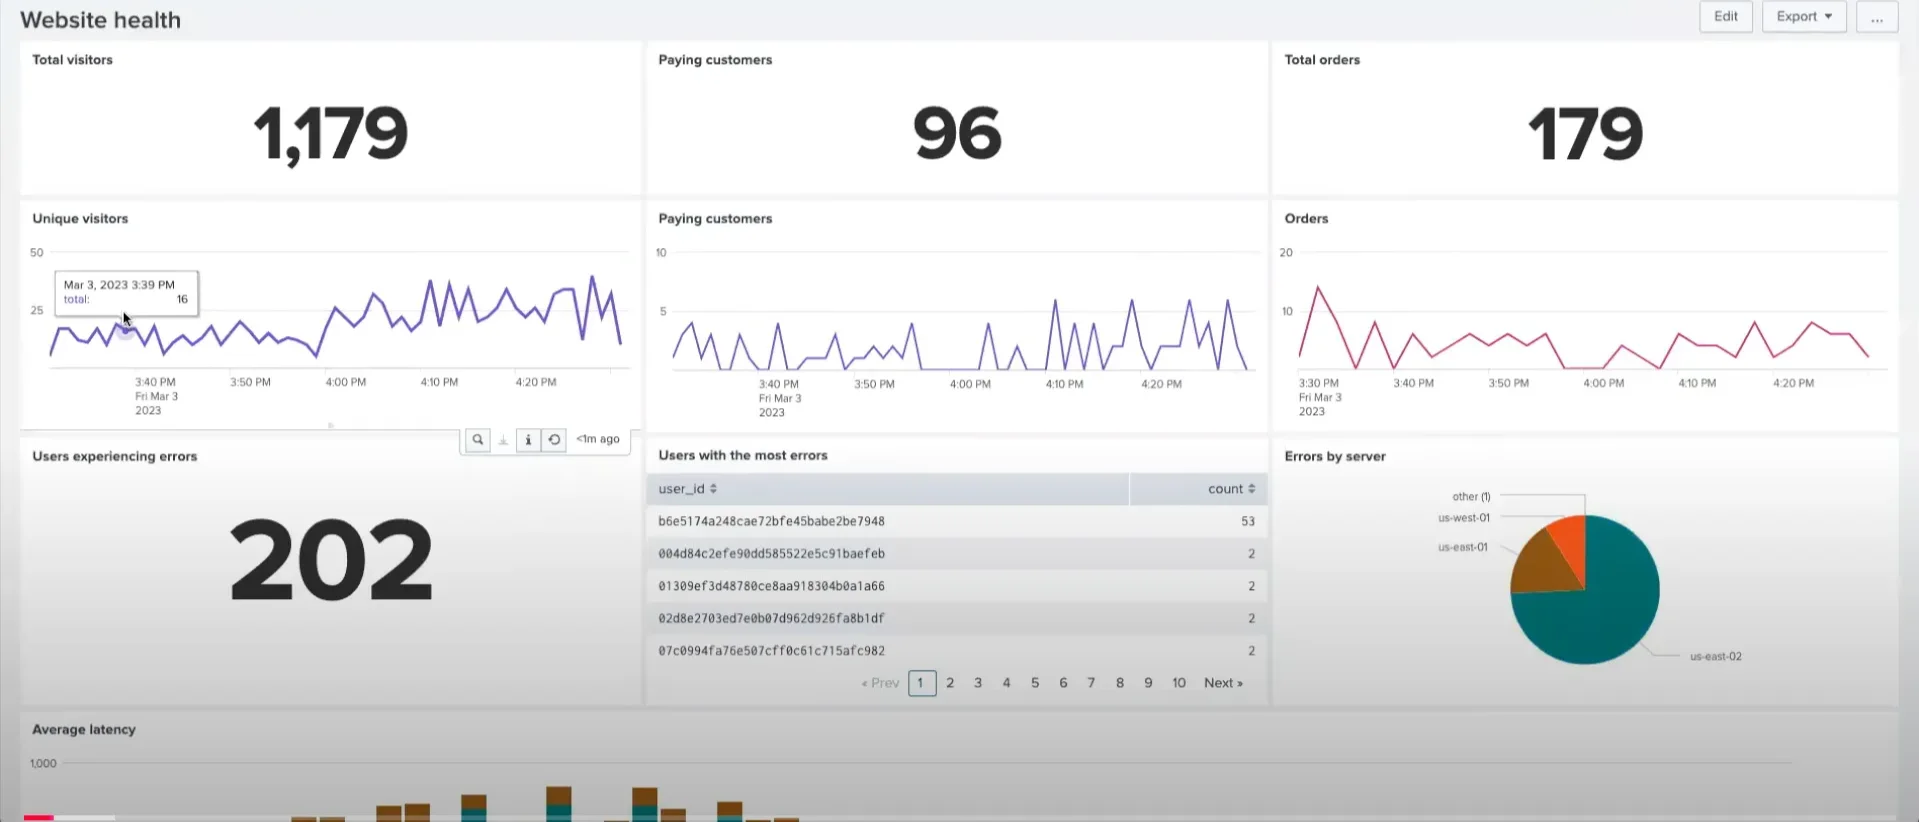
Splunk is a leading platform for analyzing machine data and managing security events. Organizations use it for log management, security monitoring, and compliance.
Key Benefits:
- Powerful Log Analysis: Processes huge amounts of data quickly with SPL query language
- Advanced Security: Detects threats 50% faster with machine learning
- Handles High Volume: Scales to enterprise-level data needs
- Custom Reports: Creates visualizations to help understand your data
- Dual Purpose: Serves both IT operations and security teams
Performance:
- Uses Splunk Processing Language (SPL) for deep log analysis
- Processes massive amounts of data efficiently
- AI-driven IT Service Intelligence (ITSI) predicts and detects incidents
- Network Explorer provides instant visibility into cloud network performance
- Includes incident response integration with war-room collaboration
Limitations:
- Expensive, starting around $2,000/month for just 5GB/day
- Needs robust infrastructure for large deployments
- Steep learning curve for mastering SPL
- Separate UIs for core Splunk and newer components
Pricing:
- Modular pricing: Infrastructure Monitoring ~$15 per host/month
- APM ~$55 per host
- Real User Monitoring ~$14 per 10k sessions
- Additional charges for log ingestion
Best For: Enterprises needing deep log analysis for security and compliance, especially those wanting to unify IT operations and security monitoring
AppDynamics
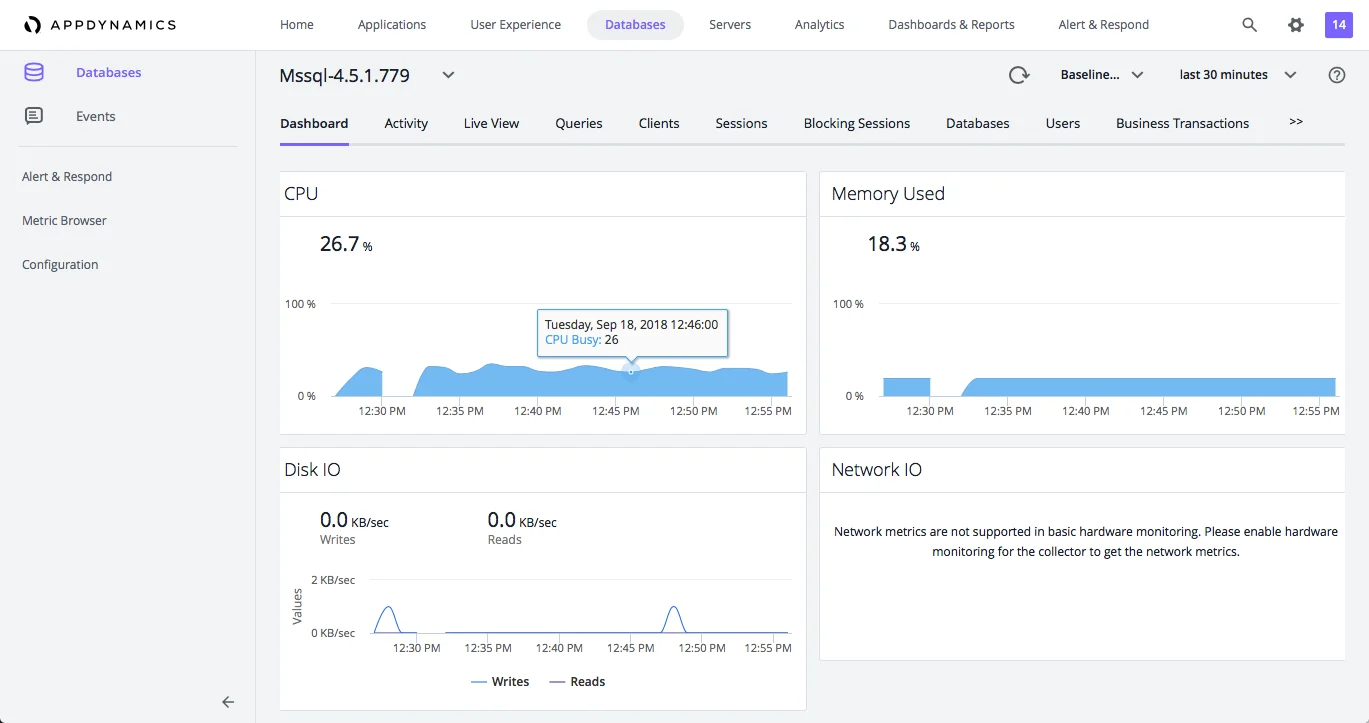
AppDynamics, now owned by Cisco, provides visibility into application performance, infrastructure health, and business impact. It helps organizations monitor complex systems and improve user experiences.
Key Benefits:
- Business Impact Focus: Links application performance to business outcomes
- Complete Stack Visibility: Monitors frontend, backend, and database layers
- AI-Powered Analysis: Finds and fixes issues 30% faster
- Enterprise Ready: Used by over 4,000 enterprises globally
- Collaboration Tools: Features "virtual war room" for incident response
Performance:
- Tracks user interactions and application responsiveness
- Correlates technical issues with business metrics
- Instruments at the code level, tracing transactions across distributed services
- Provides detailed performance baselining
- Includes security vulnerability detection in runtime
Limitations:
- Requires dedicated resources for setup and management
- Premium pricing not suitable for smaller businesses
- Complex to implement fully in large environments
- Less modern interface compared to newer tools
Pricing:
- Enterprise pricing (custom quotes)
- Infrastructure monitoring starts around $6 per CPU core/month
- Full APM for large deployments is costly
Best For: Enterprises in e-commerce, fintech, and SaaS needing business-focused monitoring with deep application insights
IBM Instana
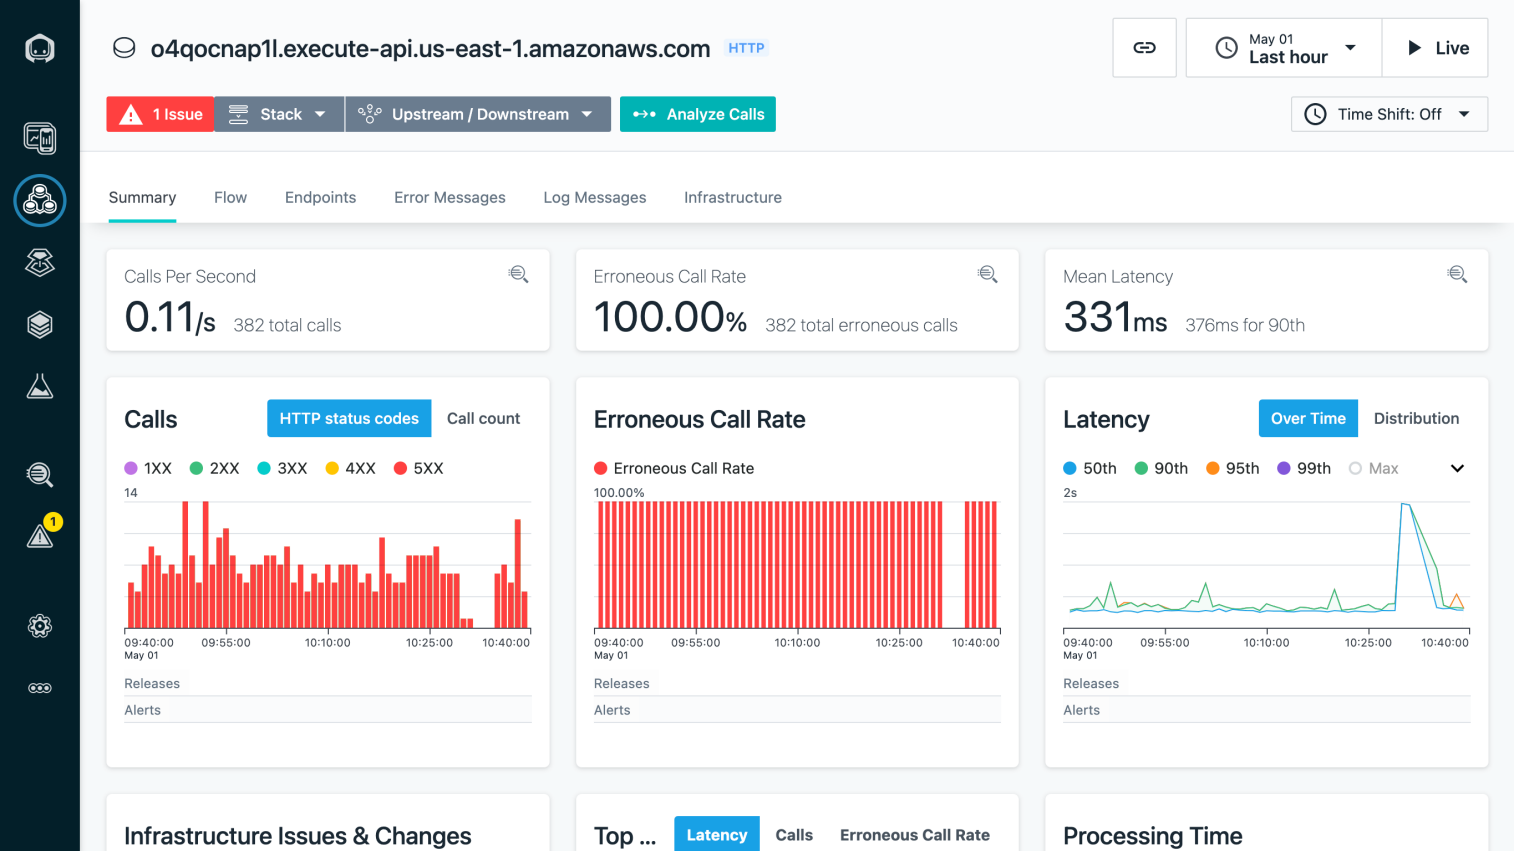
Instana is an automated application performance monitoring tool designed for modern cloud-native applications. It provides real-time observability with minimal configuration.
Key Benefits:
- Automatic Discovery: Instantly maps all services and dependencies
- Zero Configuration: Deploys agents that auto-instrument applications
- Real-Time Monitoring: Provides metrics at 1-second intervals
- AI-Assisted Analysis: Identifies root causes across cascading failures
Performance:
- Continuously detects new components or changes
- Provides high-granularity metrics with low latency
- Leverages AI for performance analysis
- Supports 300+ technologies out-of-the-box
- Includes end-user monitoring for web and mobile
Limitations:
- Learning curve for its automated approach
- High starting costs not suitable for small environments
- Enterprise-heavy sales and support model
- Overwhelming amount of data and events initially
Pricing:
- Tiered plans: Essentials around $207/month
- Advanced ~$775/month for full-stack, AI features
- Pricing per host (MVS unit) with packages
Best For: Organizations with dynamic microservice environments who want automated, hands-off monitoring
Elastic Observability
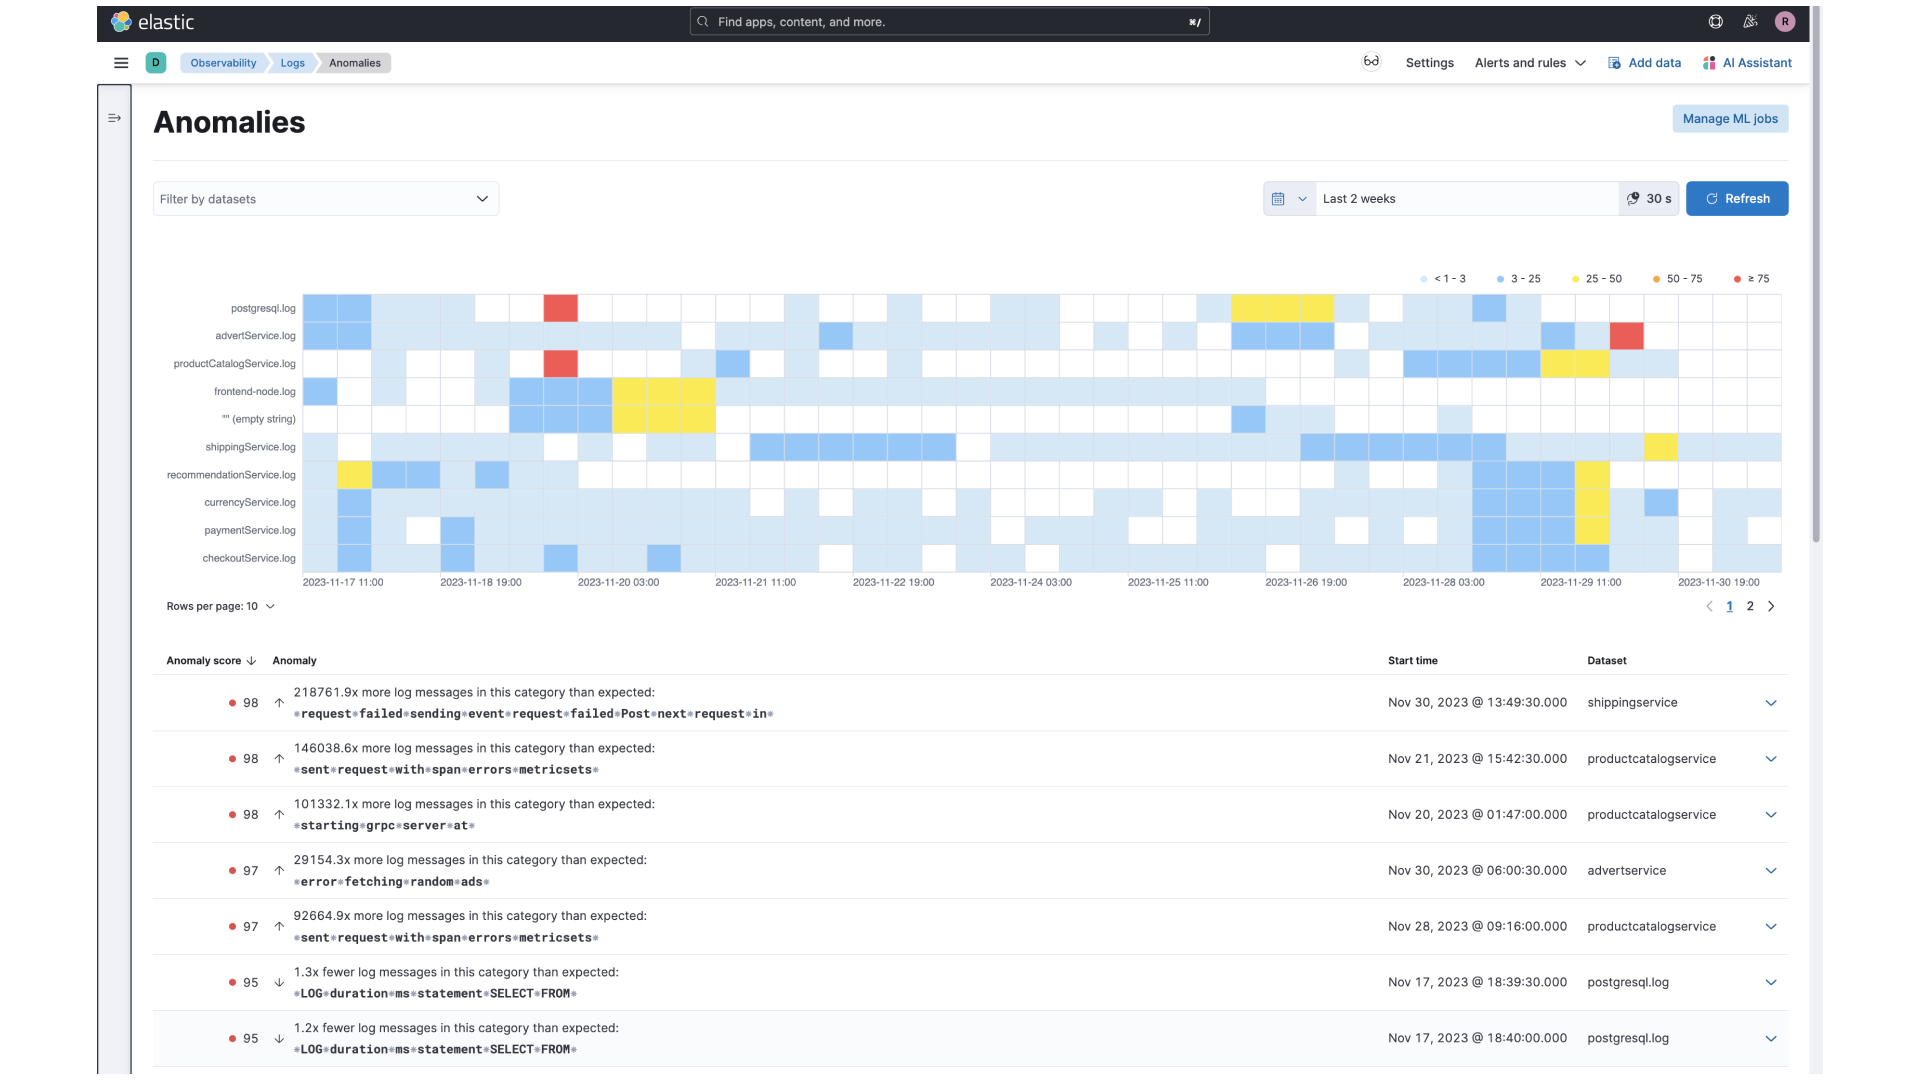
Elastic Observability builds on the popular ELK stack (Elasticsearch, Logstash, Kibana) to provide a complete monitoring solution. It handles logs, metrics, and traces on a proven search analytics engine.
Key Benefits:
- Open-Source Foundation: Much of the stack is open-source or source-available
- Powerful Search: Industry-leading search capabilities for logs and metrics
- Flexible Deployment: Self-host or use Elastic Cloud managed service
- Universal Profiling: Deep performance insights across your stack
Performance:
- Handles logs, infrastructure metrics, APM traces on one platform
- Supports OpenTelemetry and 350+ prebuilt integrations
- Provides powerful log search with Kibana's Discover
- Offers deep visibility with Lucene query syntax
Limitations:
- Complex to tune and configure when self-hosting
- Requires significant resources for high ingest rates
- Some advanced features only in paid tiers
- Multiple Kibana apps may feel less unified than competitors
Pricing:
- Open-source self-managed (free basic license)
- Elastic Cloud managed service starts ~$95/month (Standard)
- Higher tiers from ~$125+ for enterprise features
Best For: Organizations that need powerful log analytics and search capabilities, especially those already using Elasticsearch
How to Choose the Right Monitoring Tool
Selecting the right tool is crucial for your system's performance. Consider these key factors:

Budget: Set a realistic budget that balances cost with needed features. Sometimes paying more upfront saves money later by preventing downtime.
Scalability: Choose a tool that can grow with your business. If you plan to expand or adopt hybrid setups, make sure your tool can handle it.
Ease of Use: Look for user-friendly interfaces and simple setup. Consider whether your team needs training or if the tool offers intuitive controls.
Compliance & Security: Verify the tool meets regulations for your industry (GDPR, HIPAA, ISO) and includes security features like encryption.
Deployment Options: Decide between on-premises, cloud-based, or hybrid solutions based on your needs for control and updates.
Total Cost: Calculate all expenses including licenses, maintenance, upgrades, and support. Open-source tools may have lower costs but require more technical expertise.
Community Support: Tools with active communities provide valuable resources for troubleshooting and optimization.
Getting Started with SigNoz
If you need an open-source, affordable, full-stack observability platform, SigNoz offers a great alternative to expensive tools like LogicMonitor. It provides enterprise-grade features built specifically for developers and engineering teams.
Why Choose SigNoz?
- Data Control: Self-hosting gives you complete control over your monitoring data
- Vendor Independence: Built on OpenTelemetry for maximum flexibility
- Cost-Effective: No high SaaS fees, just transparent open-source benefits
- Developer-Focused: Created by developers for developers, with features that streamline your workflow
- Predictable Pricing: Pay based on data ingested, not per host or user
SigNoz Cloud is the easiest way to run SigNoz. Sign up for a free account and get 30 days of unlimited access to all features.
You can also install and self-host SigNoz yourself since it is open-source. With 24,000+ GitHub stars, open-source SigNoz is loved by developers. Find the instructions to self-host SigNoz.
Final Recommendations
For Developer-Centric Teams and Startups:
- SigNoz or Prometheus+Grafana for budget-conscious teams
- New Relic's free tier (100GB/month) for small applications
For SRE Teams in Mid-to-Large Organizations:
- Datadog or New Relic for balance of features and usability
- Dynatrace for complex, dynamic environments with automation needs
- Hybrid approach: open-source metrics with specialized APM tool
For Enterprises with Strict Compliance Requirements:
- Self-hosted Elastic Observability or SigNoz for data control
- Splunk for combined IT operations and security monitoring
- AppDynamics for business-transaction focused monitoring
Key Takeaways
Real-time monitoring helps detect security threats early, ensuring system reliability and faster incident response. Manual monitoring often leads to delayed detection and costly downtime.
Open-source solutions like SigNoz provide enterprise-grade monitoring at minimal cost for startups, while larger enterprises may need commercial solutions with advanced features and dedicated support.
Your monitoring tool should scale easily and offer customization options. Growing companies need solutions that work across multiple cloud environments while maintaining visibility into all services.
AI-powered tools improve efficiency by automating anomaly detection and root cause analysis, reducing false alarms and improving system uptime.
Effective monitoring tools should integrate with your cloud platforms, Kubernetes clusters, and CI/CD pipelines, especially for DevOps-focused organizations.
Consider a hybrid approach to balance costs: use open-source for infrastructure monitoring and paid tools for critical application monitoring.
FAQs
What is the best LogicMonitor alternative for small businesses?
For small and medium businesses, SigNoz, Zabbix, and PRTG Network Monitor are excellent choices. They offer cost-effective, scalable solutions that meet the needs of smaller organizations without breaking the budget. Better Stack is also emerging as a user-friendly option with a generous free tier.
What key features should I look for in a monitoring tool?
When choosing a monitoring solution, look for these essential features:
- Complete Coverage: Monitors all your systems - servers, apps, networks, and databases
- Custom Alerts: Notifies you only about important issues, not minor problems
- Scalability: Grows with your business without performance issues
- Automation: Discovers devices and diagnoses issues automatically
- User-Friendly Interface: Provides clear dashboards anyone can understand
- Reporting: Shows performance trends and helps identify root causes
- Integration: Works with your existing tools like chat apps and ticketing systems
- Affordable Pricing: Fits your budget with good value for money
Can I migrate from LogicMonitor to another tool easily?
Yes, many tools like PRTG Network Monitor and Zabbix provide detailed migration guides with step-by-step instructions and support to ensure a smooth transition from LogicMonitor. SaaS platforms like Datadog and New Relic offer migration assistance, while open-source tools may require more manual configuration.
How do I calculate the ROI of a monitoring tool?
Use this formula to assess the return on investment:
ROI = (Cost savings from reduced downtime + Efficiency gains) ÷ (Tool cost + Migration effort)
Example calculation:
- $5,000 monthly loss from downtime × 50% reduction = $2,500 monthly savings
- 8 hours saved monthly × $50/hour = $400 monthly efficiency gain
- Total monthly savings: $2,900
- Monthly tool cost: $100
- Migration cost: $500 ÷ 12 months = $41.67 monthly
- Total monthly cost: $141.67
ROI = $2,900 ÷ $141.67 = 20.5
This means for every dollar spent on the monitoring tool, your business saves $20.50 in reduced downtime and improved efficiency - a highly beneficial investment.
How do open-source and commercial tools compare for large environments?
Open-source tools like Prometheus+Grafana or SigNoz can scale to large environments but require more engineering effort to maintain. They offer cost savings but need expertise to configure and optimize. Commercial tools like Datadog, Dynatrace, and New Relic provide more automation and out-of-the-box functionality but at higher costs. For very large deployments, the total cost of ownership might be similar when accounting for infrastructure and personnel costs.
