Top 10 PostgreSQL Monitoring Tools [2026 Guide]
Are you looking for a PostgreSQL database monitoring tool? Then you’re at the right place. PostgreSQL is a powerful, open-source object-relational database system used by various organizations due to its robust features and flexibility.
For databases to operate efficiently, it's essential to monitor them. This provides insights into their health, enables early detection of potential issues, and aids in effective resource allocation.
It is just as important to select the right tool to monitor your databases effectively. This article discusses various monitoring tools you can consider adopting for monitoring your PostgreSQL databases.
Top PostgreSQL monitoring tools at a glance
| Best For | Standout Feature | Pricing | |
|---|---|---|---|
| SigNoz (open-source) | OpenTelemetry native monitoring, and creating a wide range of PostgreSQL metric visualizations. | Open-source. Lets you track MELT under a single pane of glass. | Free community edition. Starts at $49/month for cloud. Custom price for enterprises. |
| Datadog | Full-stack visibility of metrics, logs, and events from 450+ technologies. | Managing downtime with responsive customer service. | Free edition for core collection and visualization, Pro edition starts at $15 per host per month. |
| Grafana + Prometheus | Grafana is best for visualizing data, whereas Prometheus is ideal for collecting metrics data. | Both are open-source. Pre-built dashboards of Grafana and robust and customizable alerting features of Prometheus. | Grafana has a free edition with cloud features, and the advanced premium bundle starts at $299. Prometheus is free. |
| Sematext | Comprehensive monitoring and observability for cloud-native applications. | Unified platform for logs, metrics, and traces. | Free 14-day trial with prices starting at — log management at $40/month, monitoring at $3.24/month, and synthetics at $4.5/month annually. |
| AppDynamics | Application and business performance monitoring. | Real-time analytics and insights into application performance. | Free edition, $39 for a standard edition, and customized premium edition. |
| New Relic | Full-stack observability for cloud-native environments. | Proactive performance optimization and anomaly detection. | Free edition for free clusters, serverless edition from $0.10/million reads, and dedicated from $57/month. |
| pganalyze | PostgreSQL database performance monitoring. | Intelligent tuning advisors and continuous database profiling. | Free edition with 30+ capabilities and custom pricing for standard, pro, and enterprise. |
| SolarWinds Database Performance Monitor | Database performance monitoring and optimization. | Cross-platform support for databases and cloud-native environments. | Free trial for 30 days with customized pricing. |
| Middleware | Application performance monitoring (APM). | Real-time monitoring and alerting for applications. | Free forever plan, pay-as-you-go plan, and custom price for enterprise plan. |
| Nagios | Network and infrastructure monitoring. | Comprehensive monitoring of servers, networks, and services. | Free edition, with customized enterprise solutions. |
Why is PostgreSQL monitoring important?
Monitoring your PostgreSQL database is important for different reasons. Here are some of them:
- It offers detailed insights for faster troubleshooting and resolution of issues, ensuring the health and performance of your PostgreSQL database.
- It aids in detecting and addressing security threats like unauthorized access attempts or suspicious queries, and safeguarding data integrity.
- It ensures database reliability by preemptively identifying and resolving issues, minimizing downtime, and ensuring continuous availability.
- By monitoring the usage patterns and growth of your database, you can better plan for future capacity needs. This helps avoid over-provisioning or under-provisioning of resources, leading to cost savings and efficient resource utilization.
- It aids organizations in meeting regulatory standards by recording database activities, crucial for compliance during audits.
SigNoz
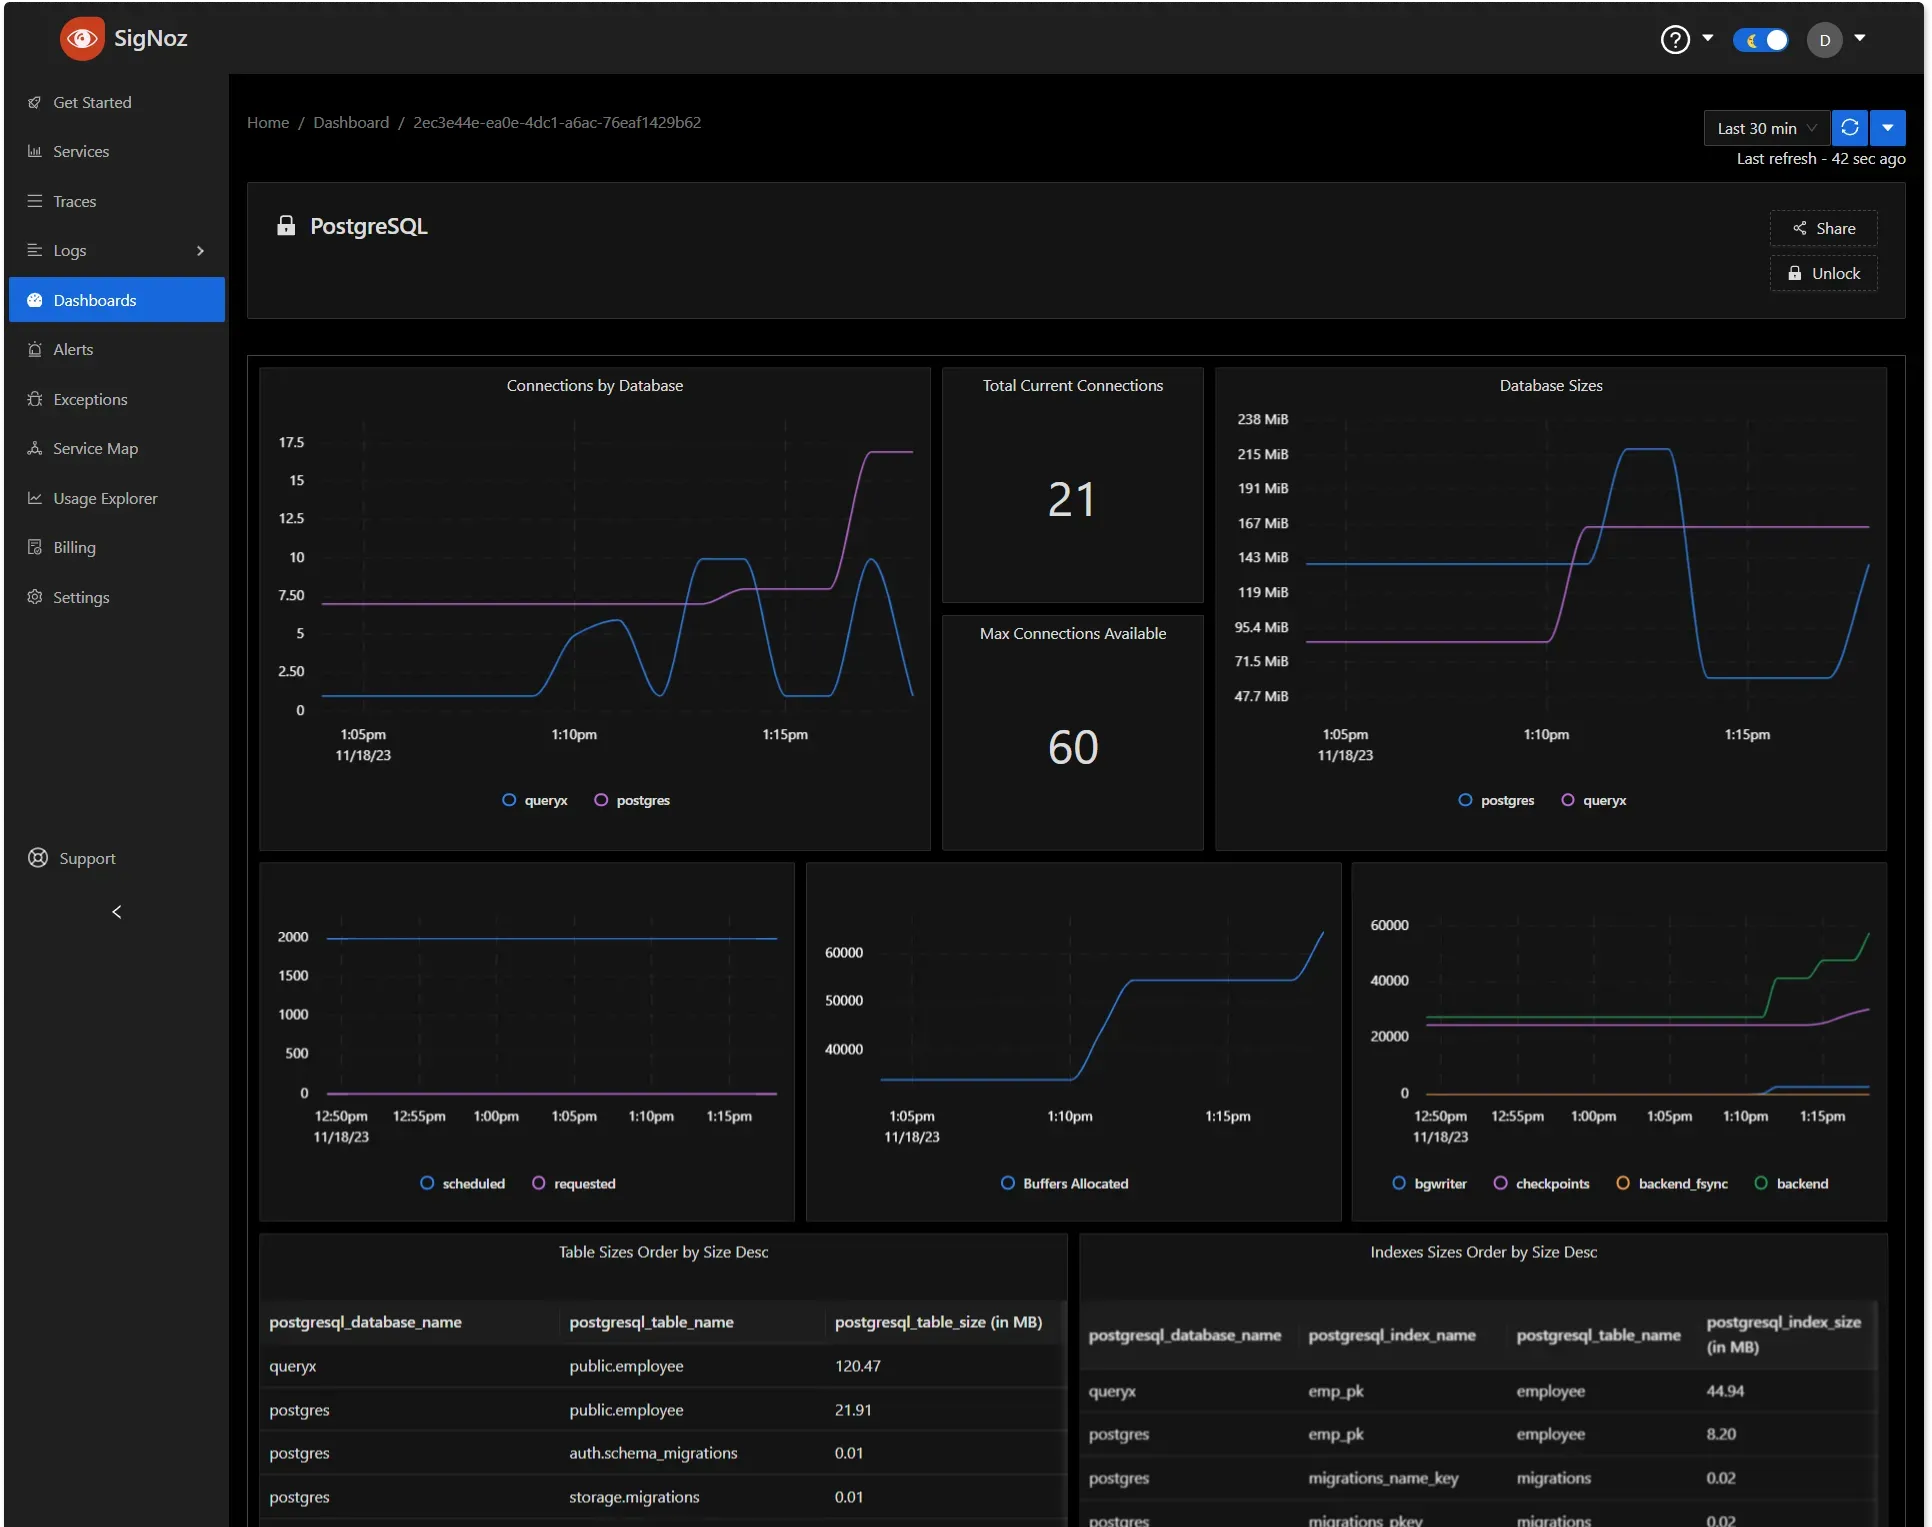
SigNoz is an open-source observability and monitoring tool built on OpenTelemetry, an emerging standard for observability.
Monitoring of PostgreSQL databases in SigNoz is done through OpenTelemetry. It collects PostgreSQL metrics using the OpenTelemetry Collector and visualizes this data effectively. SigNoz allows users to monitor key database metrics, enabling a comprehensive analysis of database performance. It allows for the creation of customized dashboards and alerts for tracking and managing the health and performance of PostgreSQL instances.
If you are interested in monitoring your PostgreSQL database instances with SigNoz, check out our detailed guide: Monitor PostgreSQL metrics with OpenTelemetry.
Features of SigNoz
- Correlation of telemetry signals.
- Exceptions monitoring.
- Metrics, traces, and logs under a single pane of glass.
- Detailed Flamegraphs & Gantt charts.
- Easy to set alerts with DIY query builder.
- Logs management.
| Pros | Cons |
|---|---|
| It has an open-source and cloud-based version. | Manual setup and management of the open-source version. |
| It is built on OpenTelemetry. | |
| It has an active and growing Slack community. | |
| It is a very cost-effective tool. |
Datadog
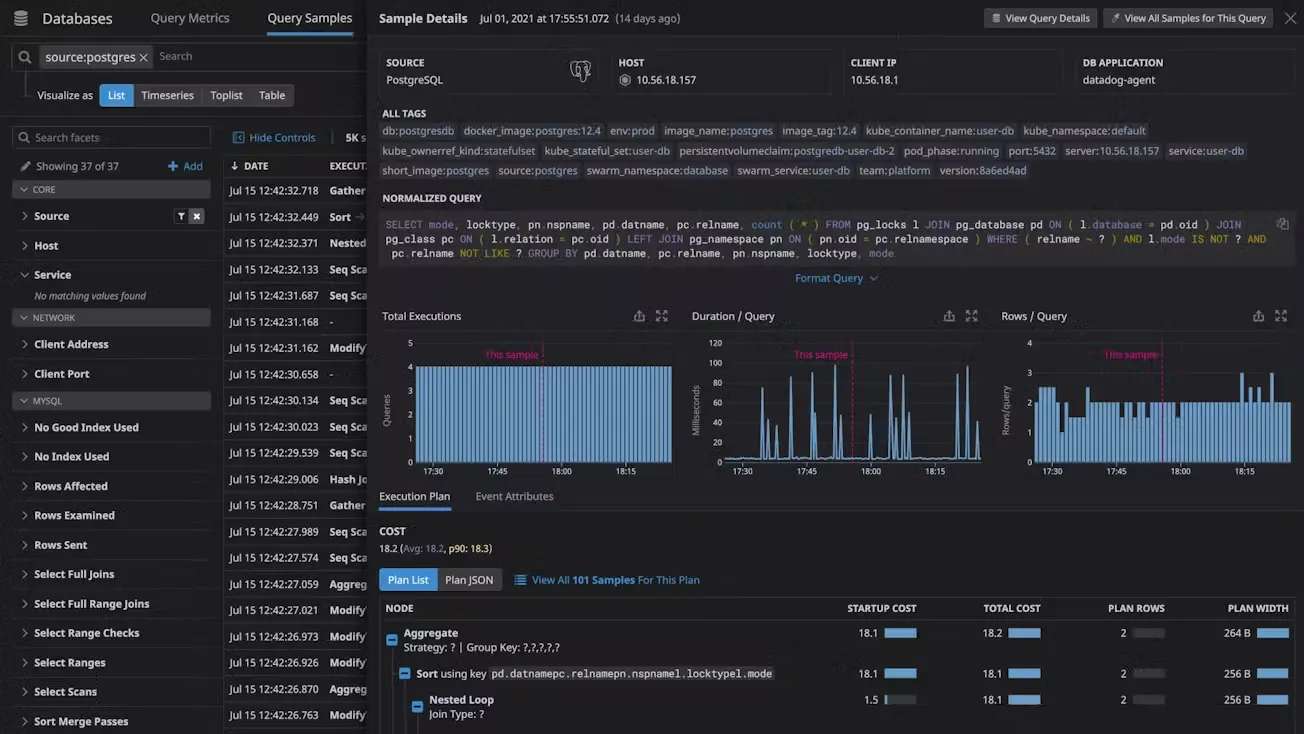
Datadog is a cloud-based monitoring and analytics platform that provides full-stack observability, allowing users to monitor their applications, infrastructure, and logs in real time.
Datadog provides a PostgreSQL integration that enables the automatic collection of PostgreSQL data from the statistics collector. This feature allows you to monitor all your PostgreSQL metrics in one centralized location. The Datadog agent is responsible for collecting PostgreSQL metrics so instead of querying PostgreSQL metrics manually, the agent automatically aggregates the metrics and presents them for visualization in a dashboard.
Features of Datadog
- It automatically collects various PostgreSQL metrics, including query performance, database size, and connection statistics.
- It supports query and host metric correlation for insights into resource constraints' impact.
- Users can create custom dashboards to monitor specific PostgreSQL metrics and performance indicators.
| Pros | Cons |
|---|---|
| PostgreSQL integration. | Datadog is quite expensive to use. |
| Centralized database with easy customization. | Charges for monitoring individual custom metrics. |
| Managing downtime is easy with responsive customer support. | No self-hosted option. |
Grafana + Prometheus
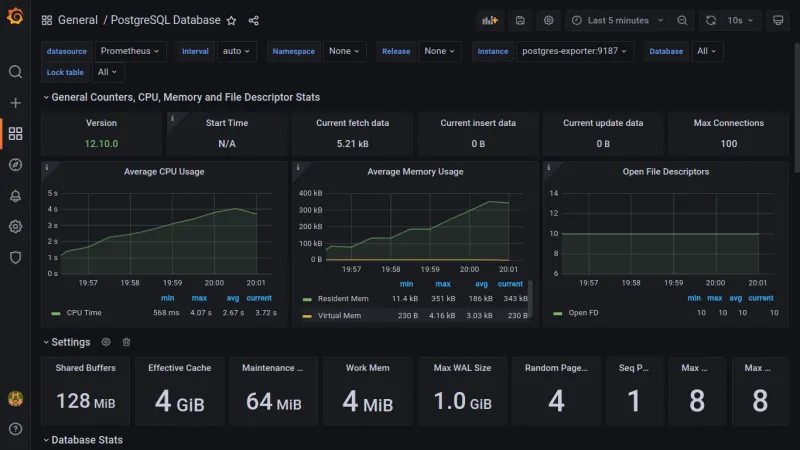
Prometheus and Grafana are open-source tools that, when used together, provide a comprehensive monitoring solution. This combination can be used in monitoring PostgreSQL databases. Prometheus functions as a metrics collector, and Grafana as the visualization tool.
To gain insights into the health and performance of PostgreSQL databases, Prometheus collects metrics from PostgreSQL database instances and stores them in its time-series database. These metrics are then visualized through Grafana, which is configured to use Prometheus as a data source.
Features of Grafana + Prometheus
- Creation of custom monitoring dashboards.
- Real-time data visualization.
- Robust Querying Language.
- Variety of visualization options.
| Pros | Cons |
|---|---|
| Grafana has nice visualization features for interpreting data. | Prometheus is limited to metrics collection alone. |
| Prometheus is a powerful monitoring system. | Prometheus requires manual setup and maintenance. |
| Both tools have strong community support. | Setup can be complex. |
Sematext
Sematext is a comprehensive monitoring tool that supports PostgreSQL and various other databases, focusing on logs, infrastructure, tracing, and performance monitoring. It offers an easy-to-set-up PostgreSQL agent for seamless installation via the UI or terminal.
With Sematext, users can ship PostgreSQL metrics to the control plane for visualization, optimization, and alerting. Additionally, it includes a built-in PostgreSQL Log integration for identifying slow queries and errors, facilitating root-cause analysis.
Features of Sematext
- Sematext provides a powerful feature for correlating PostgreSQL logs with performance metrics.
- It offers pre-built PostgreSQL dashboards that display both host-specific metrics and container metrics.
- Monitors the database's performance including the underlying infrastructure's health.
| Pros | Cons |
|---|---|
| Real-time monitoring of database performance. | Doesn't support custom PostgreSQL metrics from certain extensions. |
| Slow query analysis. | Limited support for transaction tracing. |
| Metrics correlation for troubleshooting. |
AppDynamics
AppDynamics is an application performance monitoring and management solution that helps organizations monitor, troubleshoot, and optimize their software applications in real-time.
AppDynamics can monitor PostgreSQL databases through its dedicated PostgreSQL Database Monitoring Extension. It provides real-time visibility into transaction activity, cache hit rates, tuple access types, and other performance counters in any PostgreSQL server for quickly identifying the root cause of issues and resolving costly performance problems.
Features of AppDynamics
- AppDynamics provides comprehensive database monitoring dashboards that offer insights into the performance and health of PostgreSQL databases.
- It provides out-of-the-box features such as logical data storage with tablespaces and table partitioning for efficient data management and performance optimization.
| Pros | Cons |
|---|---|
| Deep visibility into PostgreSQL performance. | No self-hosted option. |
| Provides historical performance trends and comprehensive PostgreSQL performance reports. |
New Relic
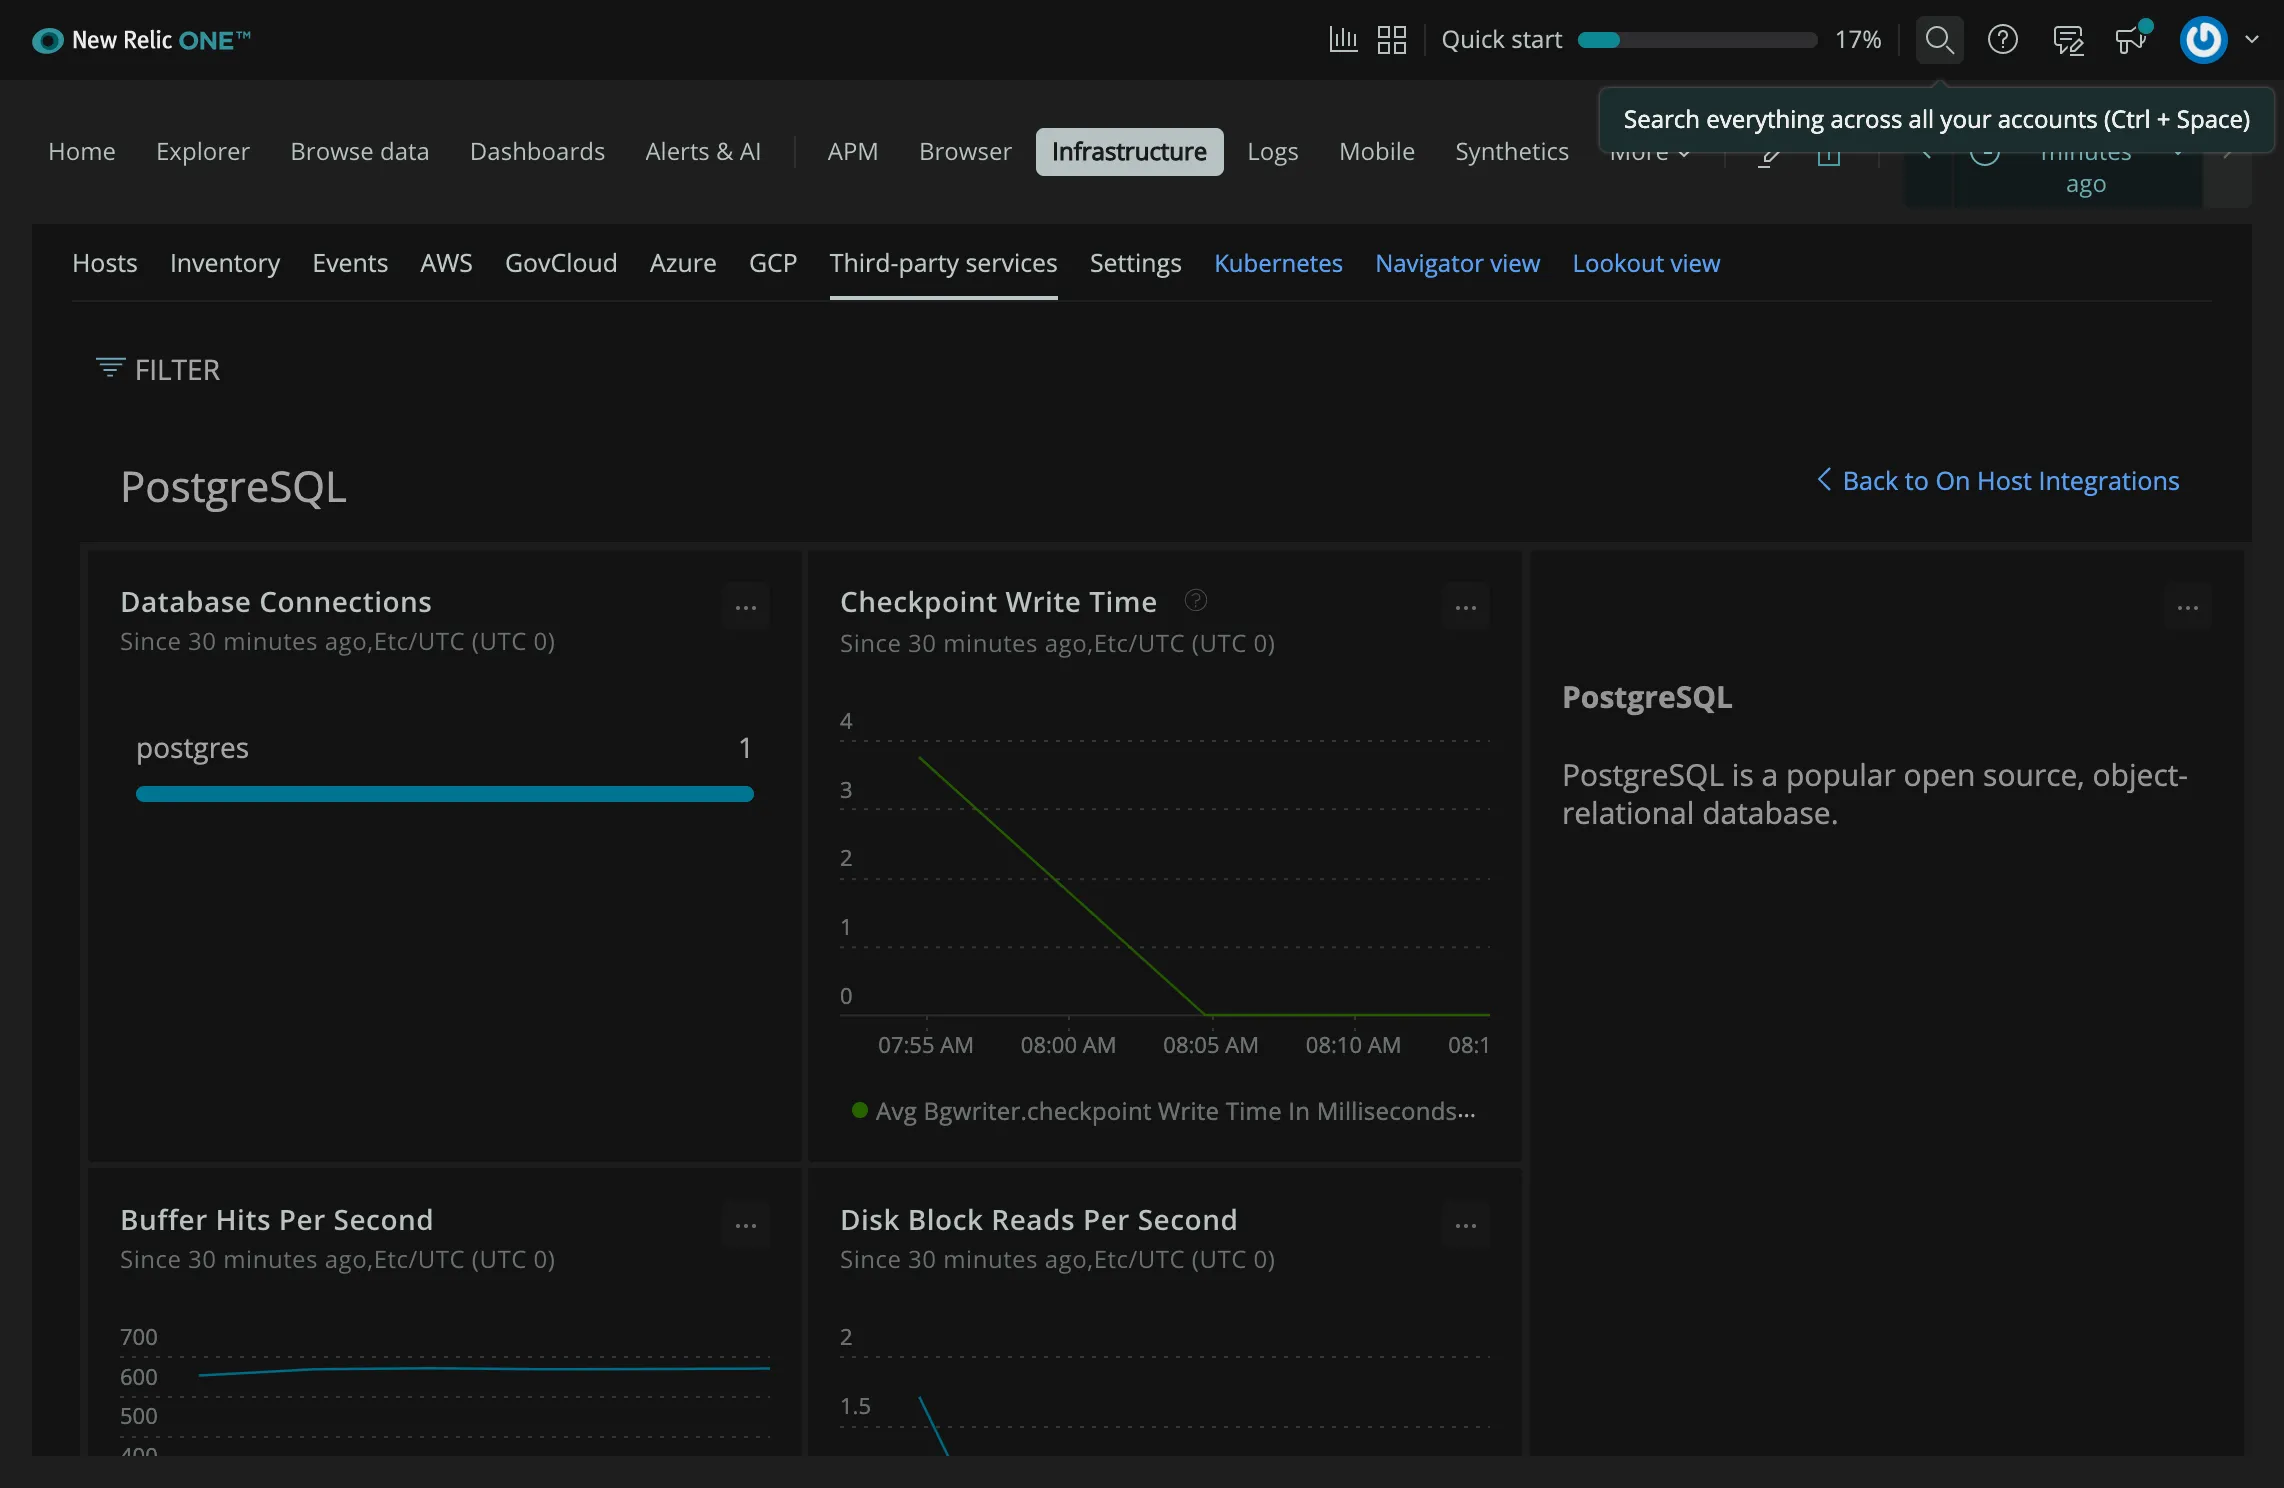
New Relic is a cloud-based observability platform that offers an on-host PostgreSQL monitoring integration designed for monitoring PostgreSQL databases. This integration facilitates the transmission of inventory metrics from PostgreSQL instances to the New Relic platform, enabling the aggregation and visualization of key performance metrics.
New Relic provides comprehensive insights into database performance, including detailed analysis of queries, throughput, and response times. It also provides an alerting system that can notify users of performance anomalies within their PostgreSQL databases.
Features of New Relic
- Collection of metrics through integration and its agent.
- Provides out-of-the-box dashboards and custom dashboards.
- AI-powered insights.
- Unlimited scalability.
- Long-term data retention period.
- Complete visibility across your entire stack.
| Pros | Cons |
|---|---|
| Supports a wide range of integrations. | Charges based on data ingested |
| and user seats which can be expensive. | |
| Comprehensive monitoring. | |
| Clean and intuitive UI. |
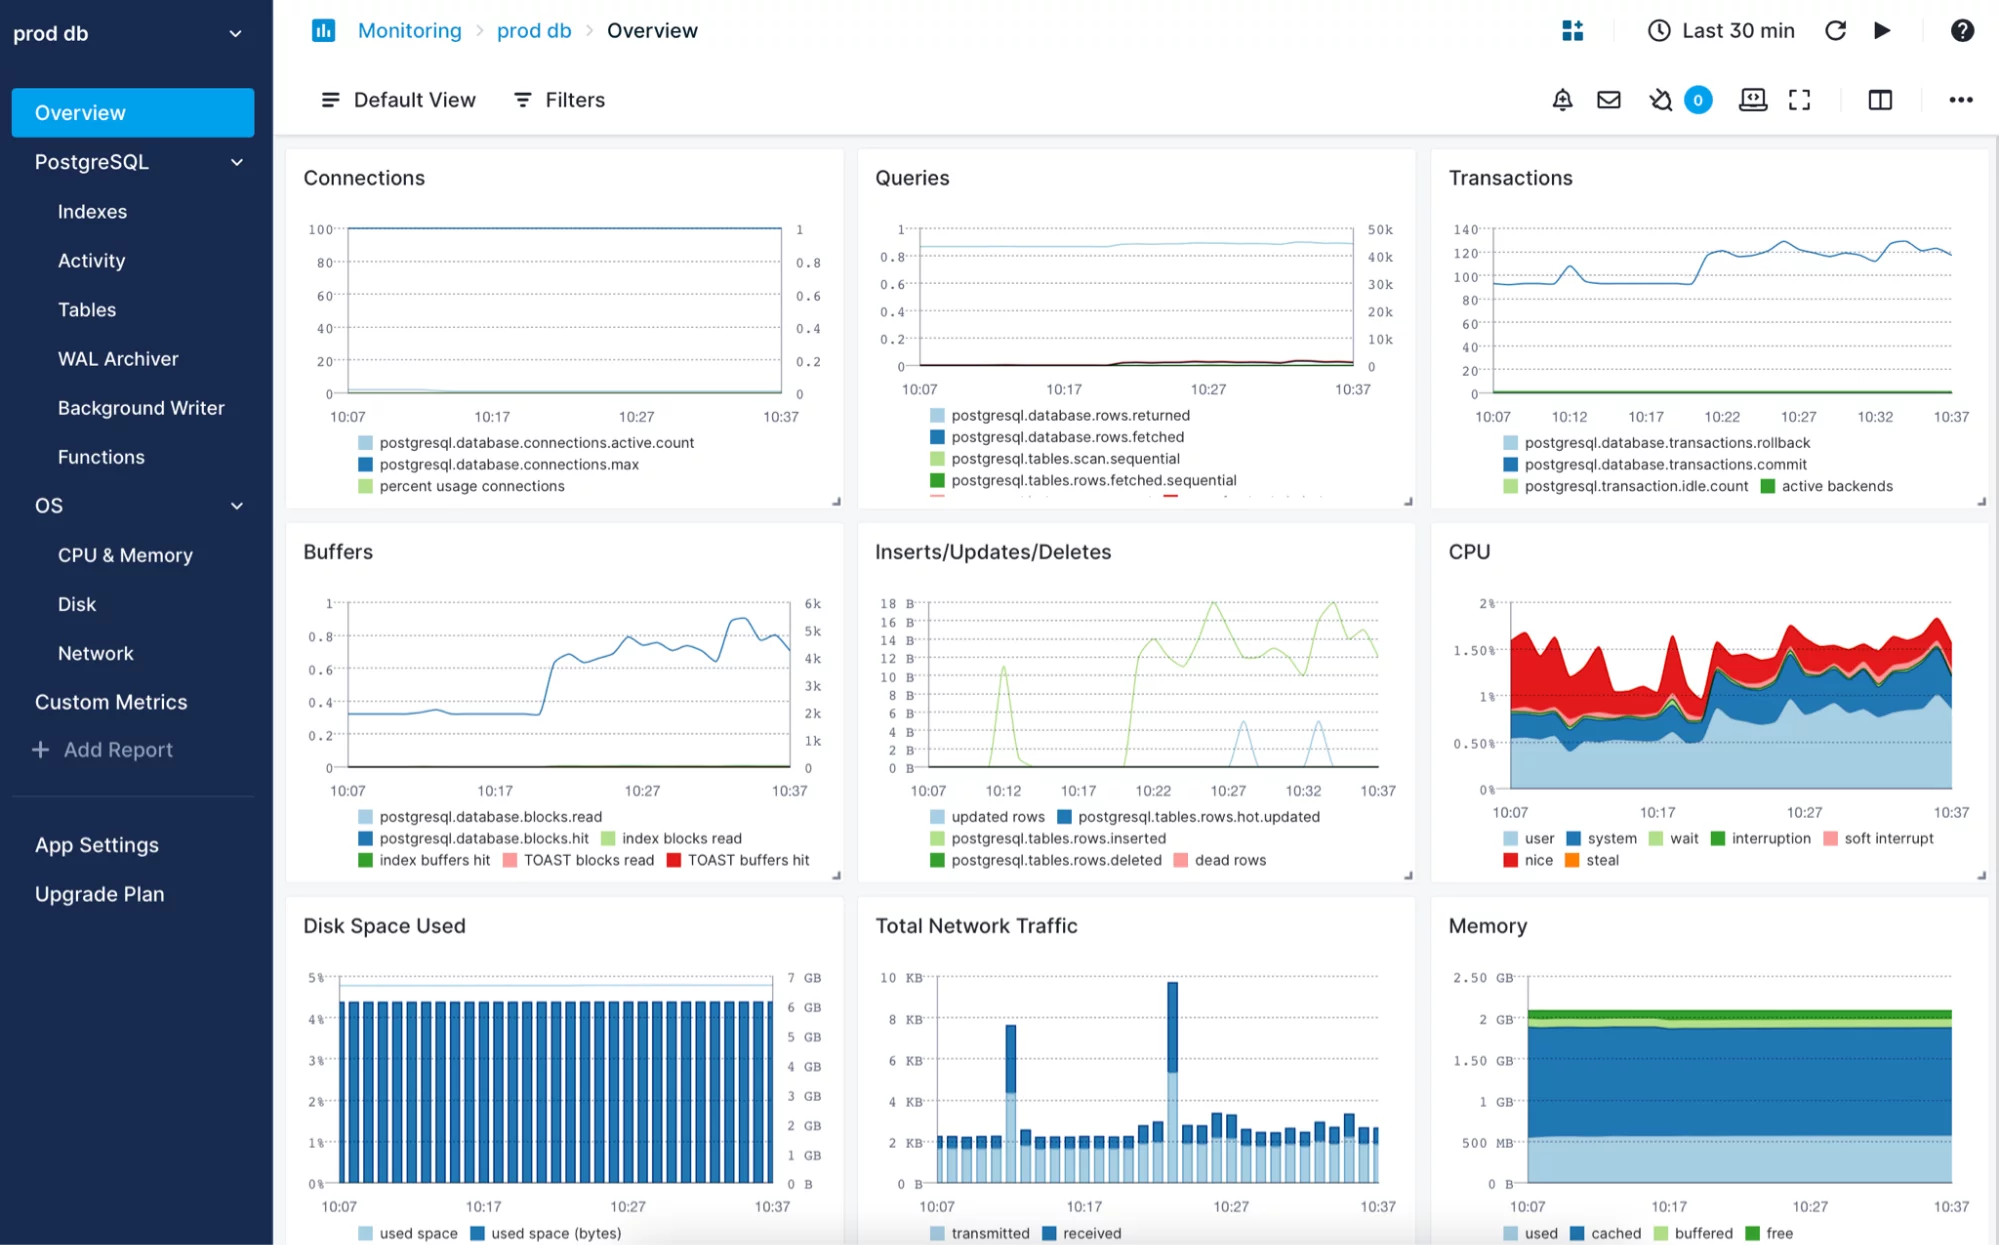
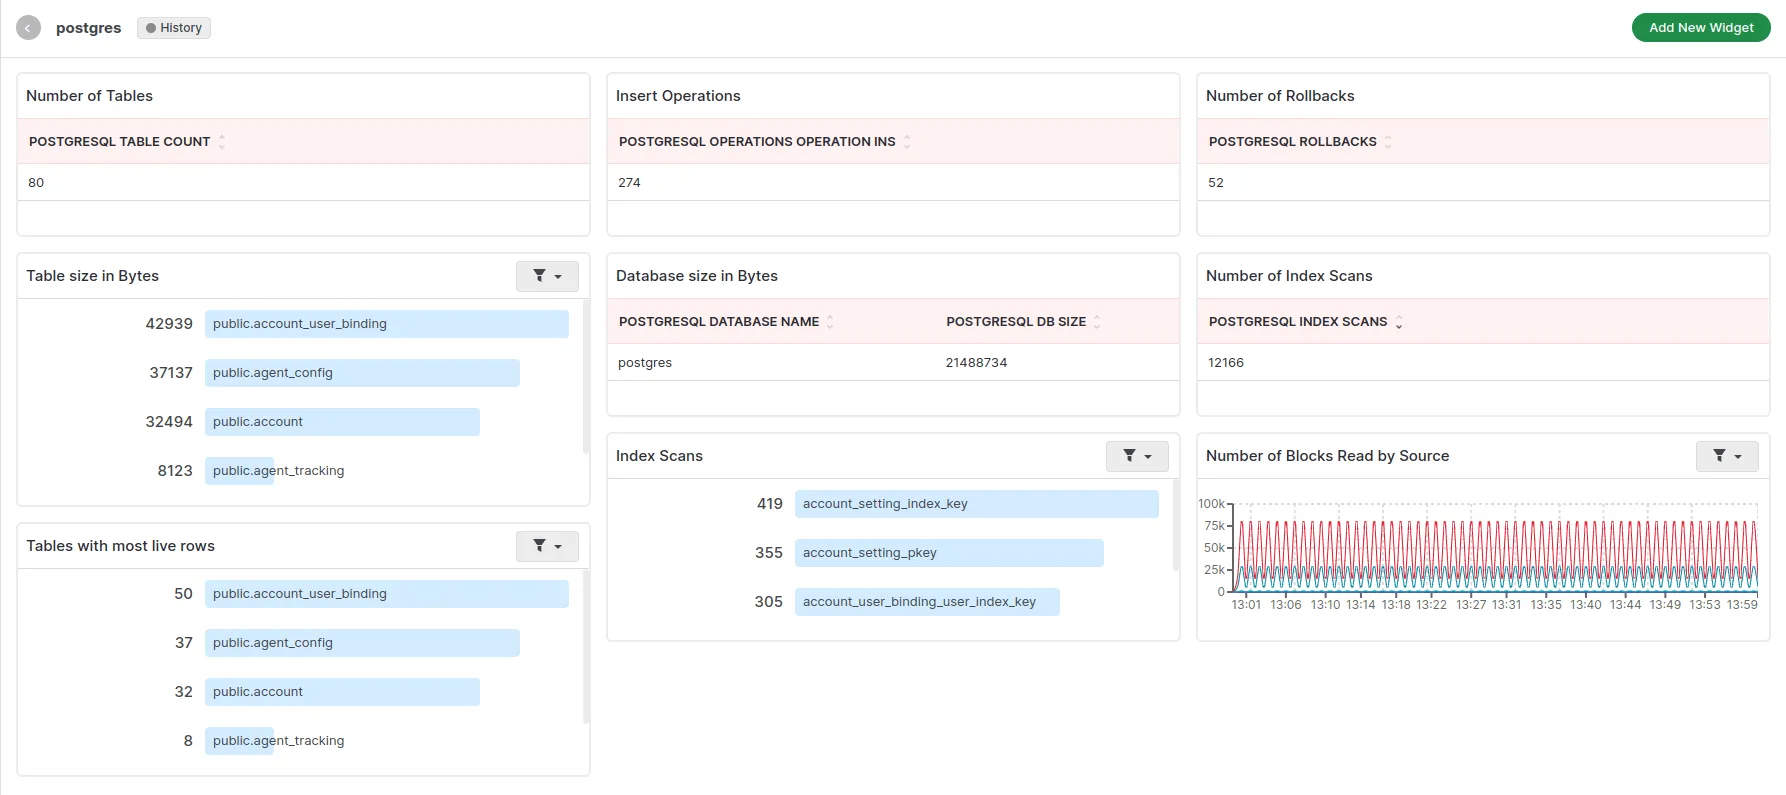
pganalyze
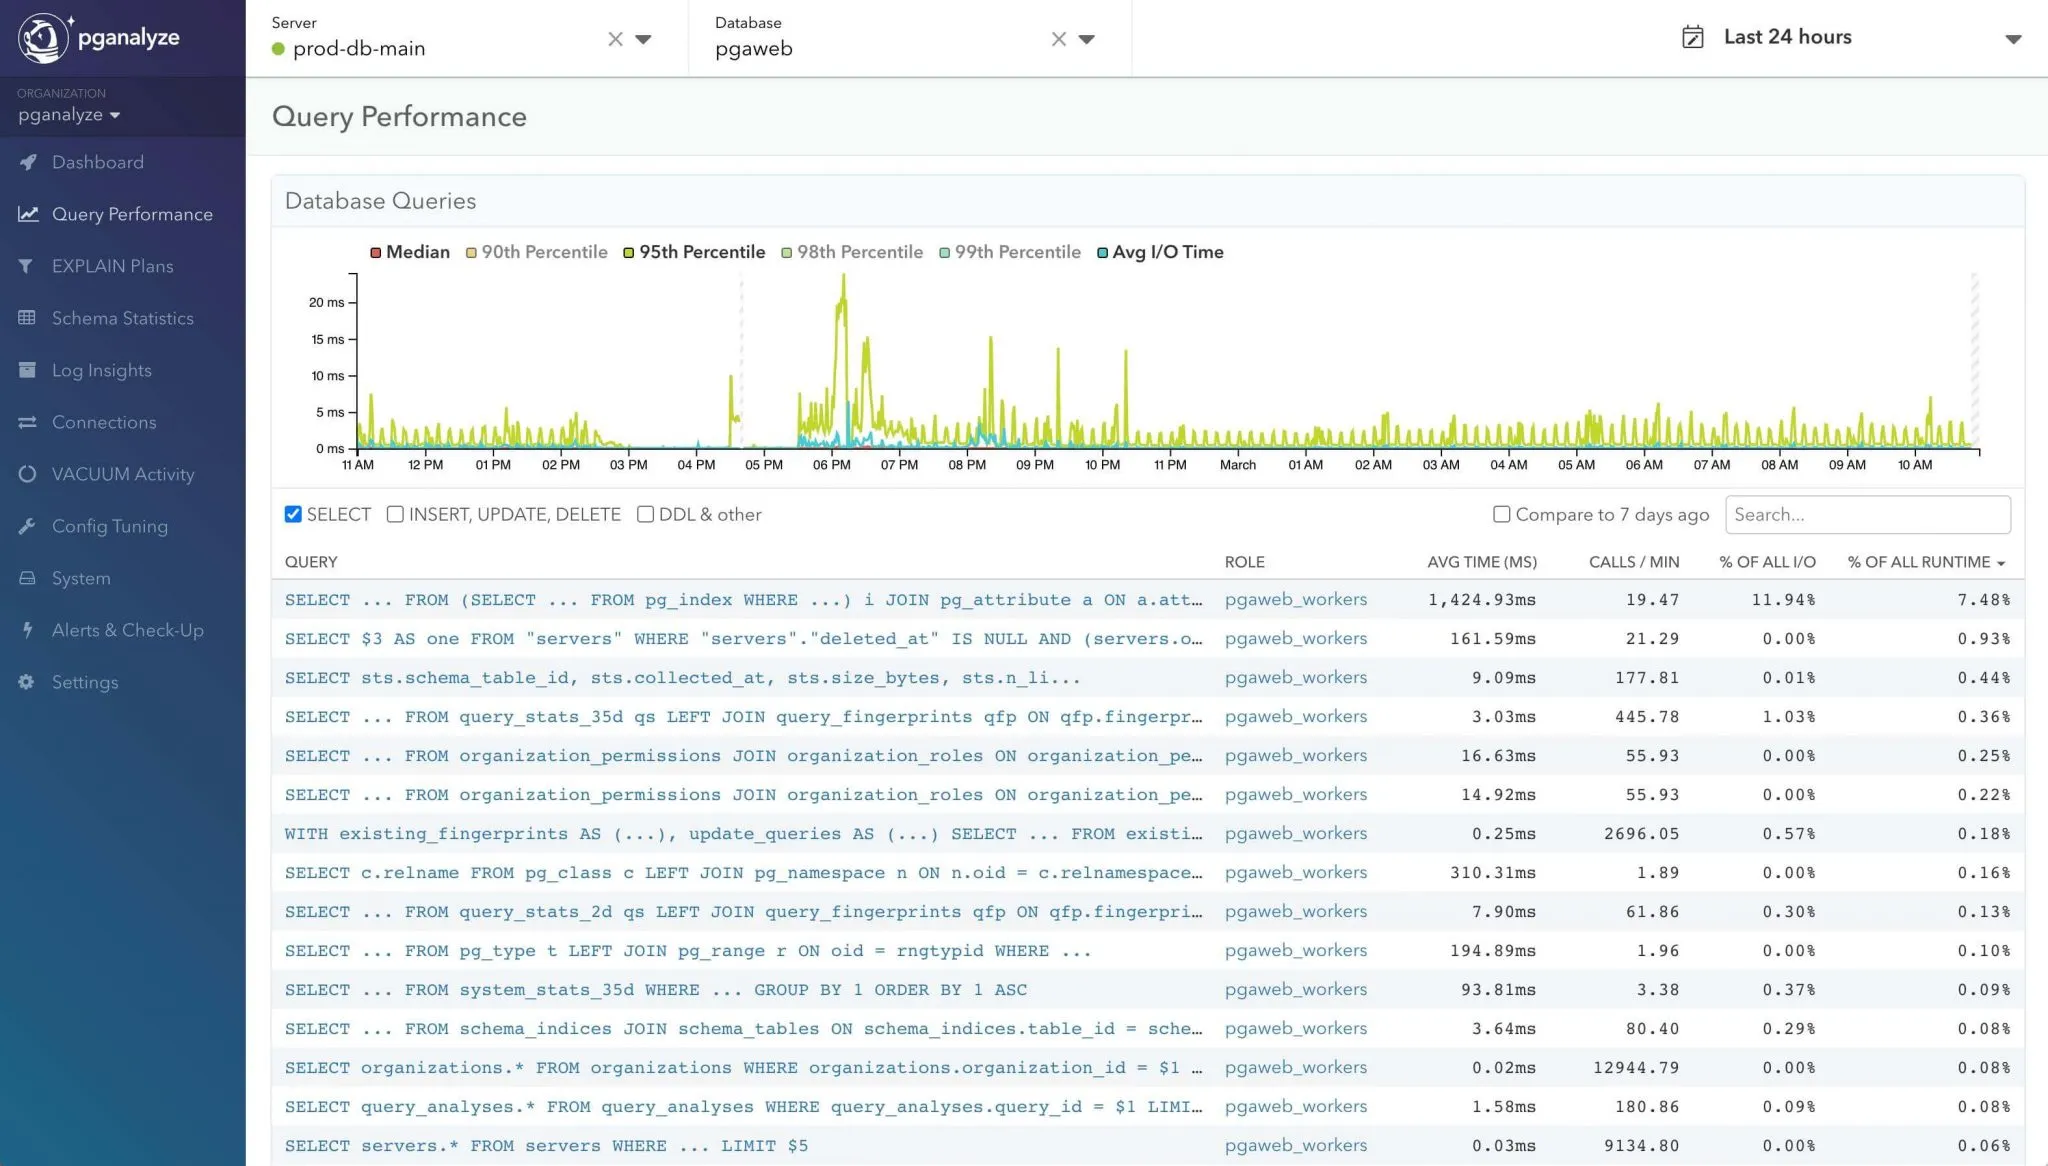
Pganalyze is a comprehensive monitoring tool designed specifically for PostgreSQL databases, providing deep insights into the performance of PostgreSQL databases. It enhances database performance and availability by leveraging intelligent tuning advisors and continuous database profiling. This approach ensures that your PostgreSQL database operates at optimal efficiency and is always accessible, even under varying workloads.
Features of pganalyze
- An Indexing Engine that automatically identifies the optimal indexes for your database, enhancing query performance and reducing load times.
- An Index Advisor that provides recommendations for creating or dropping indexes based on real-time database usage patterns, helping to optimize database performance.
| Pros | Cons |
|---|---|
| In-depth Postgres observability. | Limited extension support. |
| Built for PostgreSQL database monitoring. | Temporary tables are not supported. |
| Allows easy access to historical data. | PostGIS is only partially supported. |
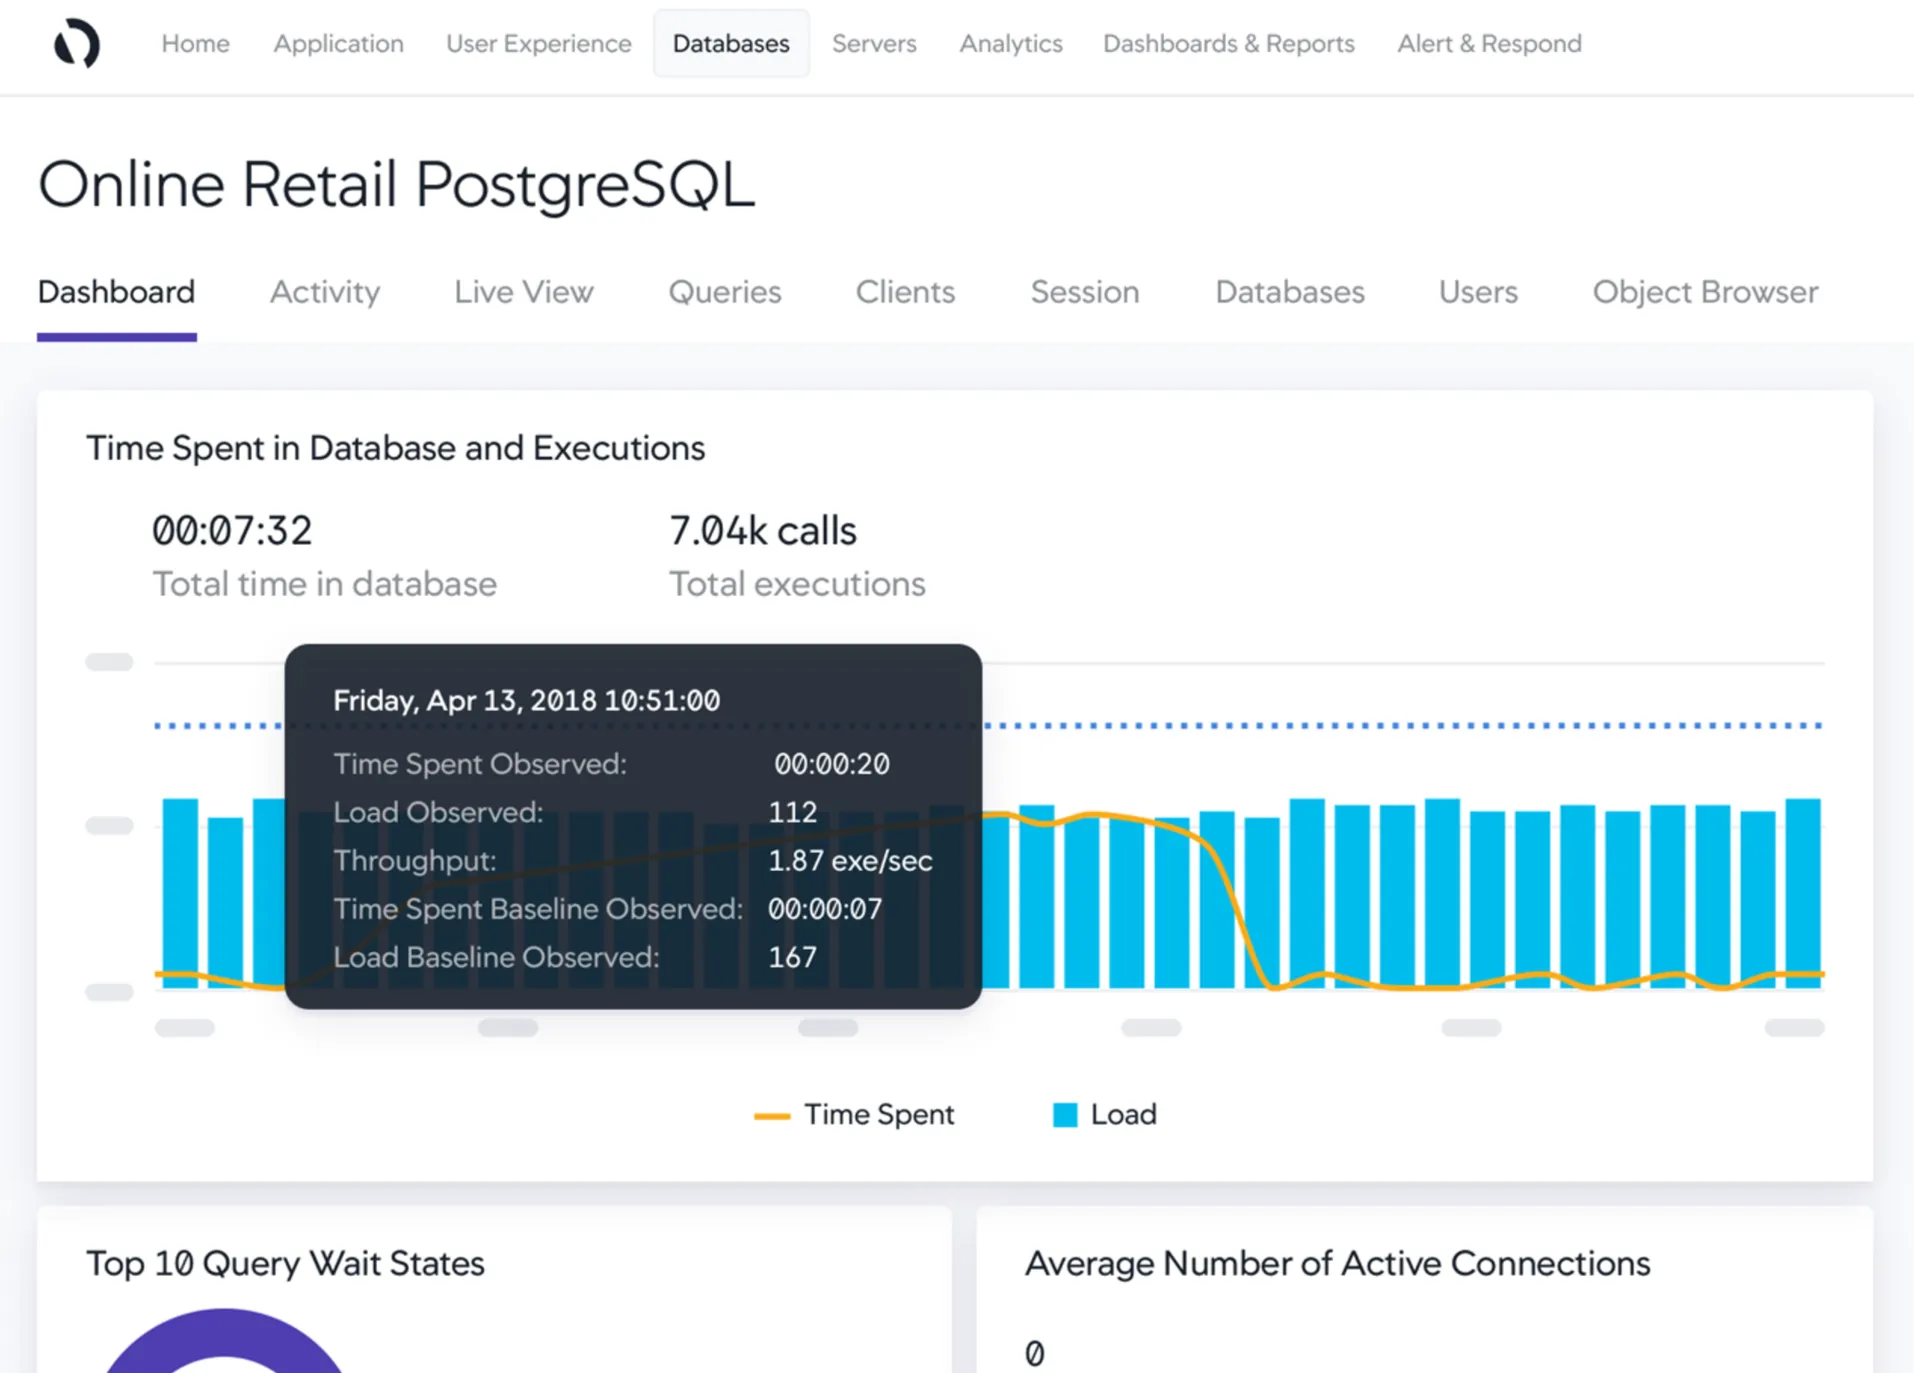
SolarWinds Database Performance Monitor (DPM)
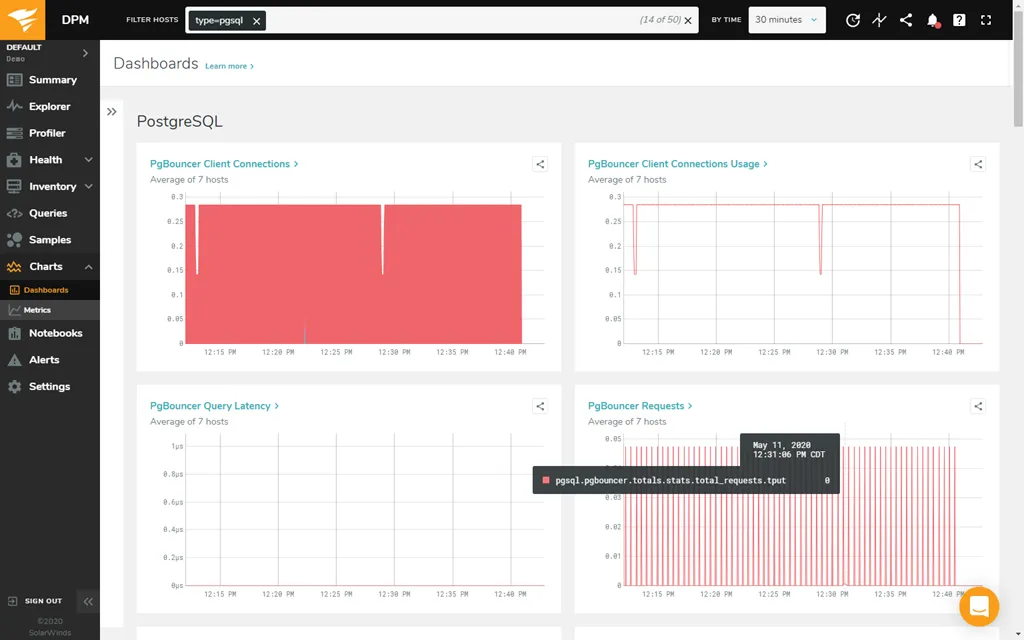
SolarWinds DPM is a SaaS-based platform designed to monitor various databases' performance, including PostgreSQL, MongoDB, Microsoft SQL, and more. It offers a Profiler feature that provides detailed information about the most time-consuming and frequently executed queries within a PostgreSQL database. This allows for organizing and managing database queries.
In addition, SolarWinds also offers a Database Performance Analyzer (DPA) product. This tool is specifically designed to assist in monitoring, diagnosing, and resolving performance issues for PostgreSQL database instances, regardless of whether they are self-managed or hosted in the cloud.
Features of SolarWinds
- SaaS platform with a web-based user interface.
- Tracks resource utilization for databases and hardware.
- Analyzes queries in detail to understand performance.
- Configurable alerts for immediate issue detection.
| Pros | Cons |
|---|---|
| Supports monitoring of different databases. | The pricing may not be very affordable for smaller companies. |
| Provides a wide range of monitoring products. | Doesn’t have an open-source version. |
Middleware
Middleware is a comprehensive cloud observability platform that provides detailed insights and into systems and applications.
Middleware provides a PostgreSQL integration which is designed to efficiently monitor PostgreSQL, helping you quickly detect and resolve issues across your PostgreSQL instances. It seamlessly integrates with your PostgreSQL instance, automatically collecting key PostgreSQL metrics which can be visualized in a custom dashboard.
Features
- End-to-end visibility into your PostgreSQL instance.
- Seamless correlation of metrics, logs, and traces for enhanced performance analysis and troubleshooting.
- Centralized monitoring of application performance.
| Pros | Cons |
|---|---|
| Creation of custom dashboards. | No open-source version. |
| Real-time monitoring of services. | |
| 24/7 technical support. |
Nagios
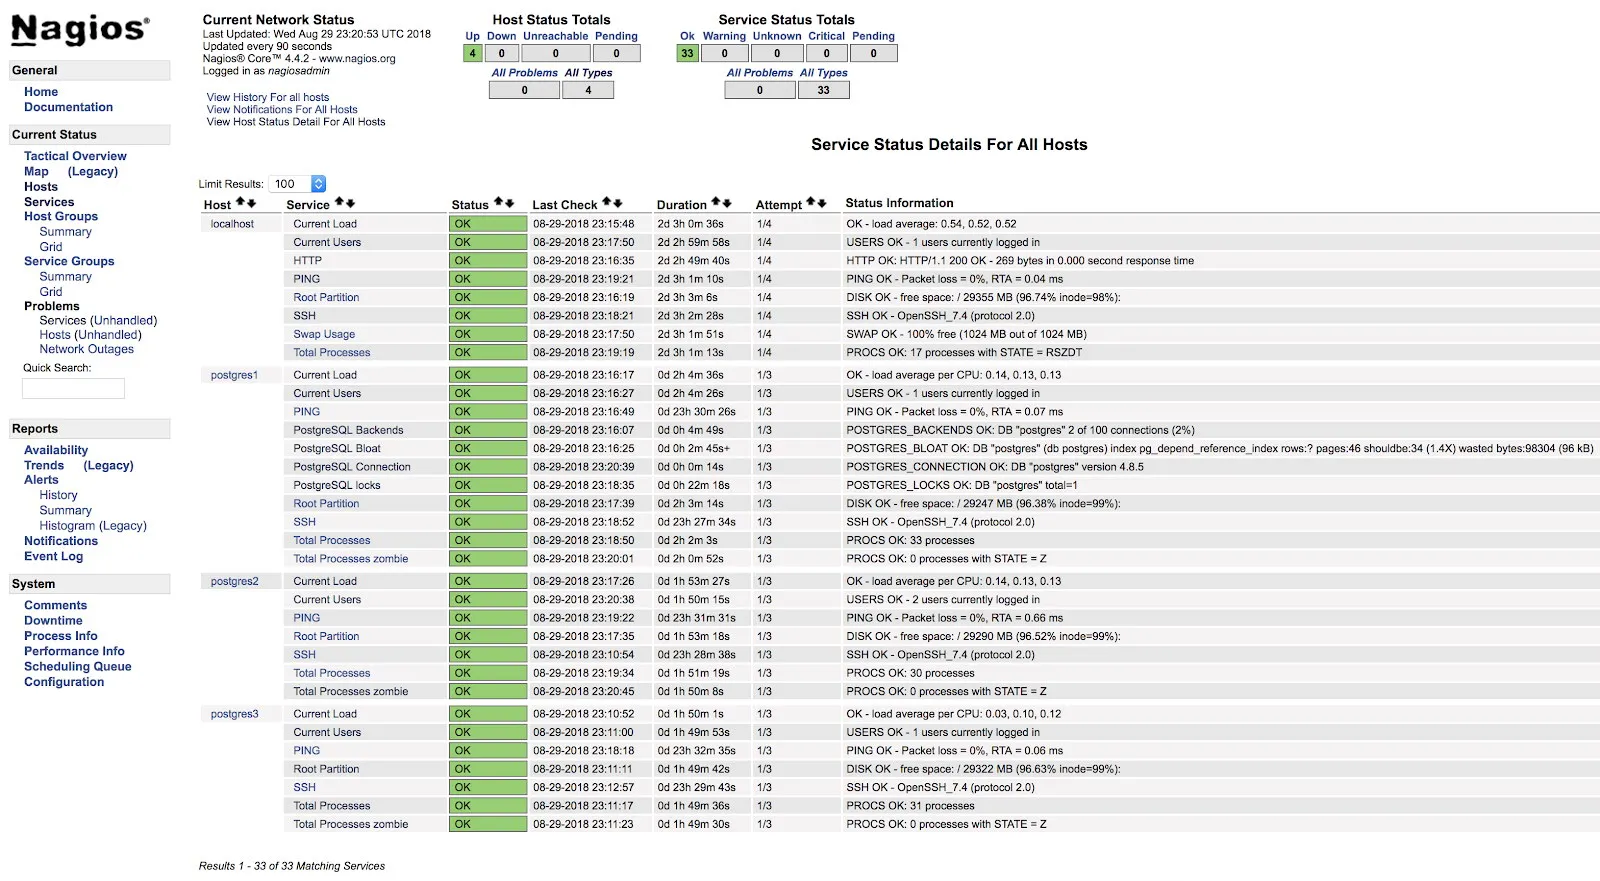
Nagios is an open-source monitoring tool used to monitor their IT infrastructure, networks, and applications. Nagios provides different wizards for monitoring databases including PostgreSQL. Its built-in Postgres Database Wizard monitors key metrics like connection Status, database size, table sizes, relation sizes, and sequences
Nagios also for configuration of alerts with different states and thresholds in case of downtime or performance issues.
Features of Nagios
- Has a powerful monitoring engine.
- Comprehensive monitoring.
- Multi-Tenant capabilities.
| Pros | Cons |
|---|---|
| It can integrate with third-party solutions. | It has an operation overhead. |
| Supports system-level metrics. | It is not PostgreSQL-specific. |
Factors to consider in selecting the right PostgreSQL monitoring tool
There are several factors to consider and have in mind when selecting a tool for monitoring your PostgreSQL database. Here are some of them:
- Scope of Monitoring: Decide if you need to monitor system-level resources, database-level metrics, or both. It is preferable to choose a tool that offers comprehensive monitoring across your entire infrastructure.
- Ease of use: Select a tool that is easy to set up and configure, with clear documentation and support for common deployment scenarios. It should have a user-friendly interface and integrate seamlessly with your existing systems.
- Cost: Consider the cost of the monitoring tool, including free tiers, open-source options, and subscription or licensing fees based on your monitoring needs.
- Scalability: Ensure the tool can scale with your database, support multiple databases, handle large data volumes, and provide insight into the performance and health of your PostgreSQL databases at scale.
- Open-Source vs. Proprietary Solution: Choose between an open-source tool for flexibility and customization or a proprietary solution for out-of-the-box features and dedicated support.
- Community and support: Consider the level of community support and the quality of customer service the tool has. A strong community and professional support can be invaluable for troubleshooting and staying updated on new features.
Conclusion
Monitoring your PostgreSQL database is important to stay on top of its performance, identify potential issues early, and ensure the smooth operation of your applications. Choosing the appropriate monitoring tool allows for a deeper understanding of database health, efficient resource management, and timely resolution of anomalies or bottlenecks.
If you’re looking for an all-in-one solution, easy-to-use, open-source tool, consider Signoz. SigNoz is a full-stack APM that is ideal for metrics monitoring, distributed tracing, and log management.
Getting started with SigNoz
SigNoz Cloud is the easiest way to run SigNoz. Sign up for a free account and get 30 days of unlimited access to all features.

You can also install and self-host SigNoz yourself since it is open-source. With 24,000+ GitHub stars, open-source SigNoz is loved by developers. Find the instructions to self-host SigNoz.
Further Reading
