Single Pane of Glass Monitoring - Quick Guide & Open Source Solution
Single Pane of Glass (SPOG) monitoring is a term used to denote monitoring applications with a single tool that provides a comprehensive set of dashboards for the entire software system of an organization. Managing multiple monitoring tools for different aspects of the IT system becomes too cumbersome. And that’s how the concept of a single pane of glass monitoring evolved.
Most modern applications are now built using distributed software systems. Applications use distributed application architectures like microservices and serverless to serve user demands at a global scale. It gets deployed using container orchestration tools like Kubernetes on distributed infrastructure that might be using a hybrid cloud environment.
Cloud computing and containerization have brought many benefits like speed to market and on-demand scaling. But it has also increased operational complexity. Moreover, users expect digital applications to meet their needs in seconds. Any latency is missed business opportunity.
To address these issues, engineering teams use monitoring tools to keep a tab on the performance of their software systems. For each component of a software system, there can be a standalone monitoring tool. But it is often challenging for SREs or DevOps engineers to shift between different tools while debugging an issue that needs to be critically solved.
In this article, we will introduce an open source APM tool - SigNoz, that can be used as a single pane of glass monitoring for your application. But first, let’s learn a bit more about single pane of glass monitoring.
Understanding Single Pane of Glass Monitoring
Single Pane of Glass monitoring refers to a unified dashboard or interface that aggregates data from multiple sources, providing a holistic view of an organization's IT infrastructure. This approach evolved from the need to simplify monitoring in increasingly complex and distributed IT environments.
Understanding the “Why” Behind SPOG
Monitoring tools are not of much help in silos for modern distributed software systems. You can have application logs and metrics from a single host, but the issue can be from a downstream service. Correlating events is key to debugging issues quickly.

Having different tools for different monitoring signals like logs, metrics, and traces is also challenging. You can have one solution for log management and another one for metrics monitoring. But if you’re experiencing a metrics spike at a certain timestamp, you will have to jump between different tools for investigating the event with logs.
Moreover, having multiple monitoring tools slows down engineering teams. It is difficult to onboard newer members, and often there is a dependency on a few members of the team. A tool that provides a single pane of glass to cover all aspects of software systems monitoring is more efficient for debugging applications.
For cloud-native applications, a single pane of glass monitoring can enable engineering teams to act fast while serving as a knowledge base for new team members.
Key components of SPOG monitoring solutions include:
- Data aggregation engines
- Visualization tools
- Analytics and reporting capabilities
- Integration frameworks
SPOG differs from traditional monitoring approaches in several ways:
- Unified view: SPOG provides a centralized interface, while traditional tools often require switching between multiple platforms.
- Cross-system correlation: SPOG can identify relationships between events across different systems, unlike siloed traditional tools.
- Customizable dashboards: SPOG offers flexible, user-specific views, whereas traditional tools often have fixed layouts.
Benefits of Single Pane of Glass Monitoring
Implementing SPOG monitoring offers several advantages:
- Improved visibility: Get a comprehensive view of your entire IT infrastructure — from on-premises systems to cloud services.
- Enhanced collaboration: DevOps, SecOps, and ITOps teams can work together more effectively with shared access to unified data.
- Faster incident response: Quickly identify and resolve issues by correlating data from multiple sources in real-time.
- Streamlined decision-making: Make informed choices based on consolidated data and comprehensive insights.
Challenges in Implementing SPOG Monitoring
While SPOG monitoring offers significant benefits, it also presents some challenges:
- Integration complexities: Connecting diverse tools and systems can be technically challenging and time-consuming.
- Data normalization: Ensuring consistent data formats and meanings across different sources requires careful planning and execution.
- Information overload: Without proper design, users may struggle to find relevant information amid vast amounts of data.
- Balancing depth and breadth: Striking the right balance between detailed insights and high-level overviews can be difficult.
One concern that organizations have while selecting a single monitoring tool is that of creating vendor lock-in.
Open source tools provide a way out. In fact, OpenTelemetry, an open source project that aims to standardize the way telemetry data is generated, is solving this particular problem.
Challenges with Open Source Monitoring Tools
There are popular open source monitoring tools out there. For example, we have:
- Prometheus for metrics monitoring
- Jaeger for distributed tracing
While these tools are great at their specific use cases, they do not provide a single pane of glass monitoring experience. Moreover, the user experience of most open source tools does not match up to their SaaS counterparts. As monitoring is a critical part of the DevOps culture, organizations need tools that work out of the box. And that’s why we built SigNoz - an open source APM built on OpenTelemetry to provide a single pane of glass monitoring experience.
An open source APM for Single Pane of Glass Monitoring
OpenTelemetry is what makes a true single pane of glass practical: because metrics, logs, and traces are all collected in one vendor-neutral OTLP pipeline, a backend like SigNoz can correlate them in one place instead of stitching together separate metrics, logging, and tracing tools.
SigNoz is a full-stack open source APM. Using SigNoz, you can set up a single pane of glass monitoring. SigNoz is built to support OpenTelemetry natively.
OpenTelemetry is an open source project under Cloud Native Computing Foundation that is very suited to instrument cloud-native applications for telemetry data. OpenTelemetry provides freedom to choose any backend analysis tool freeing you from any vendor lock-in.
SigNoz provides logs, metrics, and traces under a single pane of glass. You can also correlate metrics and traces easily with a single click. You can also create custom dashboards for monitoring your infrastructure. Let’s see how SigNoz fits the case for a single pane of glass monitoring with its features.
Application Performance Monitoring
SigNoz APM comes with out-of-box charts for key application metrics powered by OpenTelemetry.Get latency, requests per second, error percentage, apdex & other key metricsto understand your application performance.

Distributed Tracing
Distributed tracing is an important technology aimed at solving performance issues in distributed systems like applications based on microservices architecture. SigNoz provides the popular Flamegraph and Gantt chart view that breaks down a user request into all its components as it travels across services and protocols.

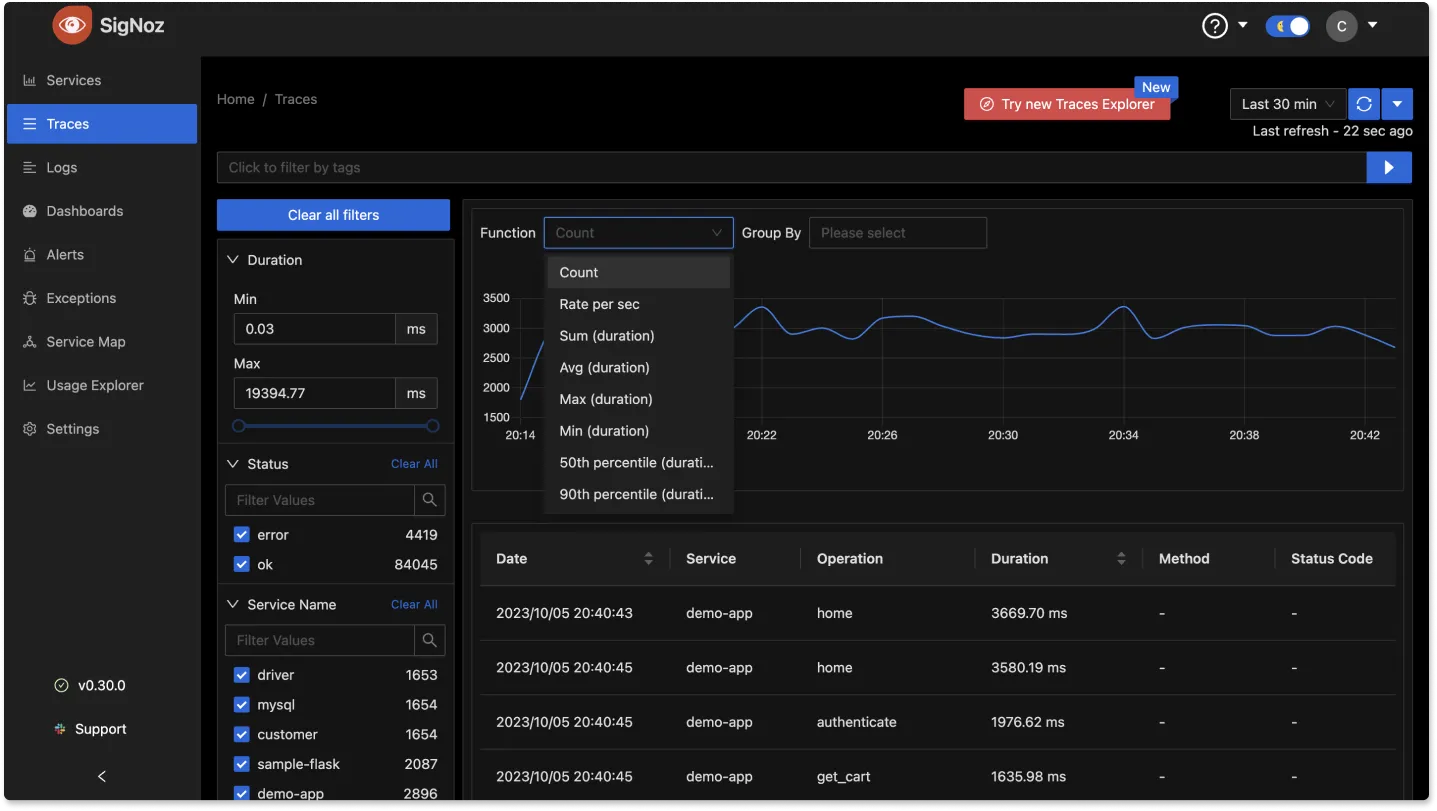
SigNoz also lets you run aggregates on trace data. Running aggregates on tracing data enables you to create service-centric views, providing insights to debug applications at the service level. It also makes sense for engineering teams as they own specific microservices.
Log Management
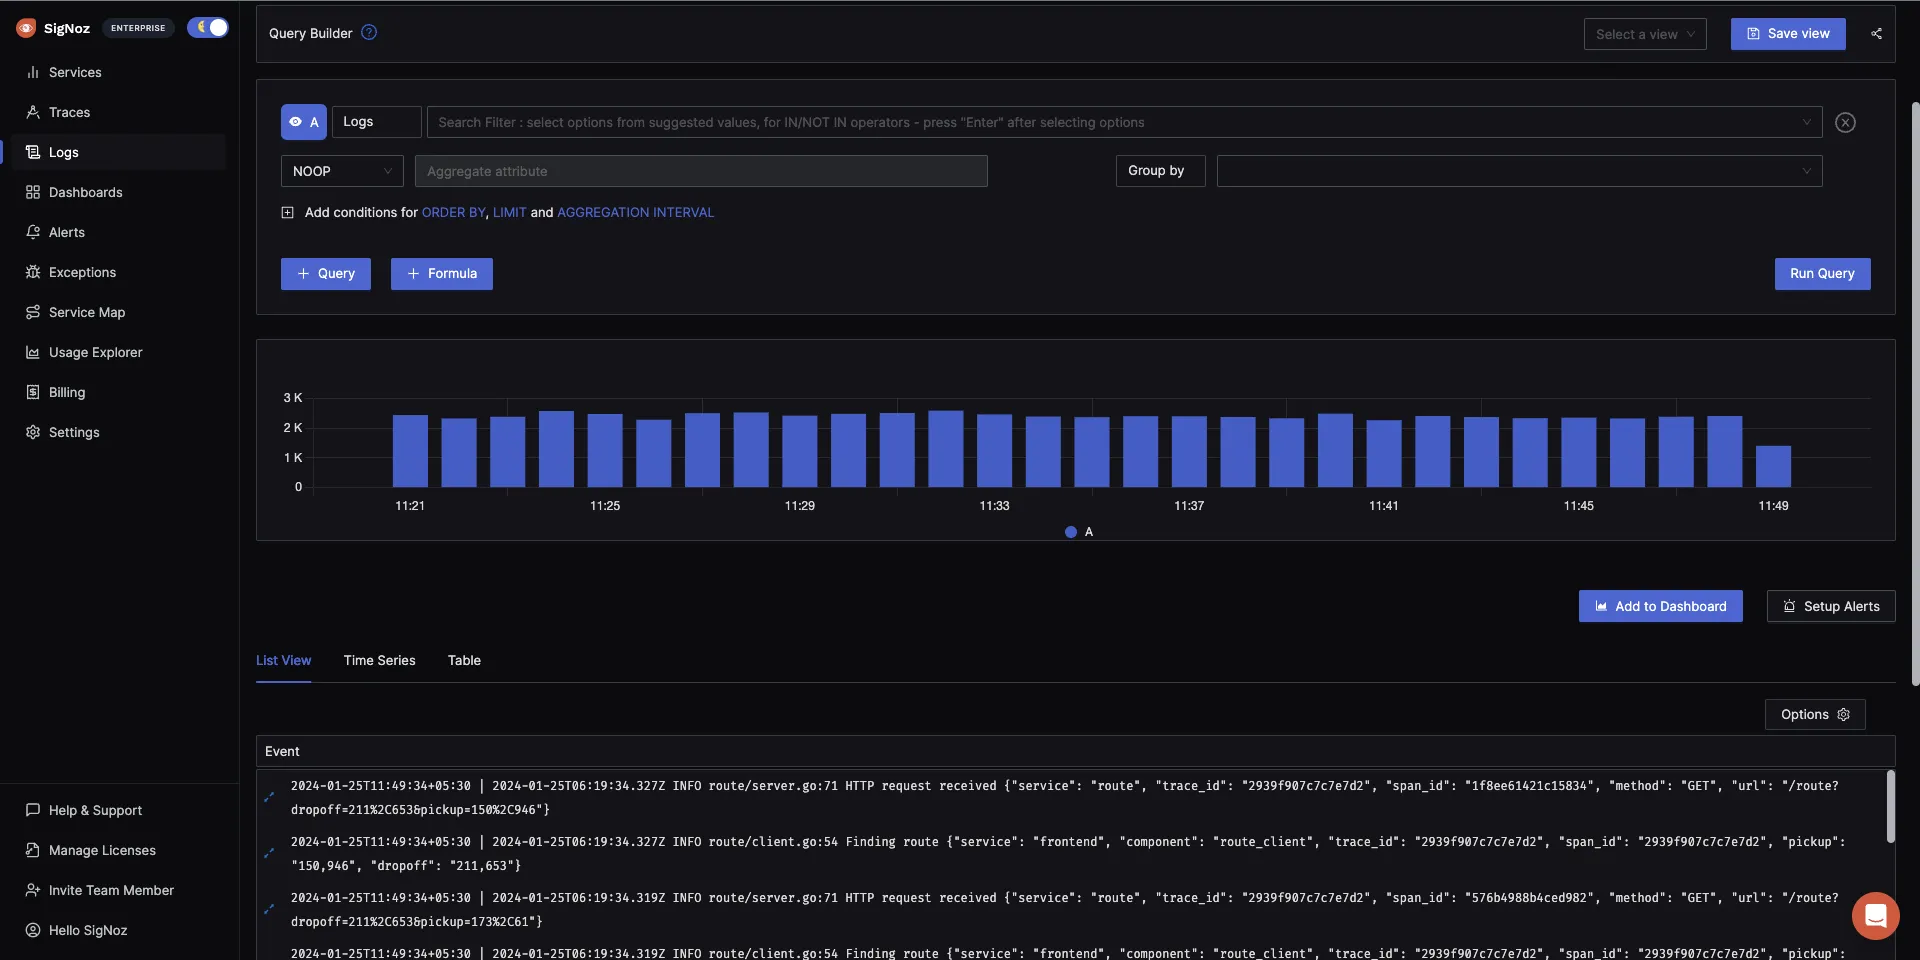
Logs are part of every developer's workflow, and gives the most granular information to debug applications quickly. Logs, metrics, and traces are often touted as three pillars of observability. But at its core, observability is about solving application issues fast. And rather than three pillars, logs, metrics, and traces can act as a single mesh that when correlated intelligently can help developers solve application issues quickly.
SigNoz also provides log management with advanced features like log query builder, search across multiple fields, structured table view, JSON view, etc.
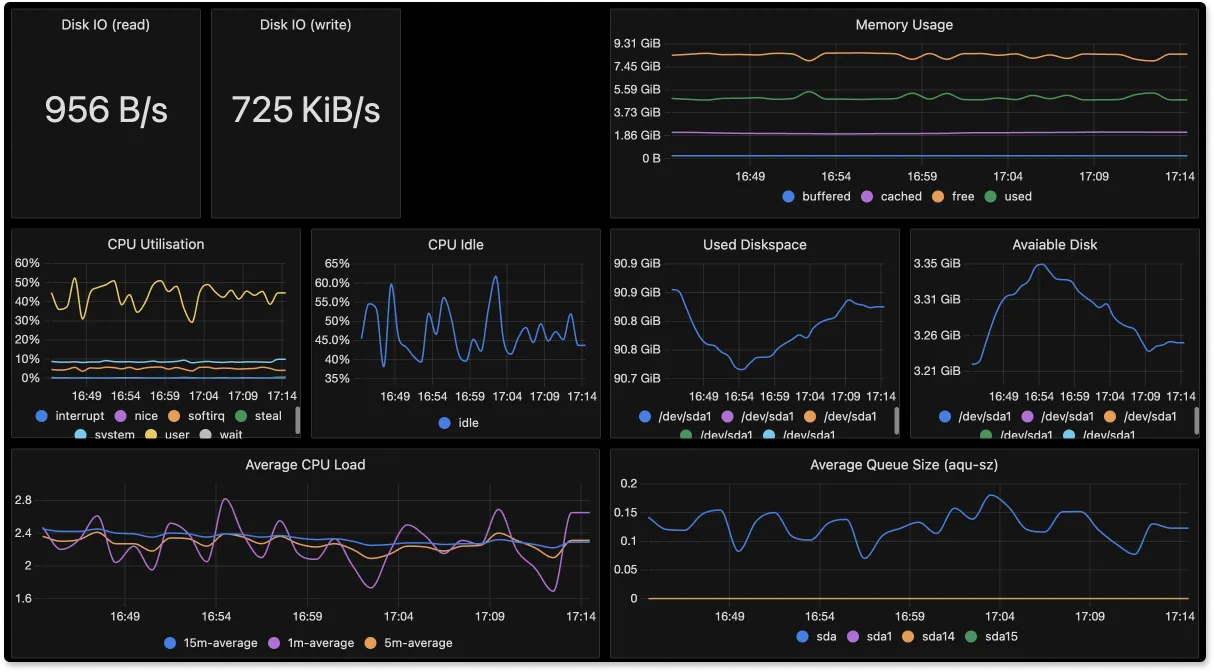
Infrastructure Monitoring
OpenTelemetry provides receivers for receiving metrics from metrics exporters of a lot of common technologies. Using these receivers, you can build custom dashboards for your infrastructure with SigNoz.
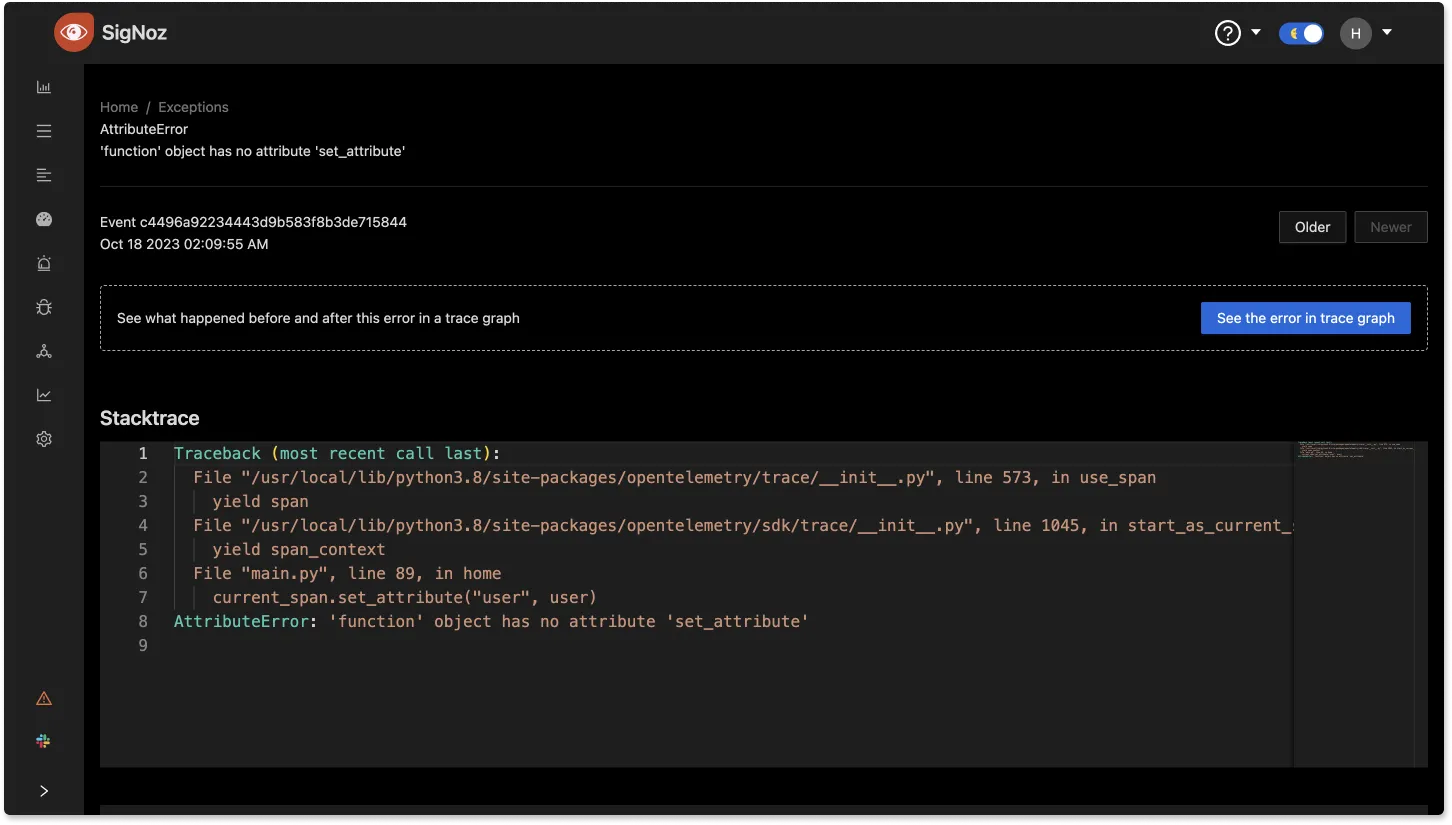
Exceptions & Errors
SigNoz can also help you monitor exceptions in your application code. You can monitor popular exceptions like SSLError, ZeroDivisionError, MaxRetryError, etc., occurring in your application code in one place.
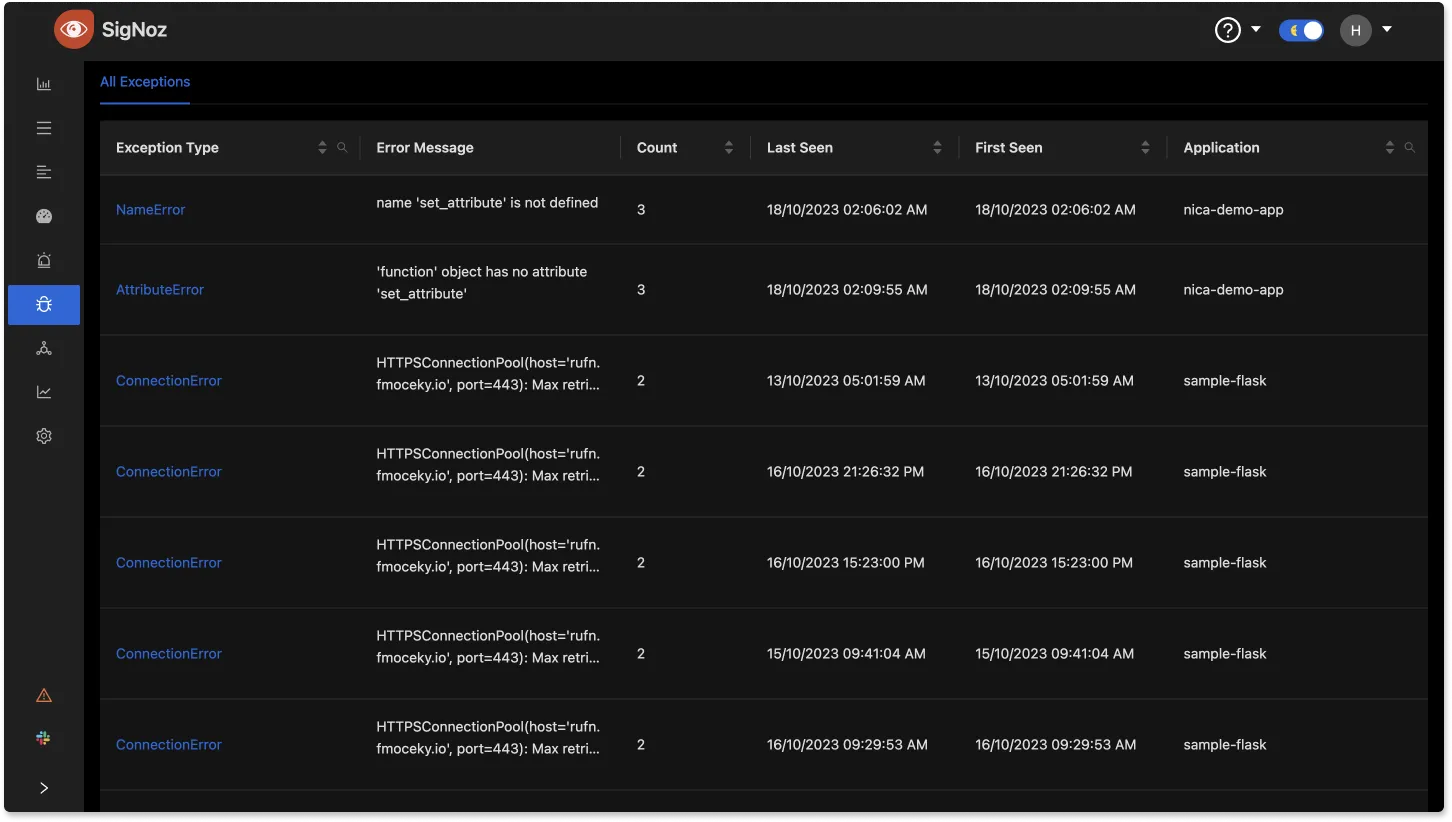
You can also dig deeper into the exceptions with its stacktrace.
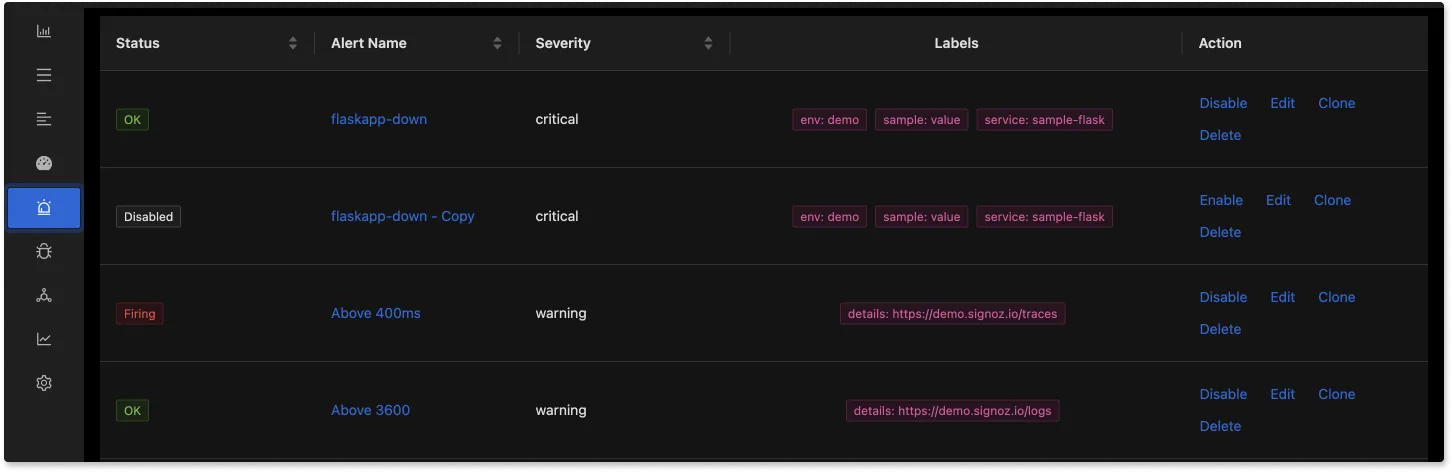
Alerts
You can also set alerts on critical metrics to stay on top of your performance issues.
Getting started with Single Pane of Glass Monitoring
To get started with SigNoz:
-
SetUp SigNoz
SigNoz Cloud is the easiest way to run SigNoz. Sign up for a free account and get 30 days of unlimited access to all features.

You can also install and self-host SigNoz yourself since it is open-source. With 24,000+ GitHub stars, open-source SigNoz is loved by developers. Find the instructions to self-host SigNoz.
-
Follow the installation instructions for your preferred deployment method
-
Configure your applications to send data to SigNoz
-
Set up custom dashboards and alerts
SigNoz offers both cloud and self-hosted options. The cloud version provides easier setup and maintenance, while the self-hosted version offers more control and customization.
You can visit our documentation for instructions on how to install SigNoz using Docker Swarm and Helm Charts.

You can check out the SigNoz GitHub repo here:

Best Practices for Implementing SPOG Monitoring
Follow these best practices to ensure a successful SPOG monitoring implementation:
- Define clear objectives: Establish specific goals and Key Performance Indicators (KPIs) for your monitoring efforts.
- Select the right tools: Choose solutions that integrate well with your existing infrastructure and meet your specific needs.
- Ensure data quality: Implement processes to validate and clean data before it enters your SPOG system.
- Train your team: Provide comprehensive training to ensure all users can effectively leverage the SPOG platform.
Future Trends in Single Pane of Glass Monitoring
The future of SPOG monitoring looks promising, with several emerging trends:
- AI-driven insights: Expect more advanced predictive analytics and automated root cause analysis.
- User experience focus: SPOG tools will increasingly incorporate digital experience monitoring to provide end-to-end visibility.
- Business metrics integration: Future SPOG solutions will likely include more business-oriented KPIs alongside technical metrics.
- Enhanced automation: Look for increased self-healing capabilities and automated incident response features.
Key Takeaways
| Aspect | SPOG Monitoring | Traditional Monitoring |
|---|---|---|
| Interface | Unified dashboard integrating multiple data sources | Multiple separate tools and interfaces |
| Data Integration | Centralizes data from various sources into a single view | Data often siloed in separate systems |
| Cross-system Correlation | Easily correlates events and metrics across different systems | Limited or manual correlation between separate monitoring tools |
| Incident Response | Faster incident detection and response due to unified view | Slower response times due to switching between tools |
| Scalability | Designed to handle complex, distributed systems at scale | May struggle with large-scale, distributed architectures |
| Customization | Highly customizable dashboards and views | Often limited to pre-defined views or requires separate customization for each tool |
| Team Collaboration | Facilitates collaboration across different IT teams (DevOps, SecOps, ITOps) | Can create silos between teams using different tools |
| Cost | Initially higher investment, potentially lower long-term TCO | Lower initial costs, but potentially higher long-term costs due to multiple tools |
| Implementation Complexity | More complex initial setup and integration | Simpler to implement individual tools, but more complex overall ecosystem |
| Learning Curve | Steeper initial learning curve, but unified skills across systems | Easier to learn individual tools, but requires knowledge of multiple systems |
| Data Consistency | Provides a single source of truth across systems | Potential for inconsistencies between different monitoring tools |
| Root Cause Analysis | Faster and more comprehensive due to integrated data | More time-consuming, requiring correlation across multiple tools |
| Alerting | Centralized alerting with context from multiple systems | Separate alerting systems that may not provide full context |
| Reporting | Comprehensive reports drawing from all integrated data sources | Separate reports from each tool, requiring manual consolidation |
| Vendor Management | Typically involves fewer vendors or a single open-source solution | Often requires managing multiple vendor relationships |
- SPOG monitoring unifies multiple data sources into a single, comprehensive view.
- It improves collaboration, speeds up incident response, and enhances decision-making.
- Implementing SPOG requires careful planning, integration, and team training.
- Open-source solutions like SigNoz offer flexible SPOG monitoring options.
- The future of SPOG monitoring includes AI-driven insights and expanded scope.
To go deeper: if you're still mapping out the space, observability vs monitoring clarifies how the two relate, and what is APM covers the fundamentals before you compare APM tools and open source APM tools. On the signals themselves, distributed tracing explains how requests are followed across services, while traces vs metrics helps you decide which to reach for. And for shifting from firefighting to staying ahead of incidents, see proactive monitoring.
FAQs
What is the main advantage of Single Pane of Glass monitoring?
The primary advantage of SPOG monitoring is its ability to provide a unified view of an organization's entire IT infrastructure, enabling faster problem resolution and better decision-making.
How does SPOG monitoring differ from traditional monitoring tools?
SPOG monitoring consolidates data from multiple sources into a single interface, while traditional tools often focus on specific systems or metrics in isolation.
Can SPOG monitoring solutions integrate with existing IT infrastructure?
Yes, most SPOG monitoring solutions offer integration capabilities with a wide range of existing tools and systems. However, the ease of integration can vary depending on the specific solution and your infrastructure.
Is it possible to implement SPOG monitoring for both on-premises and cloud environments?
Absolutely. Many SPOG monitoring solutions are designed to work across hybrid environments, providing visibility into both on-premises and cloud-based systems from a single interface.
What is Single Pane of Glass (SPOG) Monitoring?
Single Pane of Glass (SPOG) Monitoring is a unified dashboard or interface that aggregates data from multiple sources, providing a holistic view of an organization's IT infrastructure. It allows monitoring of entire software systems through a comprehensive set of dashboards in a single tool.
Why is SPOG Monitoring important for modern applications?
SPOG Monitoring is crucial for modern applications because:
- It simplifies monitoring of complex, distributed software systems.
- It enables quick correlation of events across different components.
- It improves collaboration between different teams (DevOps, SecOps, ITOps).
- It speeds up incident response and decision-making processes.
What are the key benefits of implementing SPOG Monitoring?
The main benefits of SPOG Monitoring include:
- Improved visibility across the entire IT infrastructure.
- Enhanced collaboration between different teams.
- Faster incident response times.
- Streamlined decision-making based on consolidated data.
- Simplified management of complex, distributed systems.
What challenges might organizations face when implementing SPOG Monitoring?
Common challenges in implementing SPOG Monitoring include:
- Integration complexities when connecting diverse tools and systems.
- Data normalization to ensure consistent formats across different sources.
- Potential information overload without proper dashboard design.
- Balancing between detailed insights and high-level overviews.
- Avoiding vendor lock-in, which can be mitigated by using open-source solutions.
How does SigNoz provide a Single Pane of Glass Monitoring experience?
SigNoz offers a Single Pane of Glass Monitoring experience by:
- Providing logs, metrics, and traces under a single interface.
- Offering application performance monitoring with out-of-box charts.
- Supporting distributed tracing with Flamegraph and Gantt chart views.
- Including log management with advanced querying and visualization features.
- Enabling custom dashboard creation for infrastructure monitoring.
- Allowing exception and error monitoring in one place.
- Providing alerting capabilities for critical metrics.
Further Reading
