Prometheus vs Grafana - Which Tool is Right for You?
Prometheus and Grafana are popularly used tools for monitoring applications and systems. Prometheus specializes in robust metric collection, monitoring, and alerting, while Grafana excels in data visualization and dashboarding.
Together, they form a powerful duo, allowing users to monitor their systems effectively, analyze metrics comprehensively, and visualize insights intuitively, but how well do these tools perform individually in the Prometheus vs Grafana comparison?

In this article, I have discussed the differences between Prometheus and Grafana regarding important features like data collection, visualization capabilities, data query, and data storage. Finally, I have discussed common use cases to help you decide which tool is best suited for your needs.
Prometheus vs Grafana: Overview
| Features | Prometheus | Grafana |
|---|---|---|
| Data Collection | 🟡 Limited | ✅ Available |
| Visualization Capabilities | 🟡 Limited | ✅ Available |
| Data Query | ✅ Available | ✅ Available |
| Log management | ❌ Does not exist | ✅ Available |
| APM | 🟡 Limited | ✅ Available |
| Data Storage | 🟡 Limited | ✅ Available |
| Alerting | ✅ Available | ✅ Available |
| UI/UX | 🟡 Limited | ✅ Available |
| Cloud Option | ❌ Does not exist | ✅ Available |
| Pricing | ✅ Free | 🟡 Freemium |
| Documentation & Community Support | 🟡 Limited | ✅ Available |
Prometheus and Grafana are powerful tools with distinct strengths:
- Prometheus: Best for collecting metrics like resource usage and providing a cost-effective monitoring solution, especially for smaller teams or projects.
- Grafana: Ideal for visualization, offering a highly customizable dashboarding experience with support for multiple data sources. Grafana Cloud provides a fully managed option for both visualization and monitoring.
For comprehensive monitoring and observability, Grafana, with its integrated stack (including Loki and Tempo), offers a more complete solution, but it can introduce complexity and higher costs. Prometheus remains a solid choice for straightforward metrics collection and monitoring.
Let's dive deep into each parameter mentioned above for a better understanding.
Ease of Deployment: Tie
Prometheus
Prometheus has different deployment options, which include using pre-compiled binaries on different operating systems (Darwin, Linux, Windows, etc.), using Docker, installing from source, and using configuration management systems like Ansible. It can also be installed using Homebrew, the package manager for macOS.
I deployed Prometheus using Docker; the time this would take will depend on your internet speed as the Prometheus image will be pulled from a Docker registry.
Grafana
Similar to Prometheus, Grafana provides a range of deployment choices for its self-hosted version to accommodate various operating systems using pre-compiled binaries, including Debian or Ubuntu, SUSE or openSUSE, RHEL or Fedora, and more. Grafana can also be deployed by using a Docker image, on Kubernetes, and on macOS using Homebrew or standalone binaries.
I deployed Grafana using Docker; the time this would take will depend on your internet speed, as the Grafana image will be pulled from a Docker registry.
Grafana also has a cloud version known as Grafana Cloud. This version doesn’t require management of Grafana as it is hosted in the cloud, all it takes is for users to sign up and use.
Verdict
Which is easier to deploy between Prometheus vs Grafana?
Both Prometheus and Grafana offer straightforward deployment options with Docker, making them equally easy to deploy.
Data Collection: Grafana Wins
Prometheus
Prometheus excels at collecting data from a diverse range of sources. It uses client libraries to expose metrics via HTTP endpoints, which are then scraped and sent to the Prometheus server.
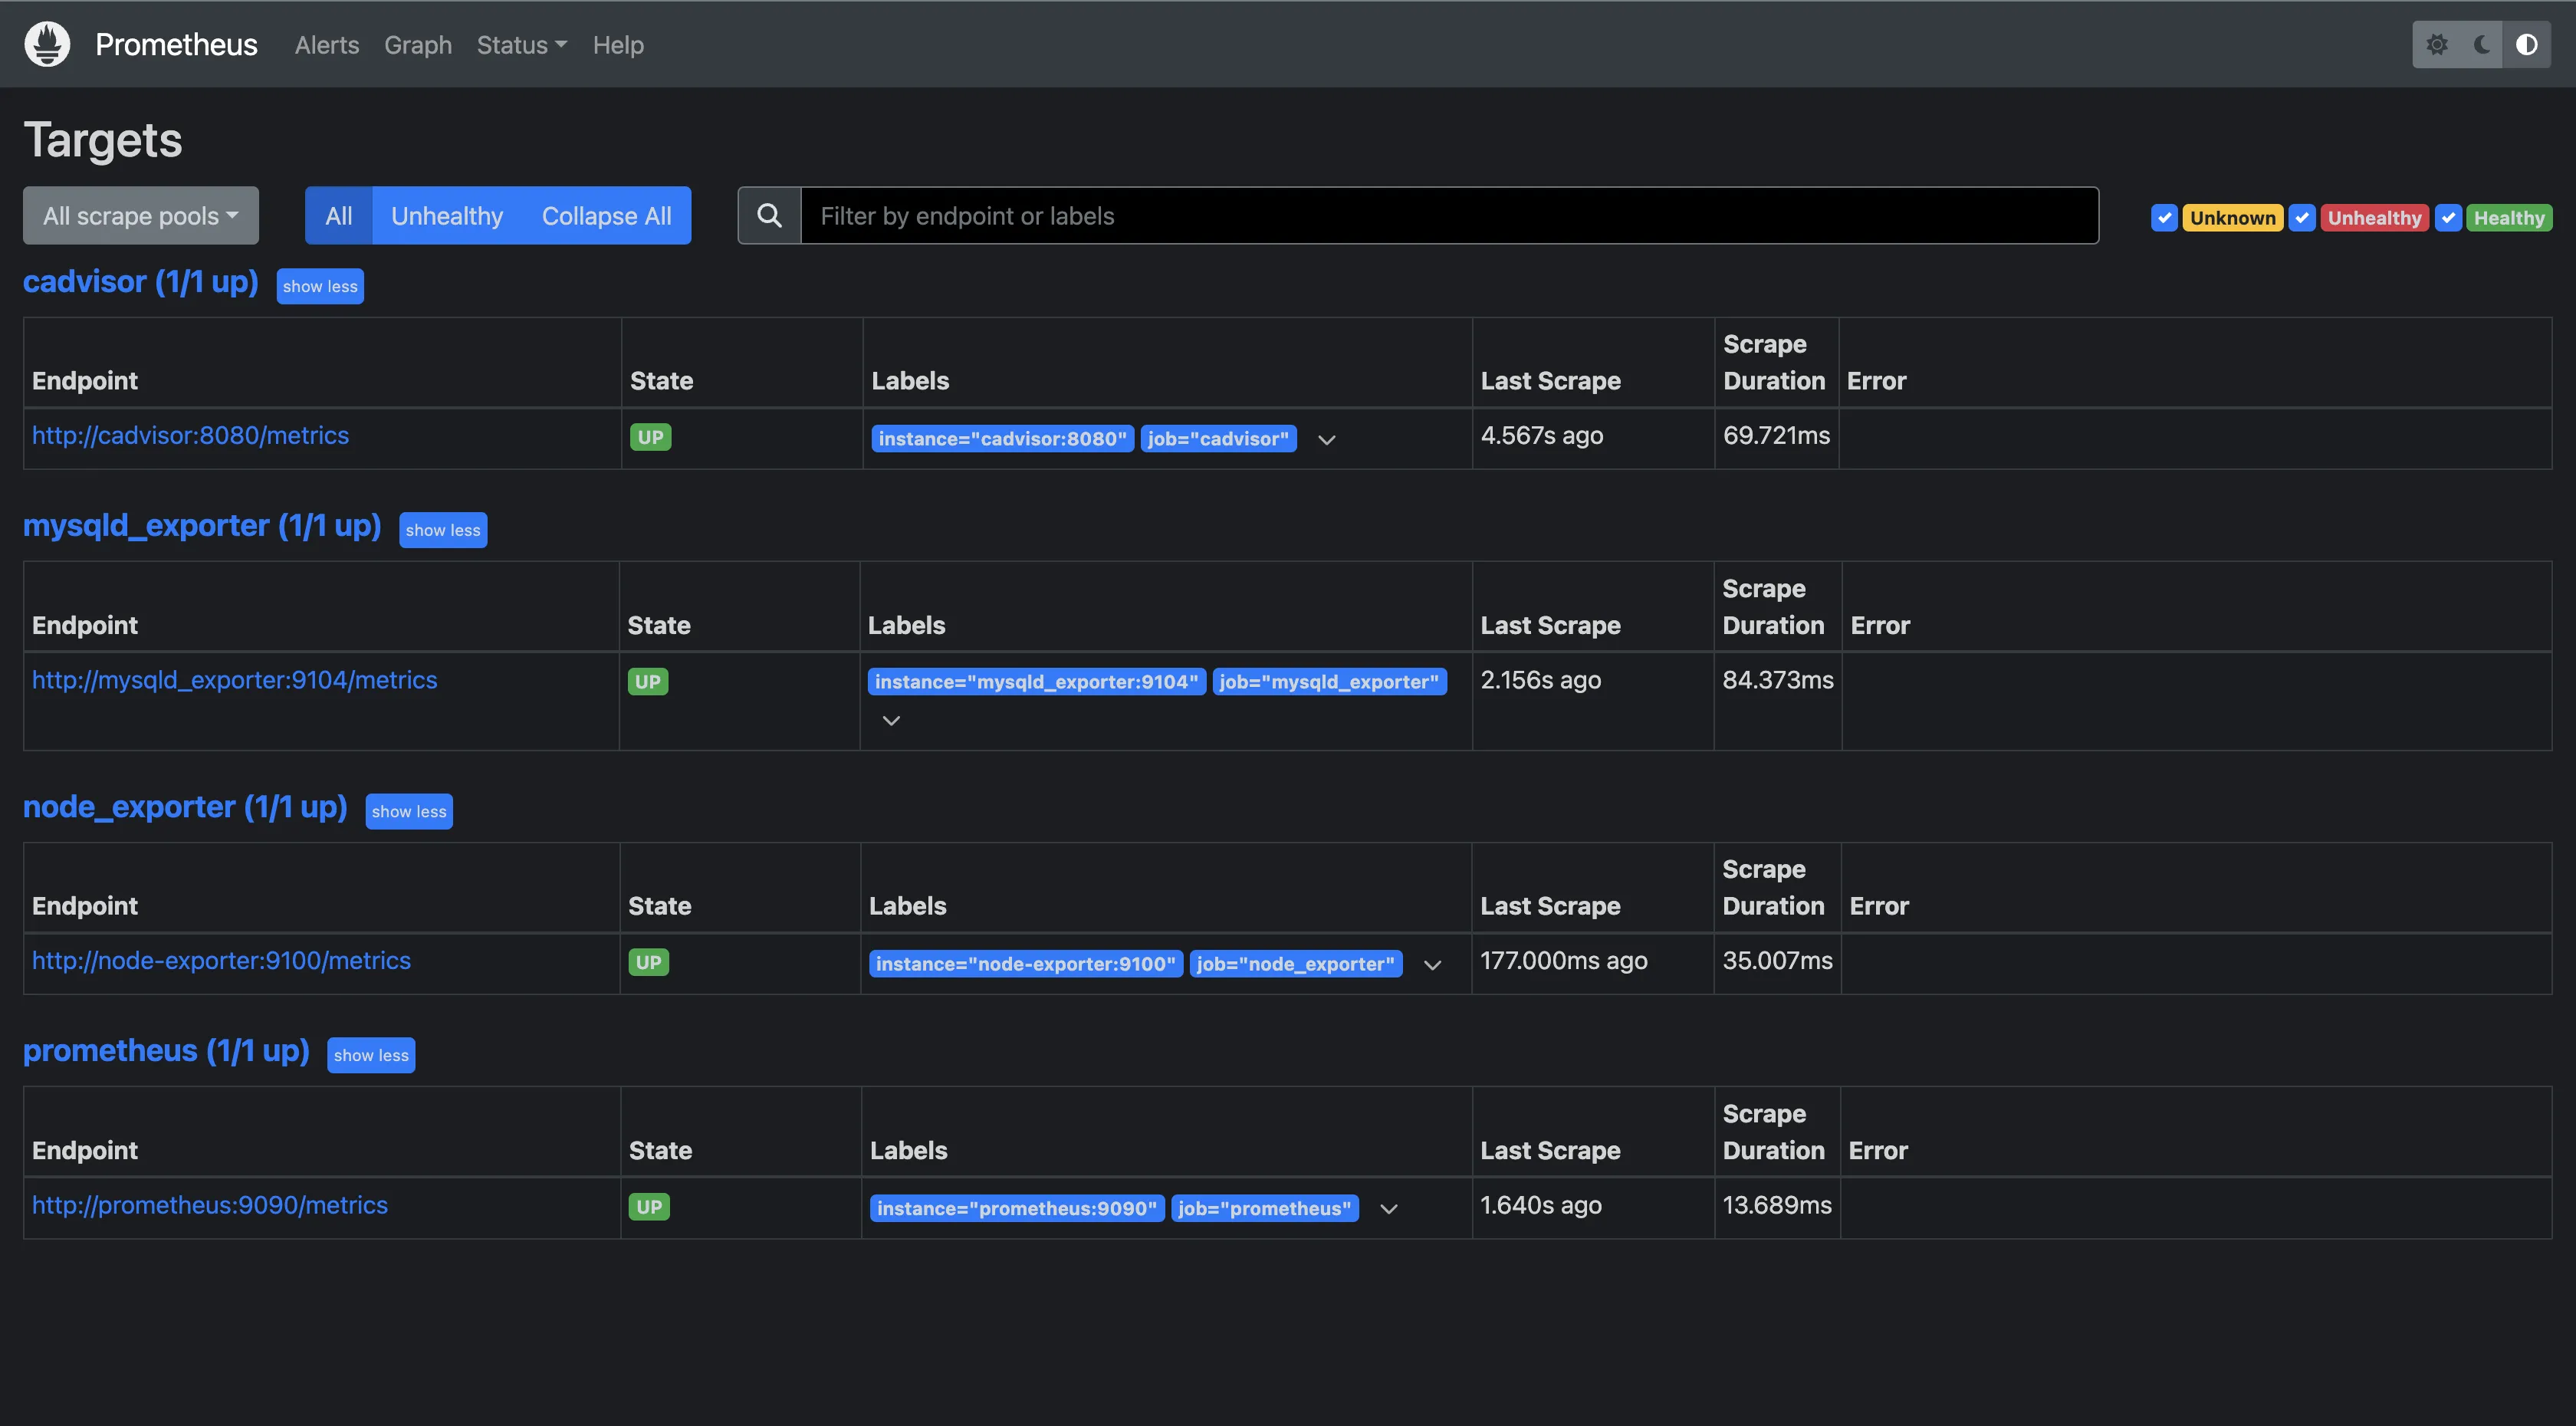
Additionally, it utilizes exporters to transform metrics from third-party systems into a format that Prometheus can process. For dynamic monitoring, Prometheus leverages file-based service discovery to identify and track targets. It also supports remote endpoints for flexible data collection. This approach allows Prometheus to effectively collect metrics from various sources.
Grafana
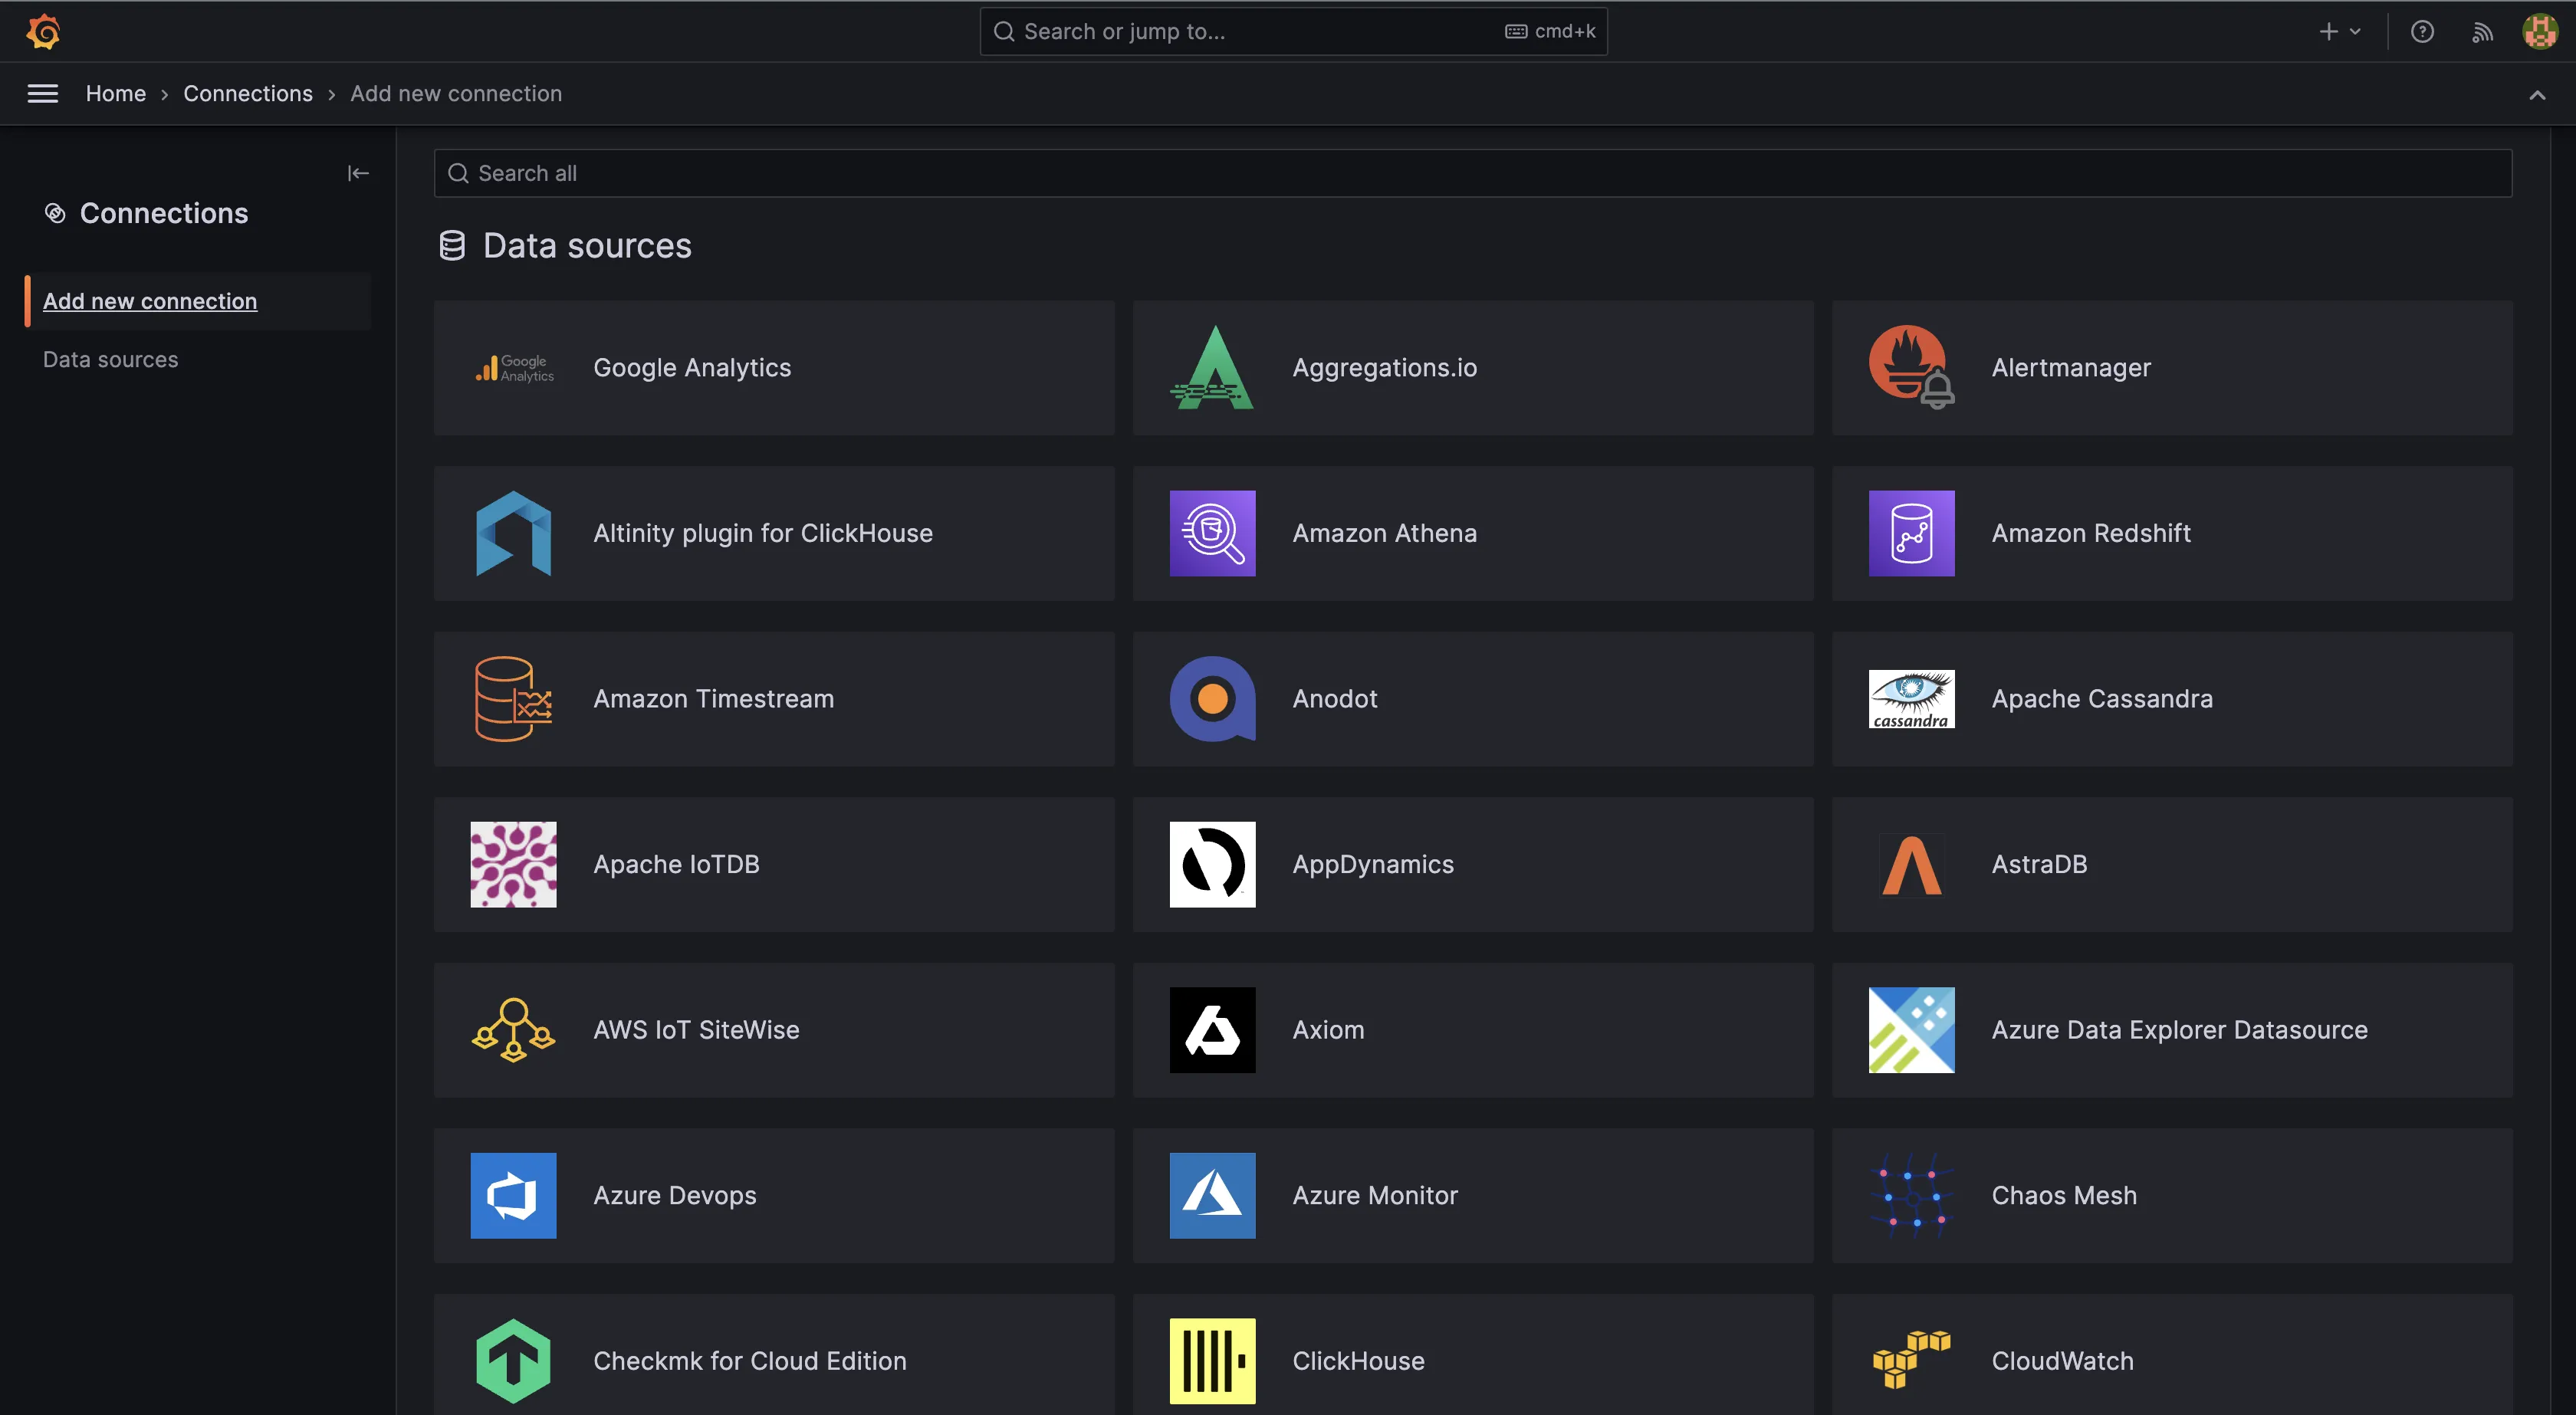
Grafana has built-in support for many data sources. For additional data sources that are not natively supported, Grafana offers a robust ecosystem of data source plugins. These plugins extend Grafana's capabilities, allowing users to integrate a variety of data sources into their dashboards. If a required data source plugin is not available, Grafana's open-source nature enables the development of custom plugins.
Verdict
Which tool has better data collection capabilities between Prometheus vs Grafana?
Prometheus and Grafana both have great data collection capabilities, but Grafana can collect data from a wider range of data sources, making it more versatile.
Migrate from Grafana - Save up to 45% on your Grafana bill
Tired of juggling multiple tools for observability? SigNoz gives you logs, metrics and traces in a single unified platform - making troubleshooting simpler.
Visualization Capabilities: Grafana Wins
Prometheus
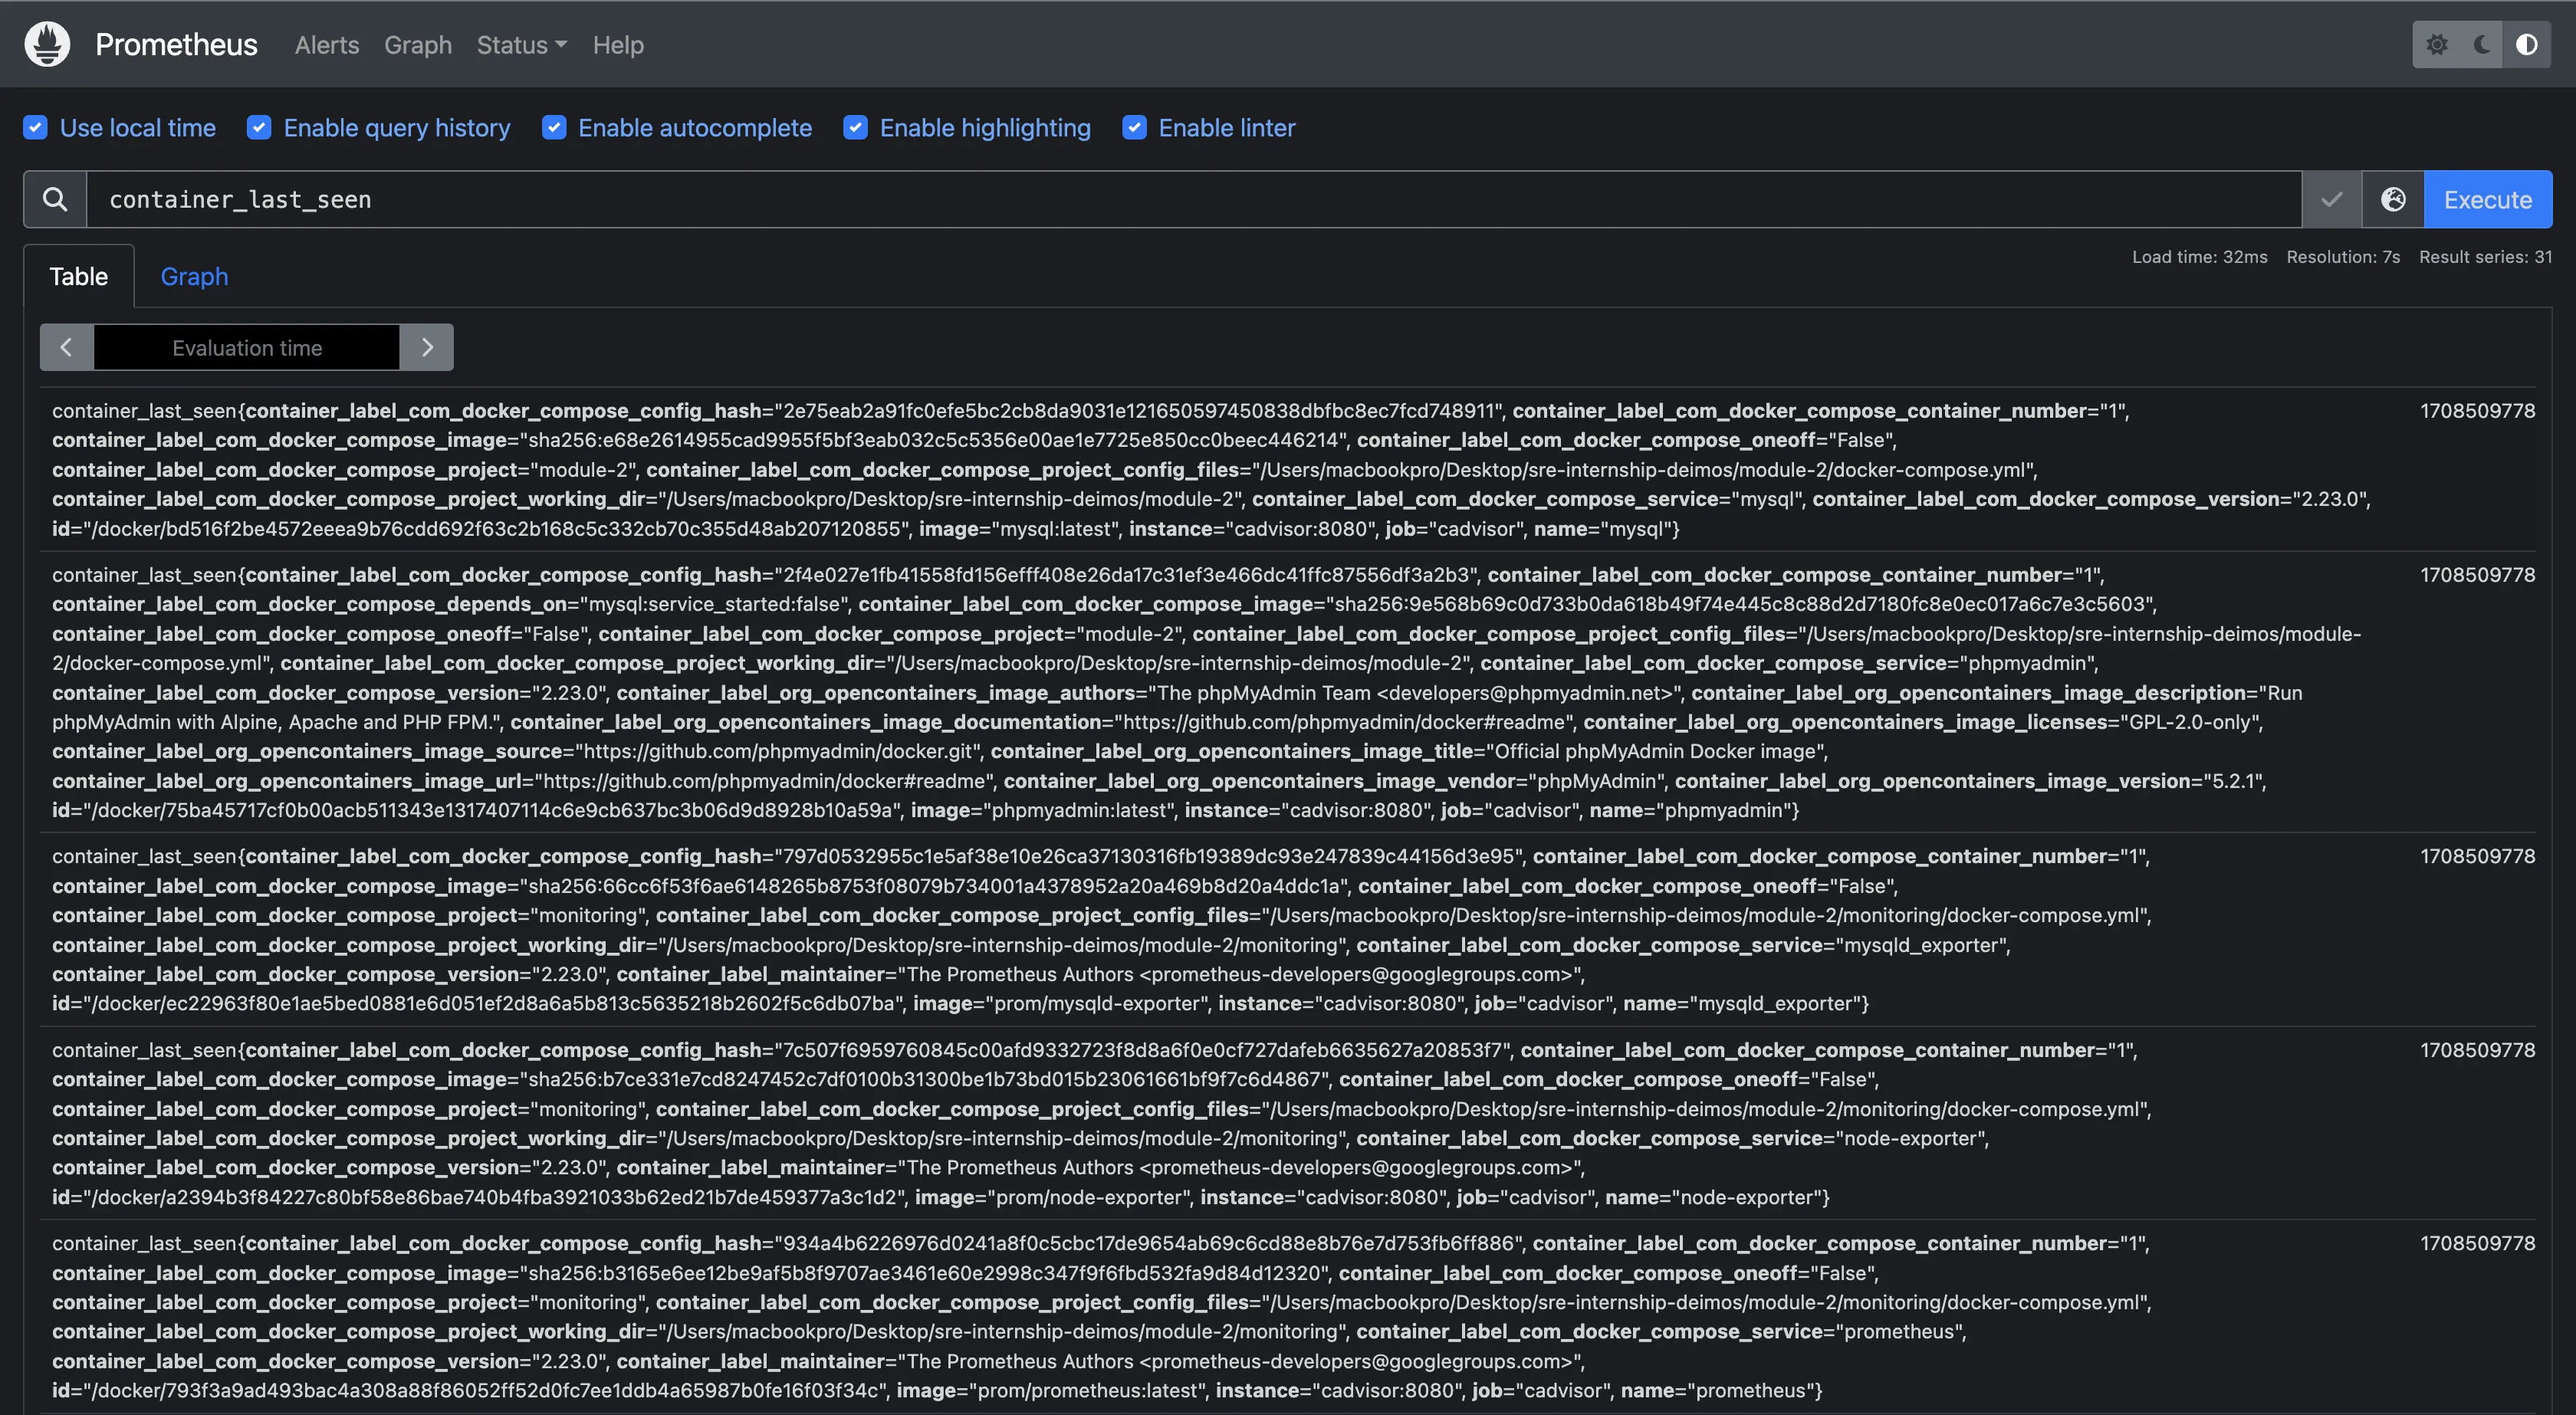
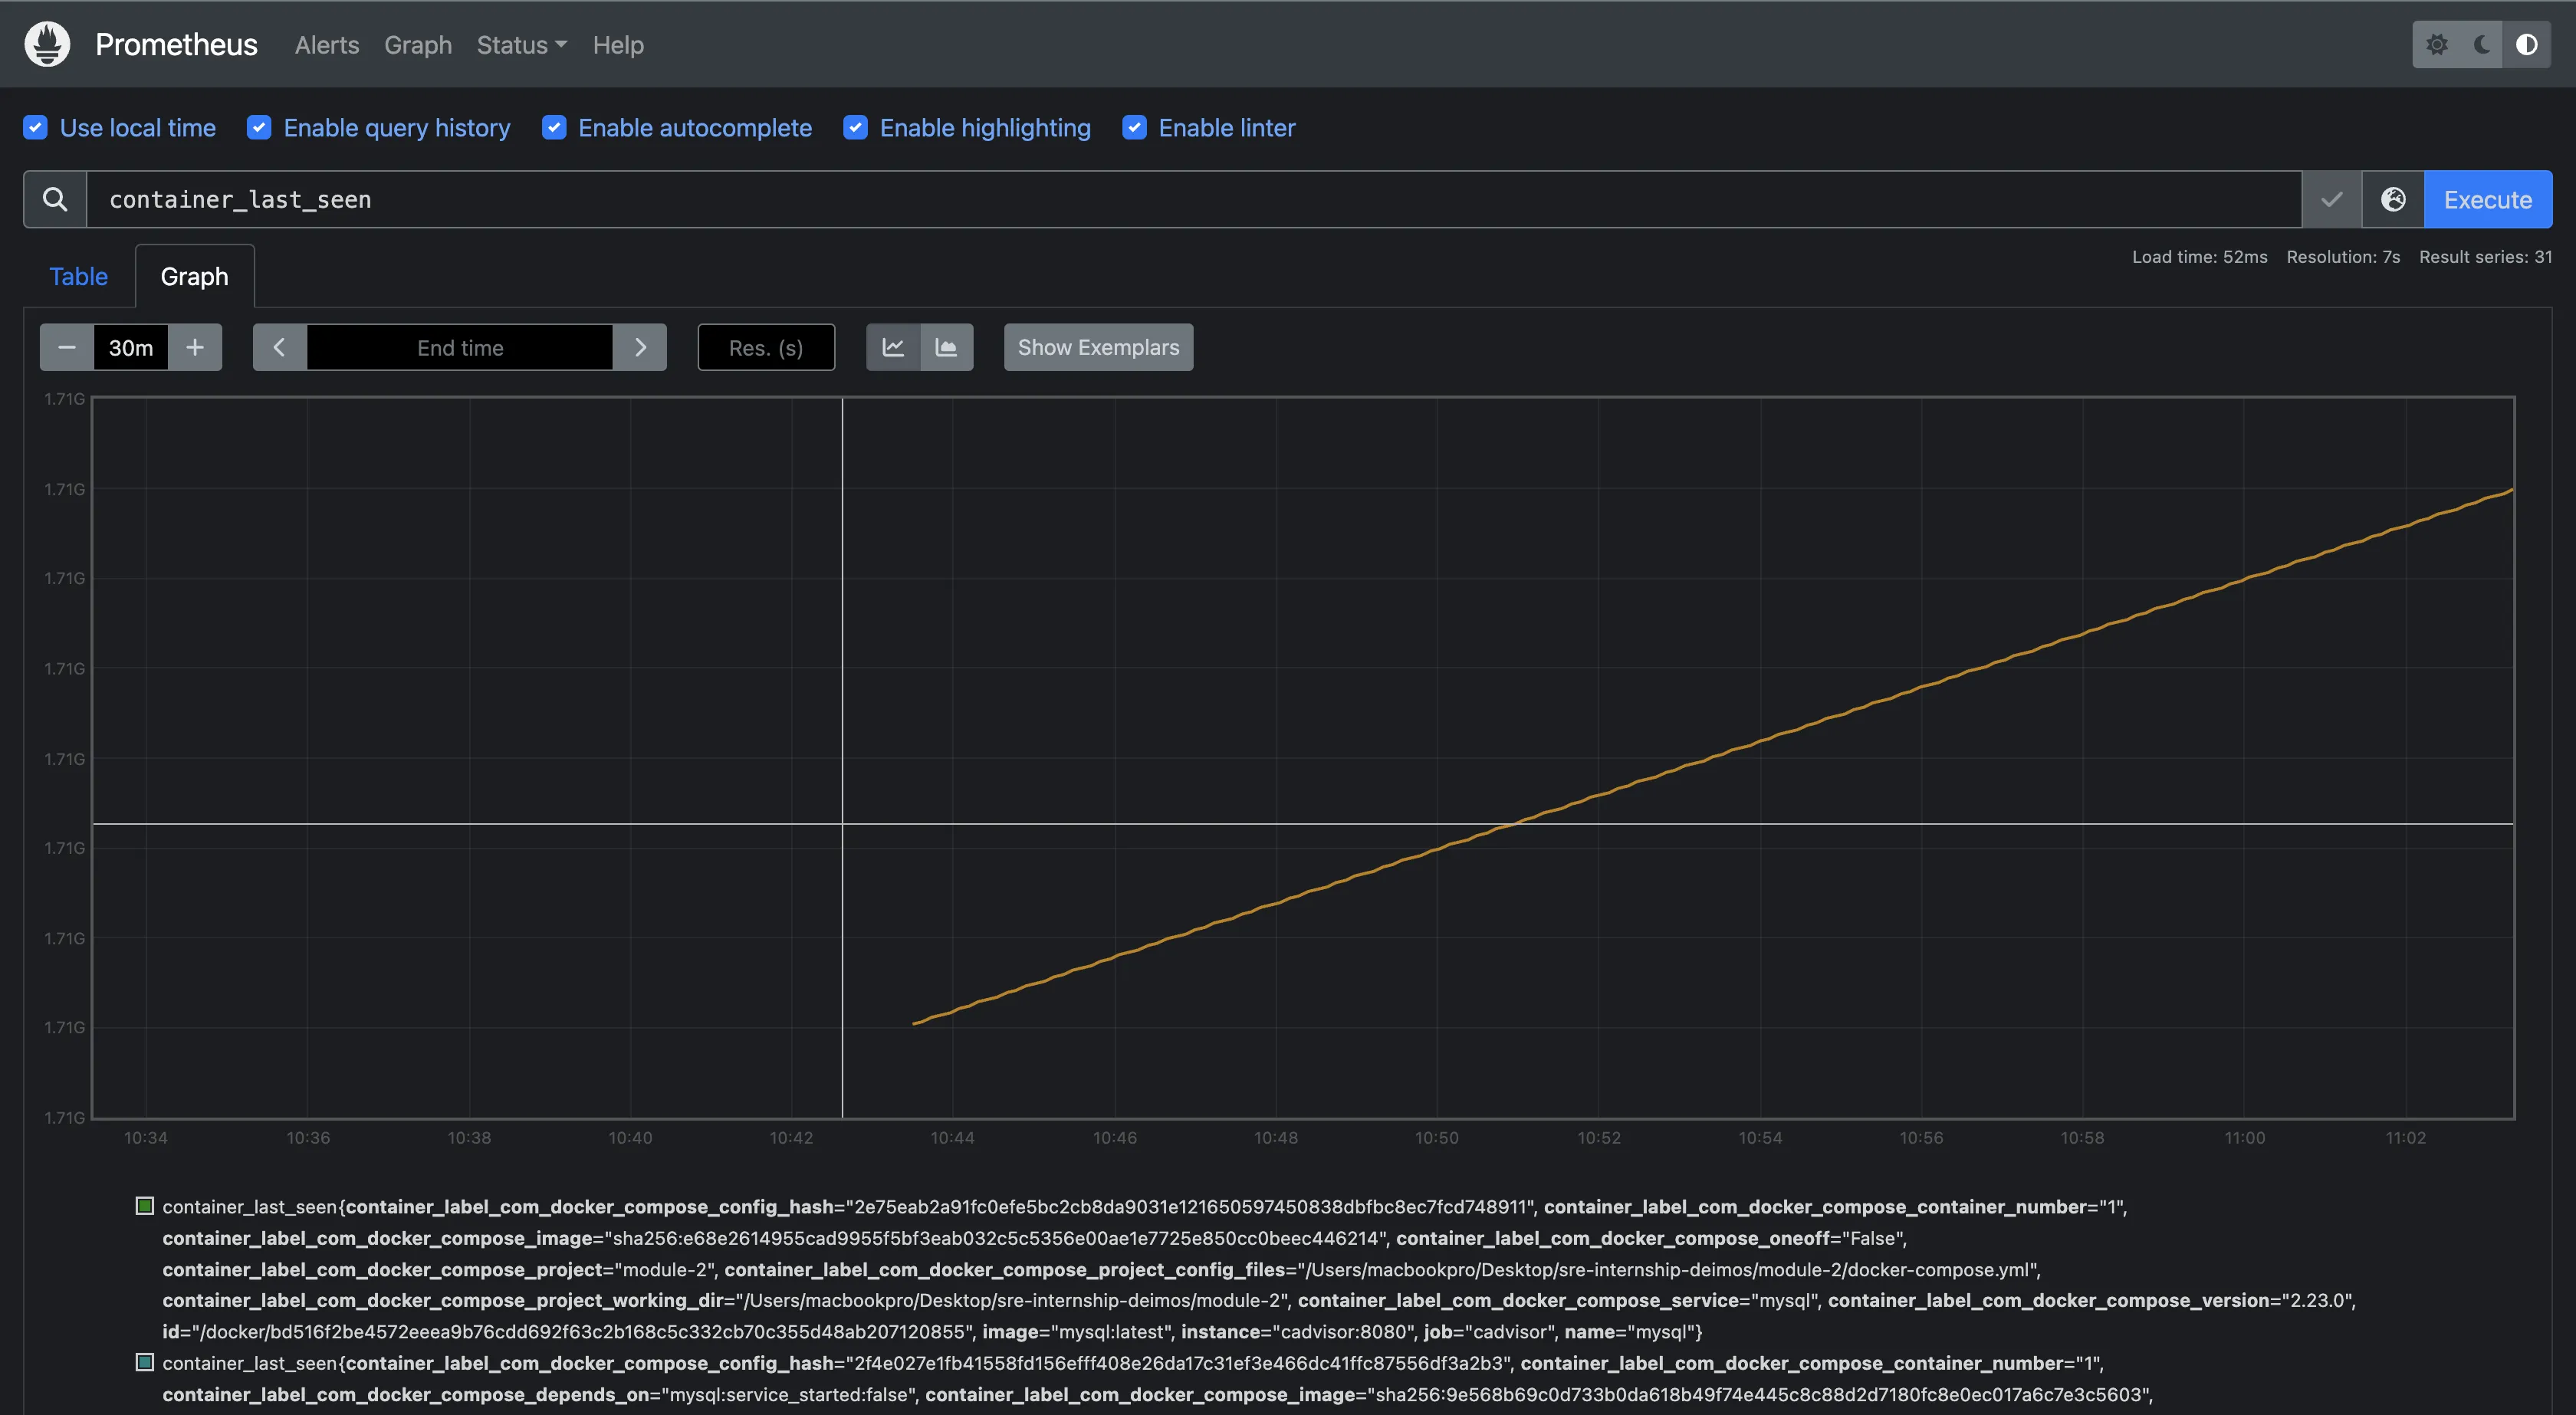
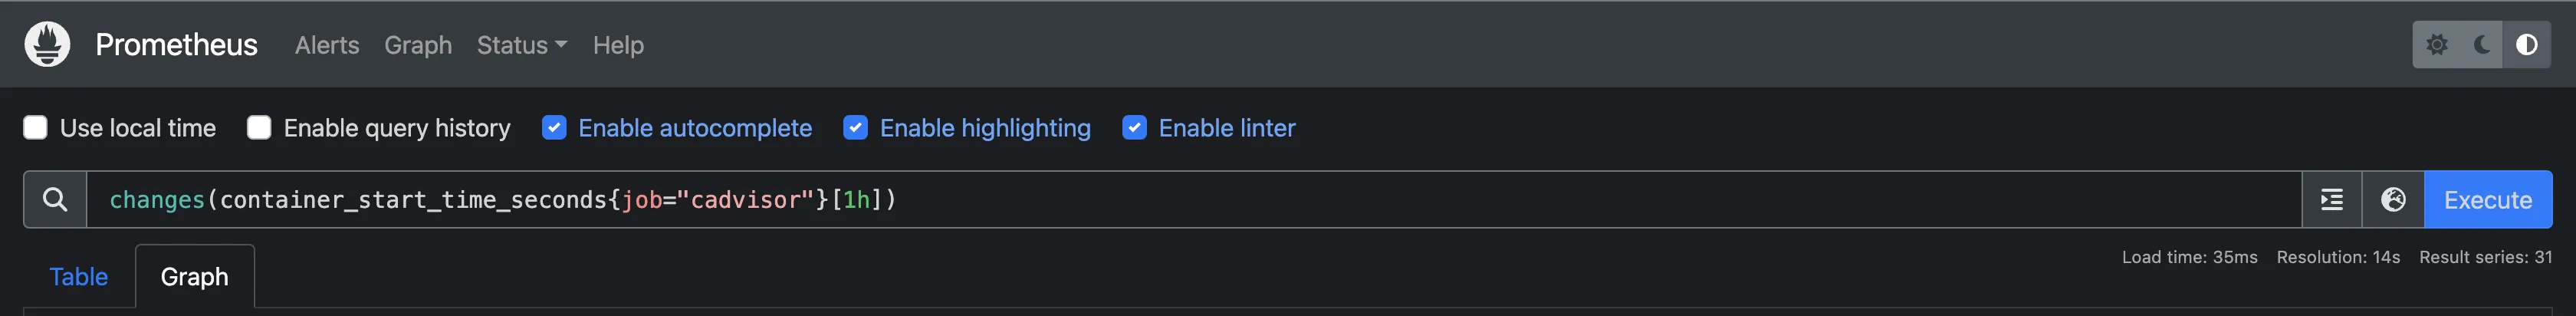
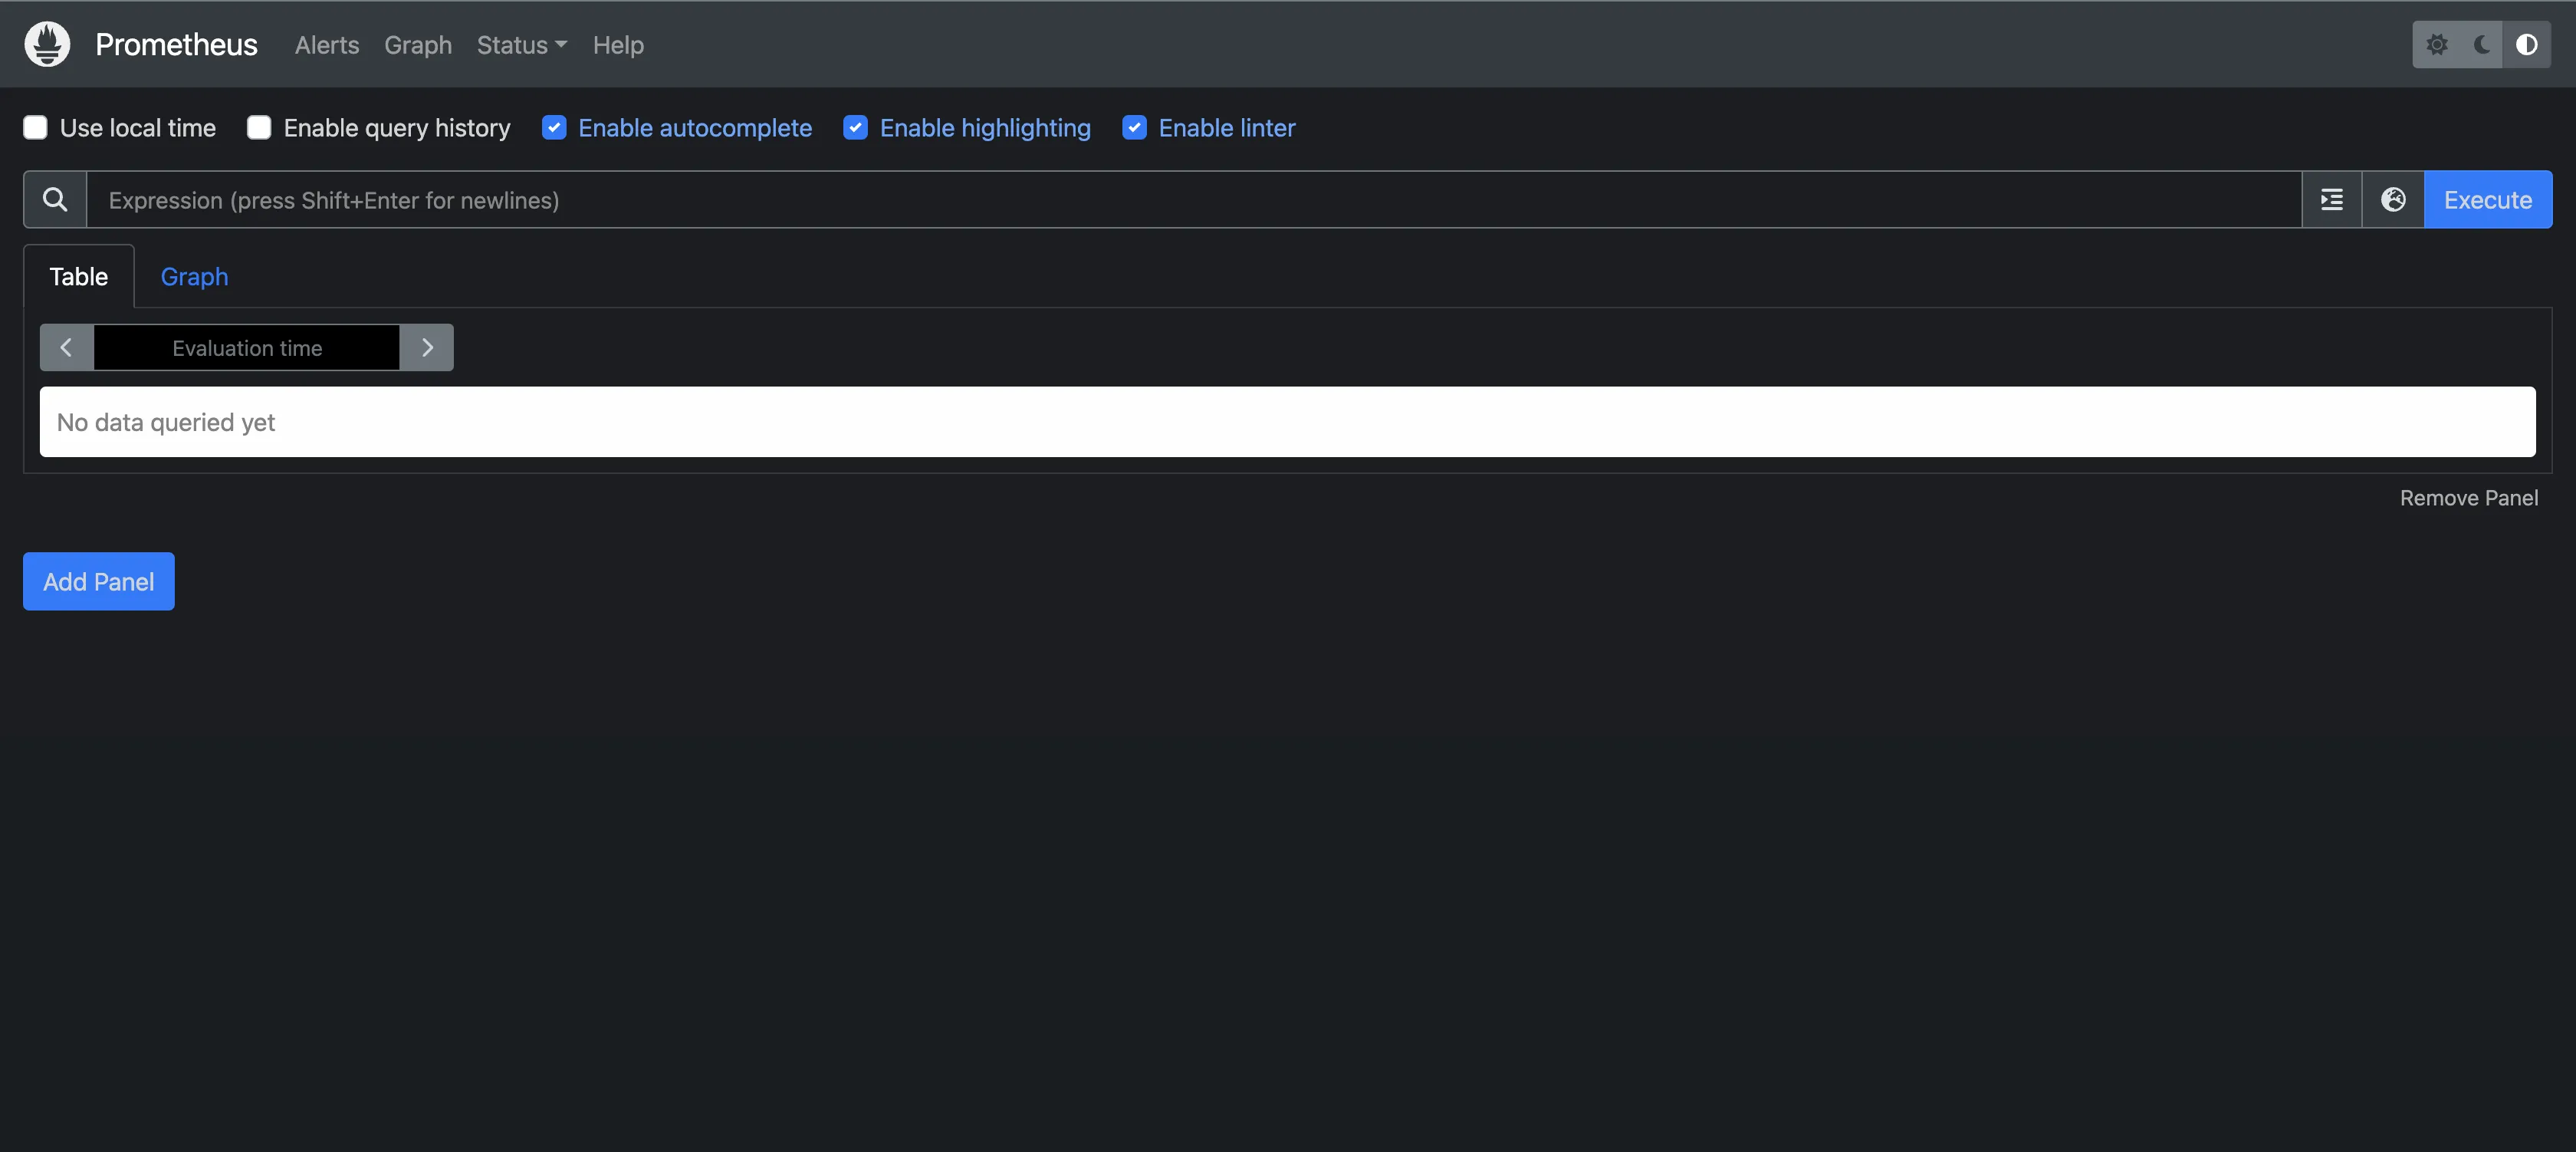
Prometheus has limited visualization capabilities. The built-in expression browser is the primary tool for querying and visualizing data within Prometheus. It offers two main visualization options: a table and a graph. These visualizations are useful for understanding the trends and patterns in the data over time. The expression browser is not as comprehensive or user-friendly as other visualization tools; it’s very basic.
Grafana
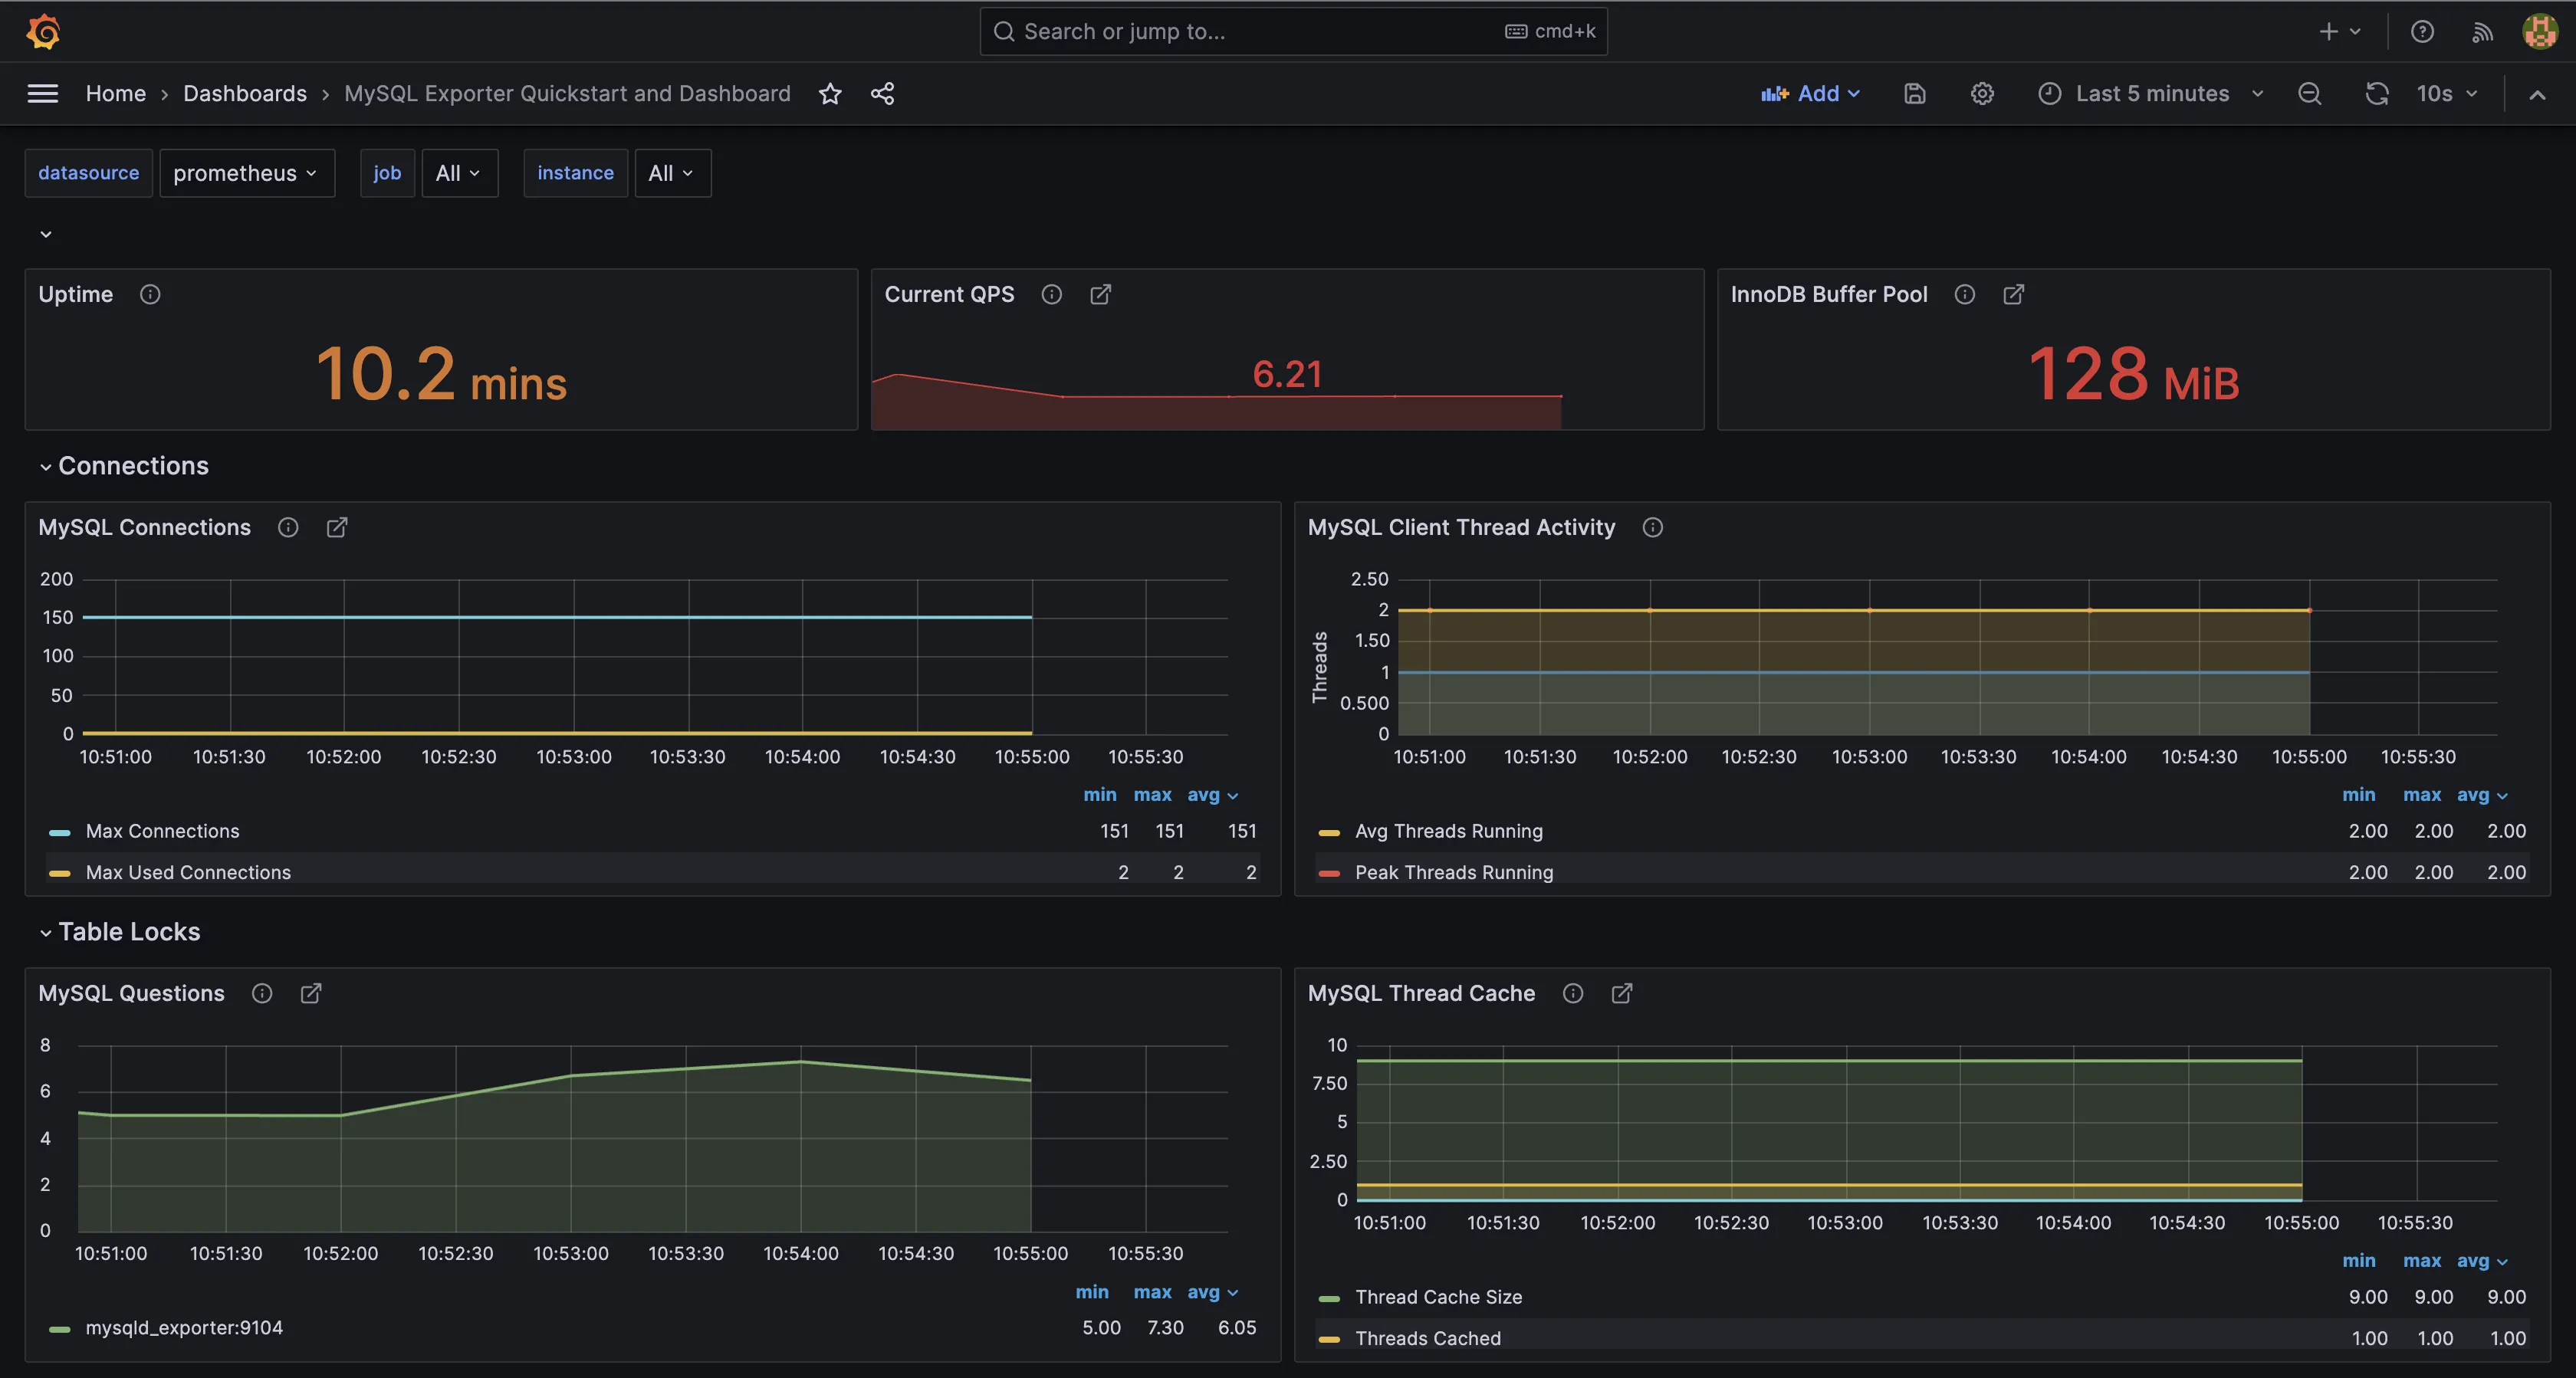
Grafana is known for its excellent visualization capabilities. It offers a wide range of visualization types tailored to different data types, including time series graphs, bar charts, histograms, heat maps, pie charts, candlestick charts, and more.
It can also suggest visualization types based on the queries or data available. This feature presents a preview to users, aiding them in making an informed choice about the type of visualization that best represents their data.
Grafana has highly customizable dashboards, allowing users to fine-tune their visualizations through panel options. Users have the flexibility to add and configure panels, define metrics, and customize the appearance of visual elements to suit their specific needs. These dashboards can also be shared with others, facilitating collaboration for teams.
Verdict
Which tool offers better visualization capabilities between Prometheus vs Grafana?
When comparing Prometheus vs Grafana in terms of visualization capabilities, Grafana is the preferred choice for users seeking robust and versatile visualizations.
Log management: Grafana Wins
Prometheus
Prometheus does not inherently support log management as its primary focus is metrics collection and monitoring. For log management, integrating Prometheus with a dedicated log management solution is recommended.
Grafana
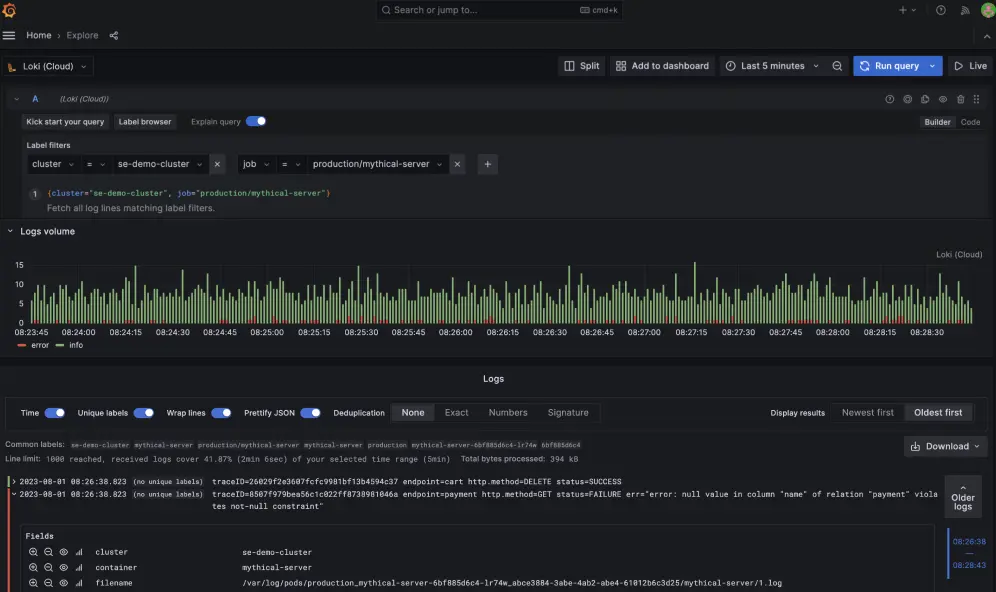
Grafana, in conjunction with Loki, offers a robust solution for log management. Loki, a component of the Grafana stack, is specifically designed for log aggregation. It is inspired by Prometheus and shares its label-based approach to indexing, making it highly scalable and cost-effective.
Loki allows you to store and query logs from all your applications and infrastructure, without worrying about log volumes, costs, or storage limits.
Verdict
Which tool offers better log management between Prometheus vs Grafana?
When it comes to log management in the Prometheus vs Grafana comparison, Grafana, with Loki, provides a comprehensive and scalable solution for aggregating and querying logs.
APM: Grafana Wins
Prometheus
Prometheus primarily focuses on metrics monitoring rather than traditional application performance monitoring (APM) in the way that dedicated APM solutions like Datadog or New Relic do. These dedicated APM solutions offer advanced features like distributed tracing, code-level insights, and user experience monitoring.
While Prometheus can collect metrics related to application performance, such as request latency, error rates, and throughput, it does not provide the same level of detailed tracing and diagnostics that are typically associated with APM tools. Prometheus is more about the "what" (e.g., how many requests are being made, how many errors are occurring) rather than the "why" (e.g., why are certain requests slow, what is causing errors).
Grafana
Grafana, when leveraged as part of the Grafana stack (Loki, Grafana, Tempo, and Mimir), coupled with the integration of Prometheus, provides a robust platform for Application Performance Monitoring (APM). This integrated approach enhances application performance monitoring and provides detailed insights into application health and performance.
Here's a streamlined overview of how the Grafana stack supports Application Performance Monitoring (APM):
- Prometheus: Collects application metrics for performance monitoring.
- Tempo: Focuses on collecting and storing trace data, offering detailed insights into the request flow across microservices. This trace data is crucial for identifying bottlenecks in application performance.
- Loki: Collects and indexes log data from applications for error identification and analysis of events that could impact the application's performance.
- Mimir: Provides scalable storage for long-term metrics data, aiding trend analysis of application performance over time and capacity planning.
- Grafana: Provides customizable dashboards for visualizing key performance indicators (KPIs) from applications, trace data, and log data to identify patterns, trends, and anomalies in your application's performance.
Verdict
Which tool offers better APM capabilities between Prometheus vs Grafana?
When comparing Prometheus vs Grafana for APM capabilities, Grafana, with its integrated stack, offers a more comprehensive solution for detailed application performance monitoring.
Data Query: Tie
Prometheus
Prometheus provides a powerful and flexible querying language known as PromQL (Prometheus Query Language) for querying and analyzing time-series data. PromQL allows users to perform a wide range of operations, including filtering, aggregation, and mathematical transformations, on the collected metrics data. Users can write expressive queries to extract valuable insights and monitor system performance effectively. With support for functions like rate, sum, and histogram_quantile, PromQL enables advanced analysis and visualization of metrics data.
Grafana
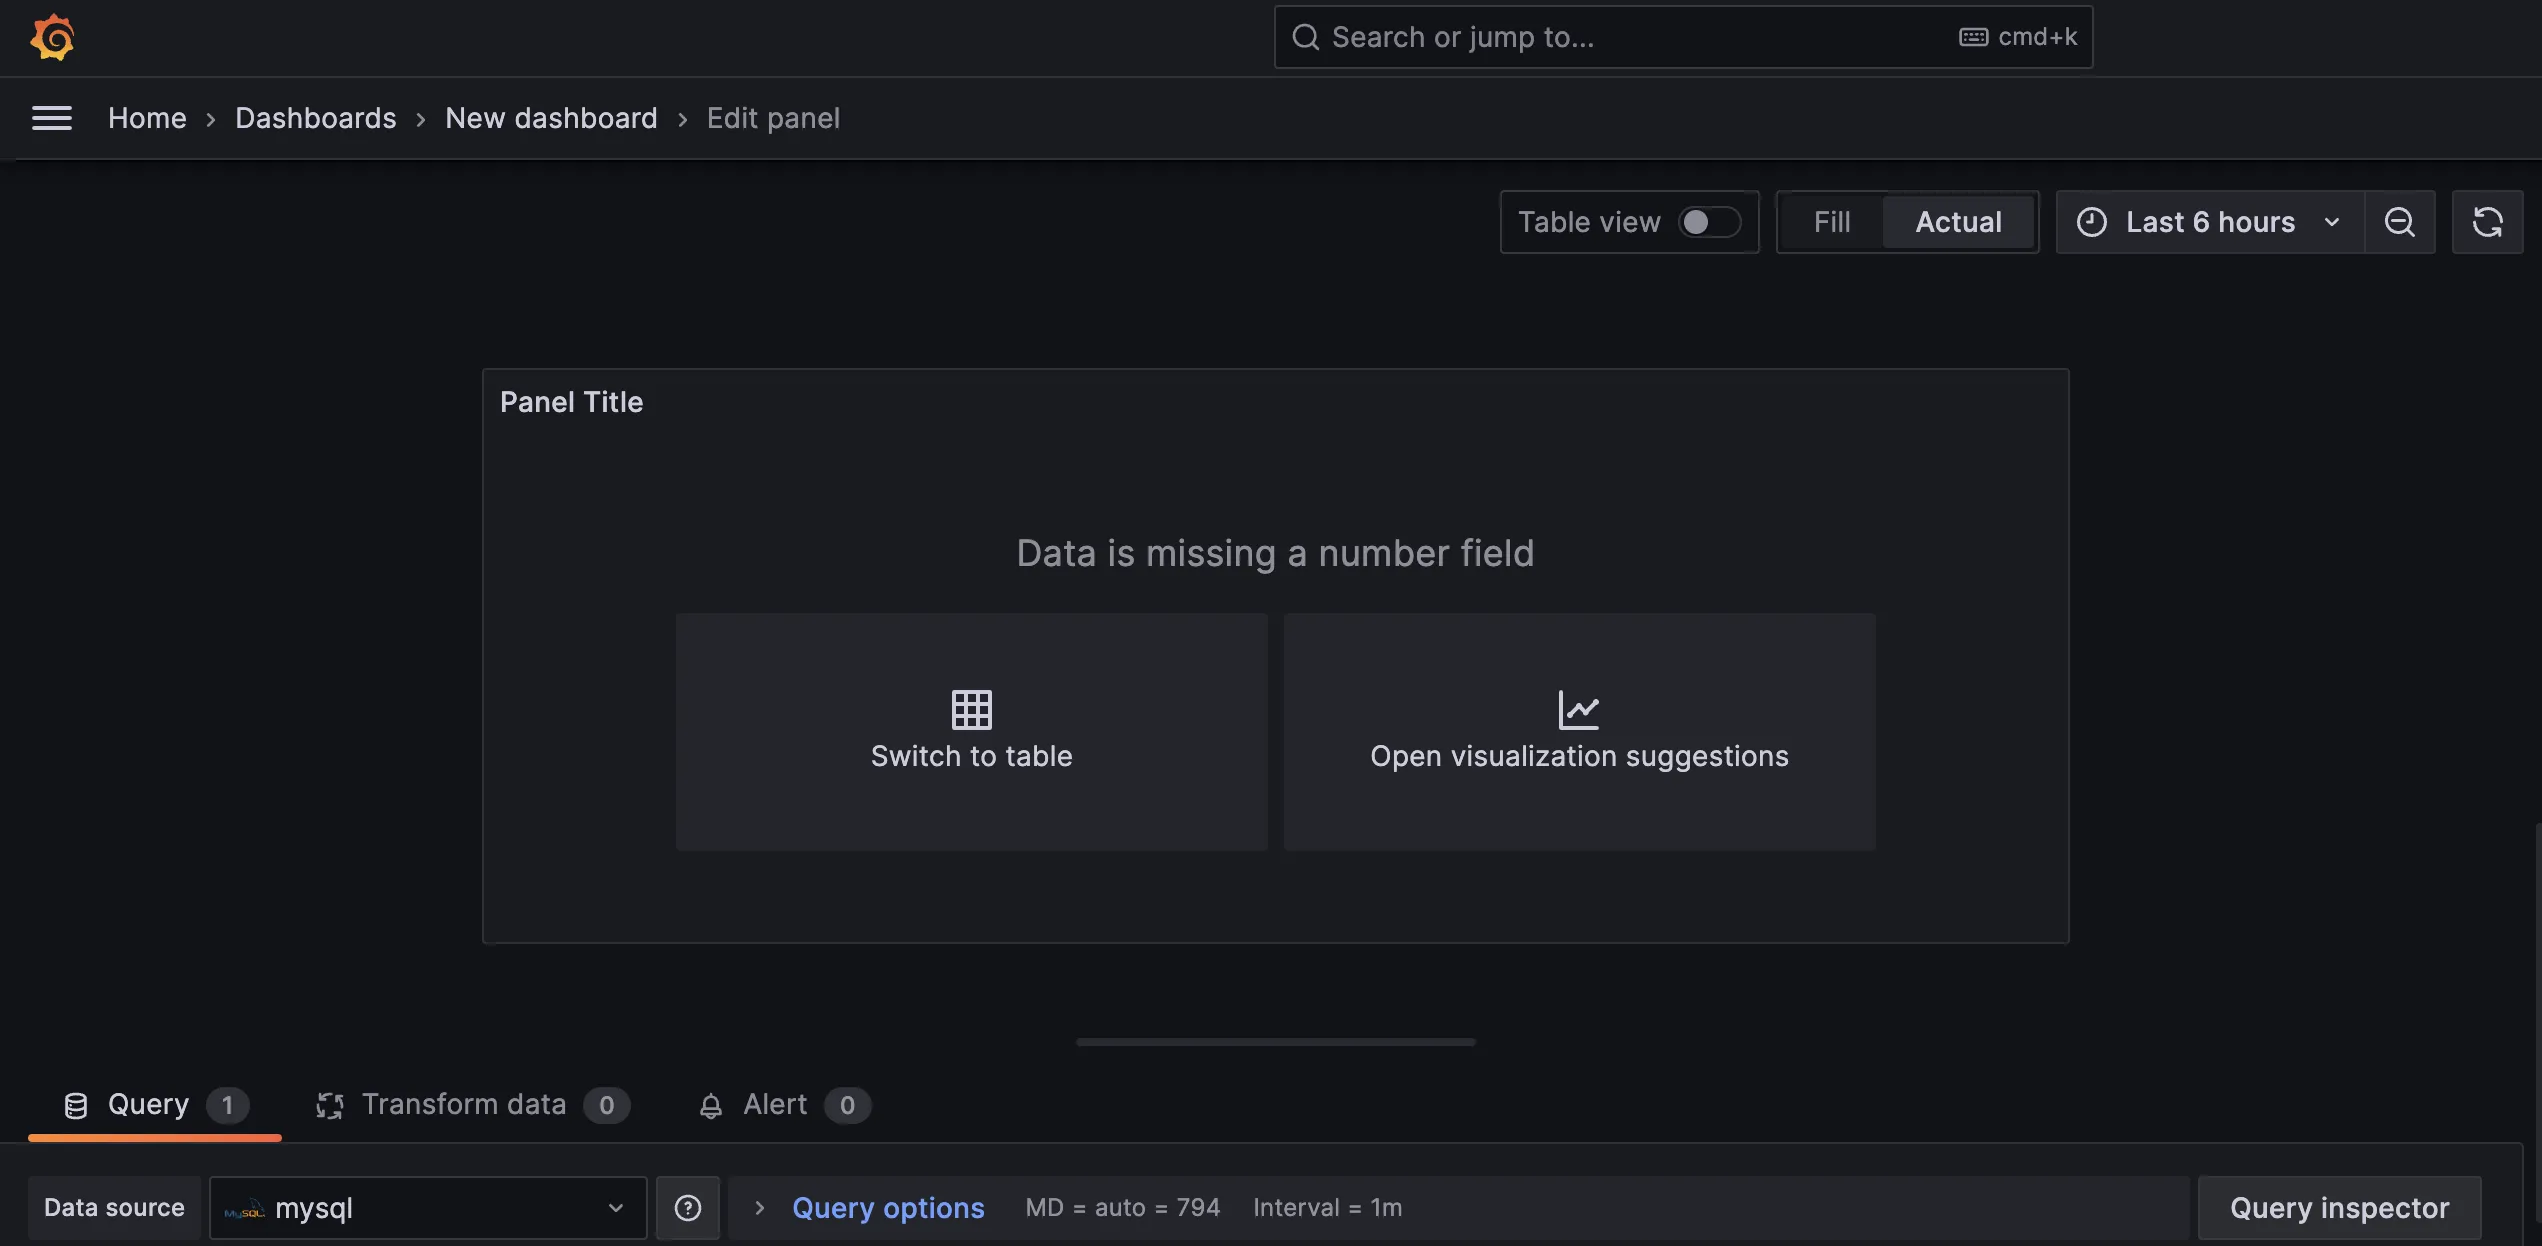
Grafana's data query functionality is specific to the data source in use. For instance, if you have configured Prometheus with a MySQLD exporter to collect metrics from a MySQL database and you subsequently select Prometheus as the data source within Grafana, your data queries will be executed using PromQL. You can see an example, as shown in the image below.
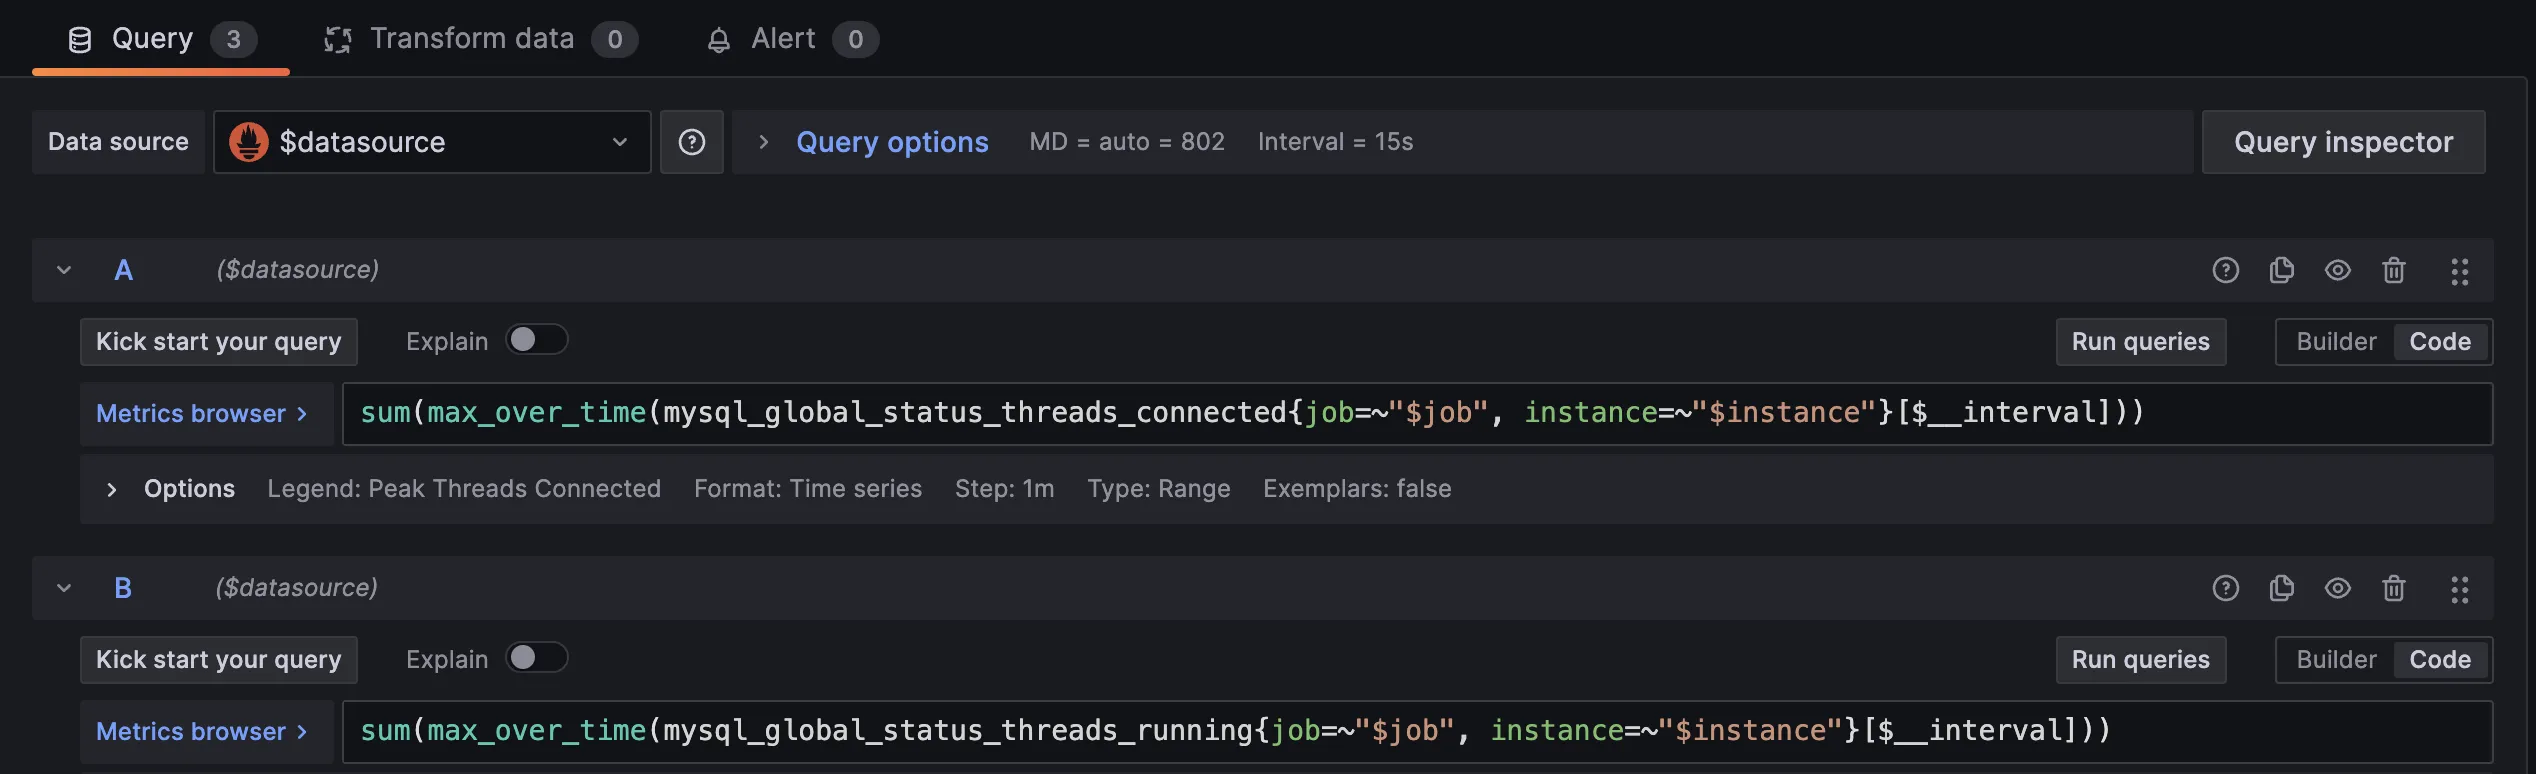
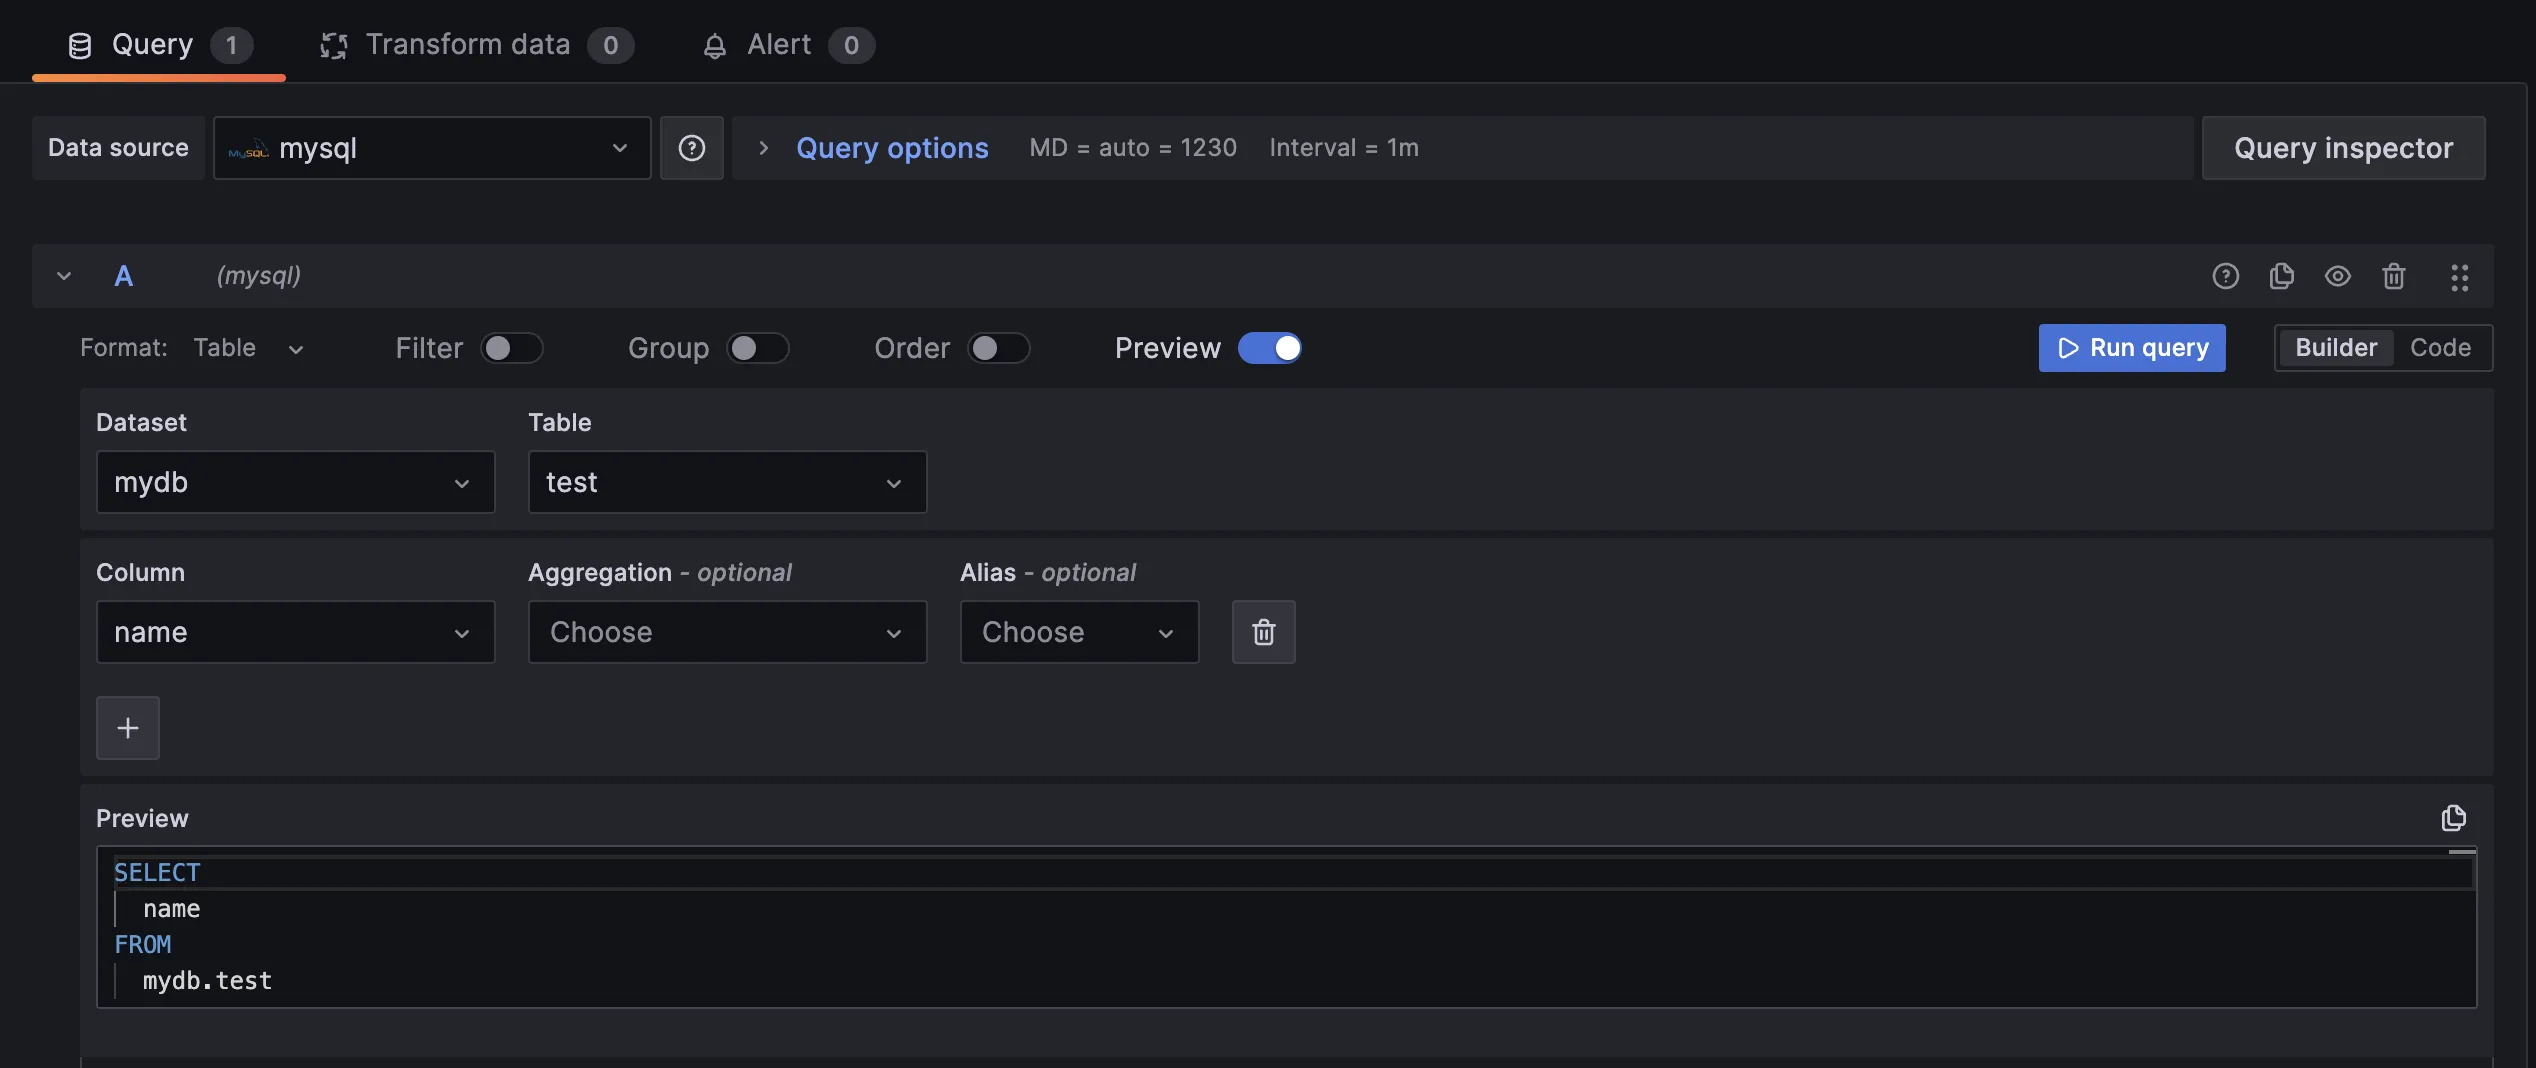
Similarly, if MySQL is configured as the direct data source in Grafana, the queries executed will be SQL queries, which are native to the MySQL database system.
Verdict
Which tool offers better data query capabilities between Prometheus vs Grafana?
Overall, both Prometheus and Grafana have good data query capabilities, each excelling in different areas depending on the data source and use case.
Data Storage: Prometheus Wins
Prometheus
Prometheus has an in-built time-series database optimized for high-performance time-series data handling, which allows for efficient querying and retrieval of historical data. The database is specifically designed to store time-series data locally, providing fast access to metrics collected over time.
However, Prometheus does not offer long-term data storage capabilities out of the box. As a result, integrating with other tools is necessary to effectively manage data over extended periods. This integration enables seamless archiving, retention, and analysis of historical metrics beyond the storage capacity of Prometheus' local database.
Grafana
Grafana uses Mimir, a part of the Grafana stack for metrics storage. Mimir is an open-source, scalable, highly available, multi-tenant time series database (TSDB) specifically engineered for the long-term storage of Prometheus metrics. Its development was motivated by the need to address the scalability limitations of Prometheus, and it is designed to natively ingest Prometheus metrics.
Mimir's architecture is structured to support up to 1 billion metrics, enabling it to offer rapid query performance. It ensures high availability, durable storage, and is capable of scaling horizontally to meet the demands of large-scale deployments.
Verdict
Which tool offers better data storage capabilities between Prometheus vs Grafana?
When we compare Prometheus vs Grafana in terms of data storage, Grafana’s Mimir provides a more scalable and robust solution for long-term storage of metrics.
Alerting: Tie
Prometheus
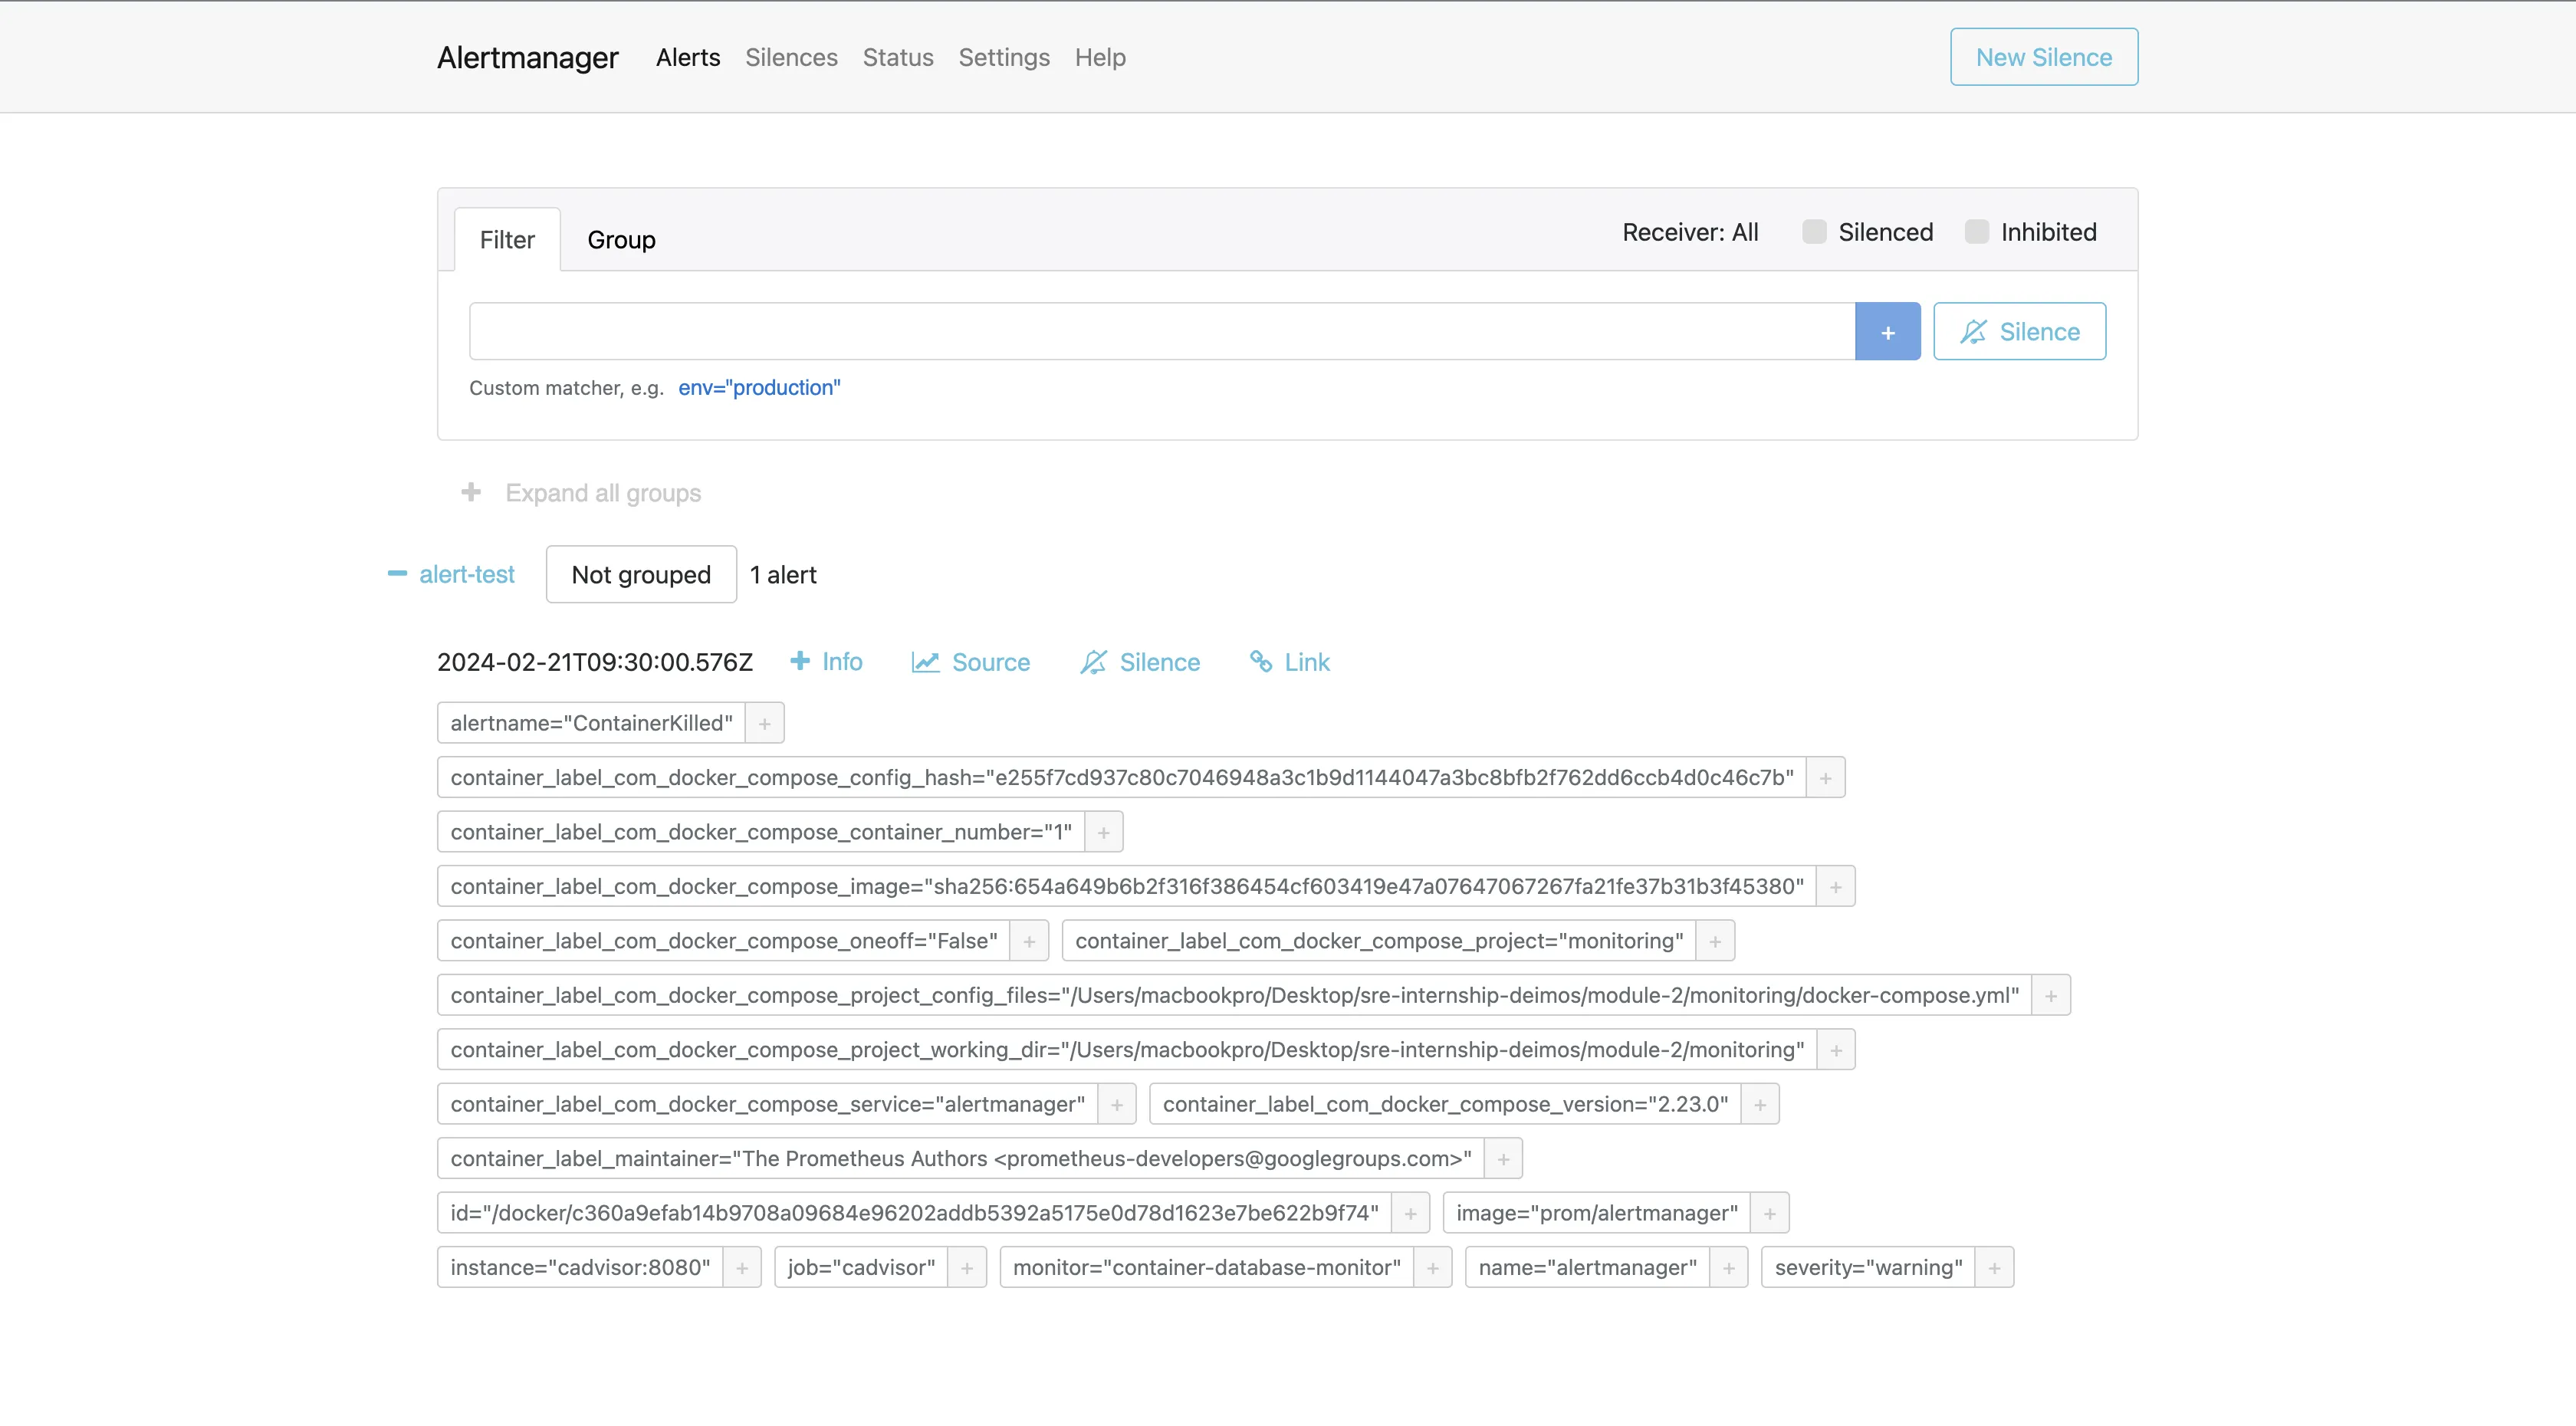
Prometheus does not provide a built-in feature for configuring alert rules directly. Instead, alerting is managed by a component called Alertmanager. Alertmanager is responsible for handling alerts, including silencing, inhibition, aggregation, and the delivery of notifications. It can be configured to send alerts to various channels, such as email, on-call notification systems, and chat platforms. This is facilitated through the definition of alerting rules.
Users define alerting rules using PromQL, setting conditions based on the collected metrics. When these conditions are met, Prometheus generates alert instances.
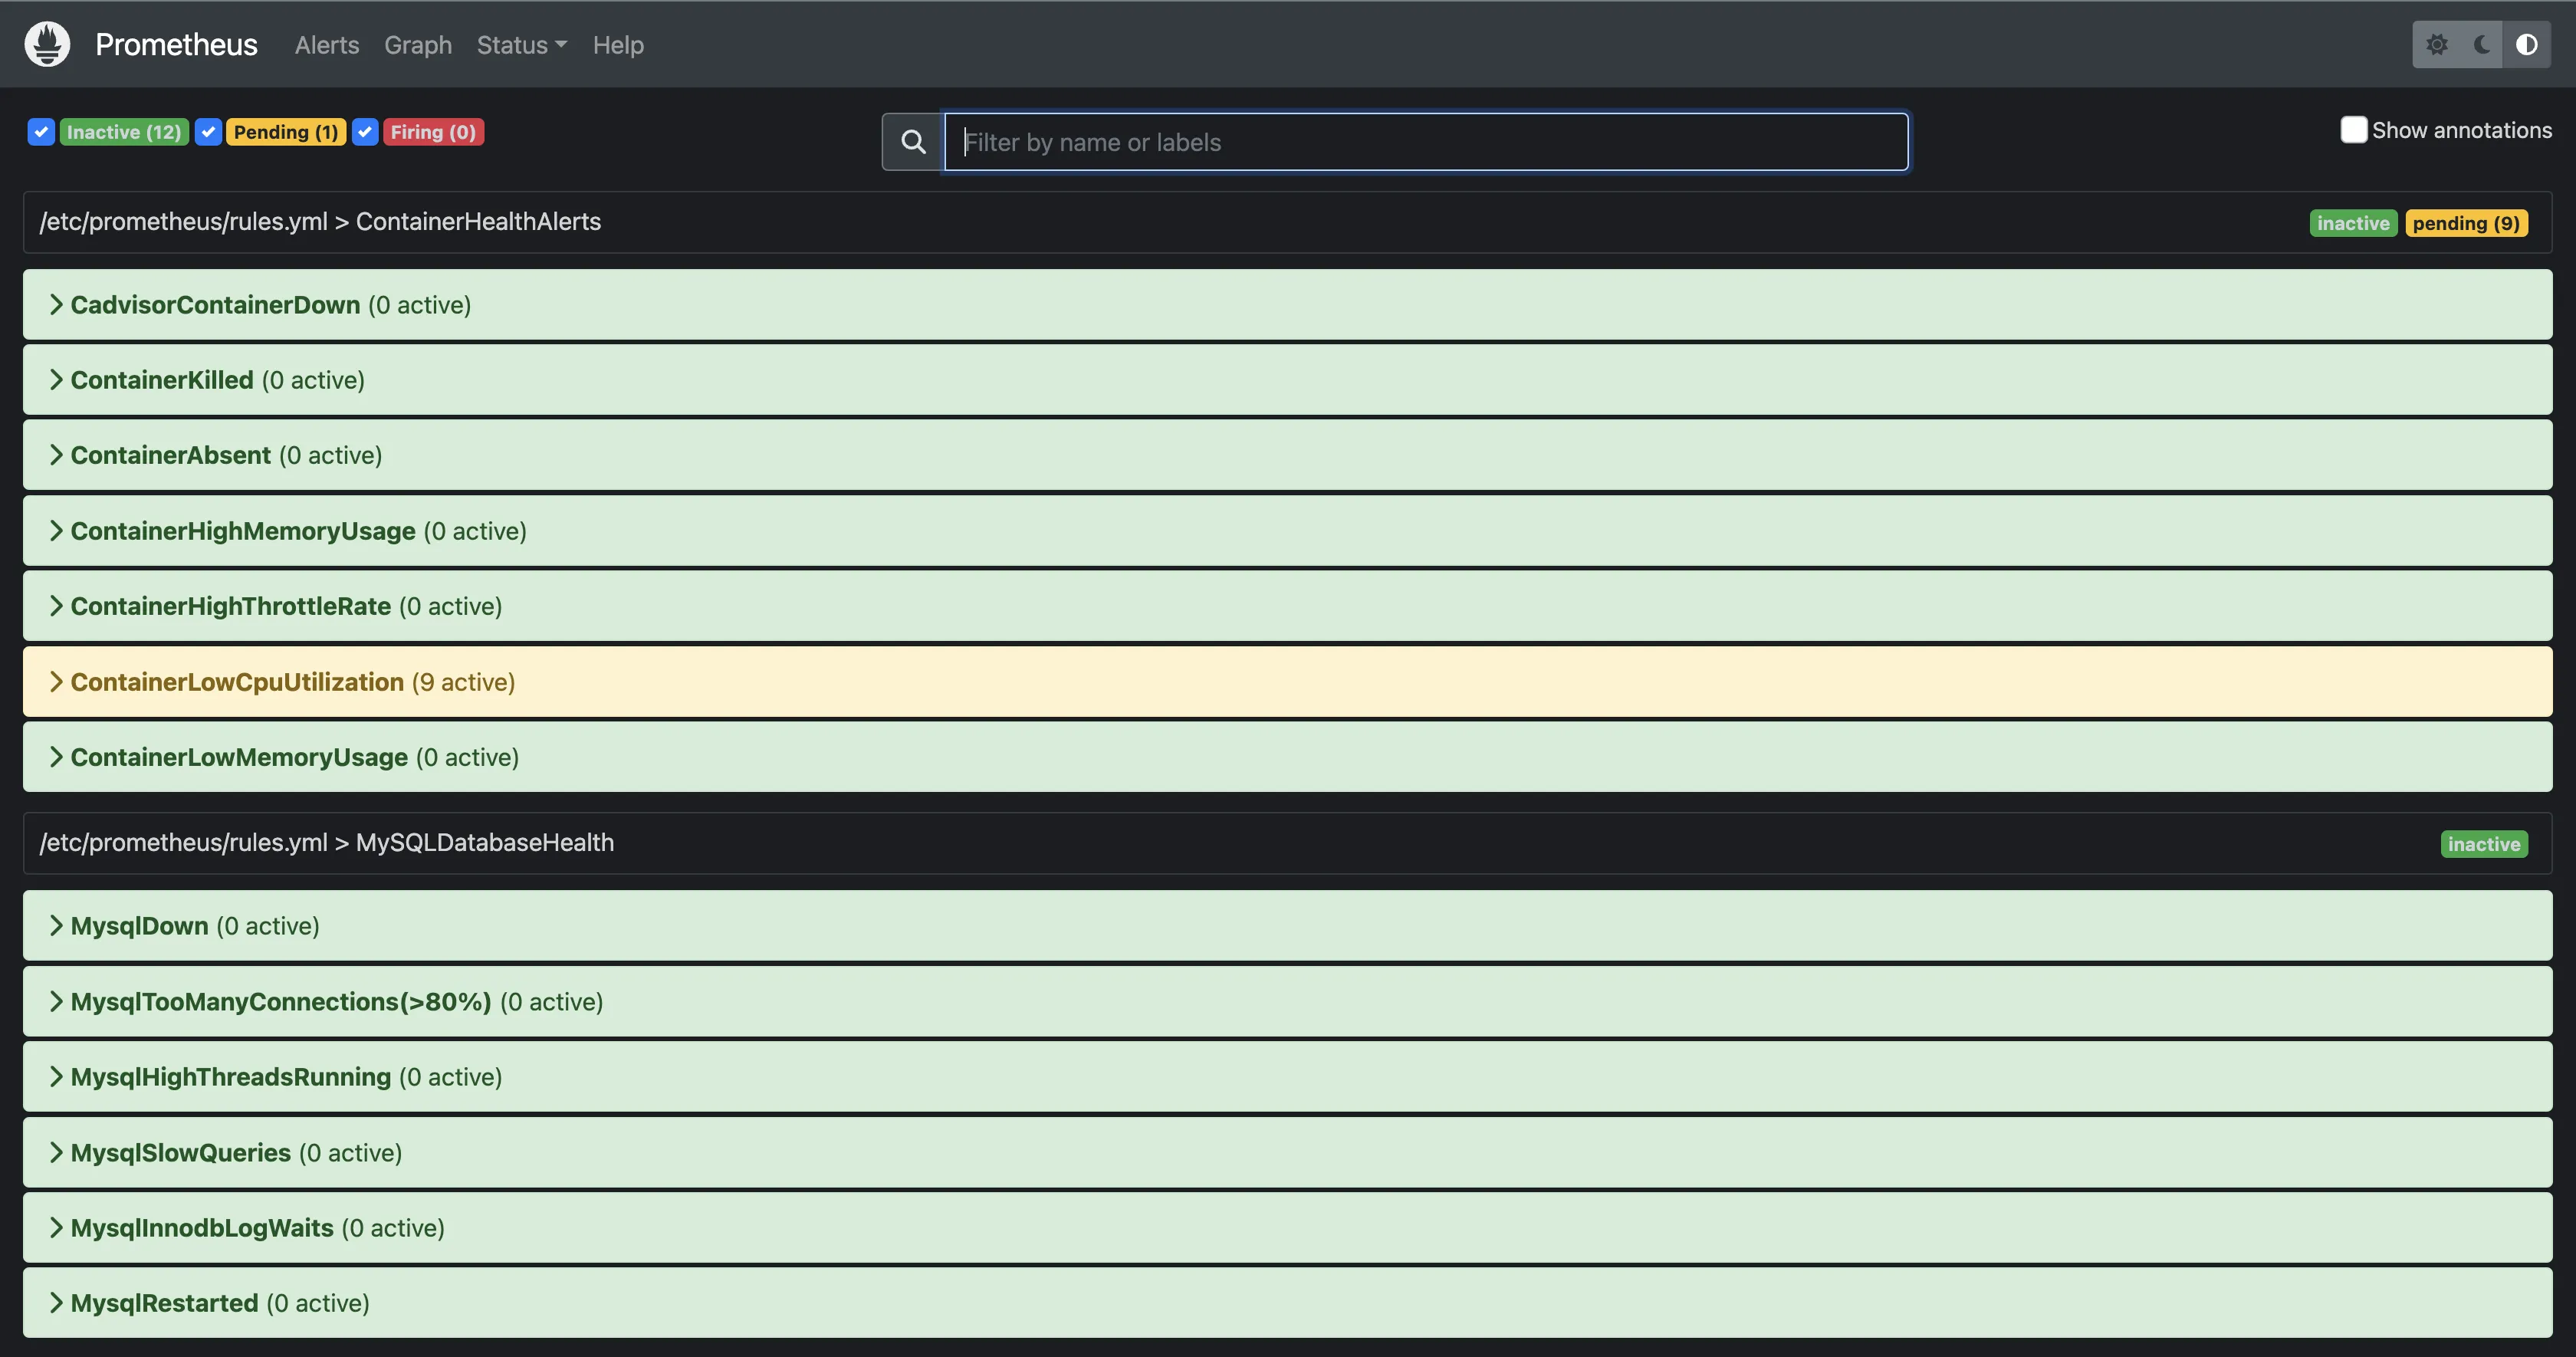
These instances are then forwarded to Alertmanager, which handles deduplication, grouping, and routing for prompt notification to email, Slack, PagerDuty, OpsGenie, etc.
Grafana
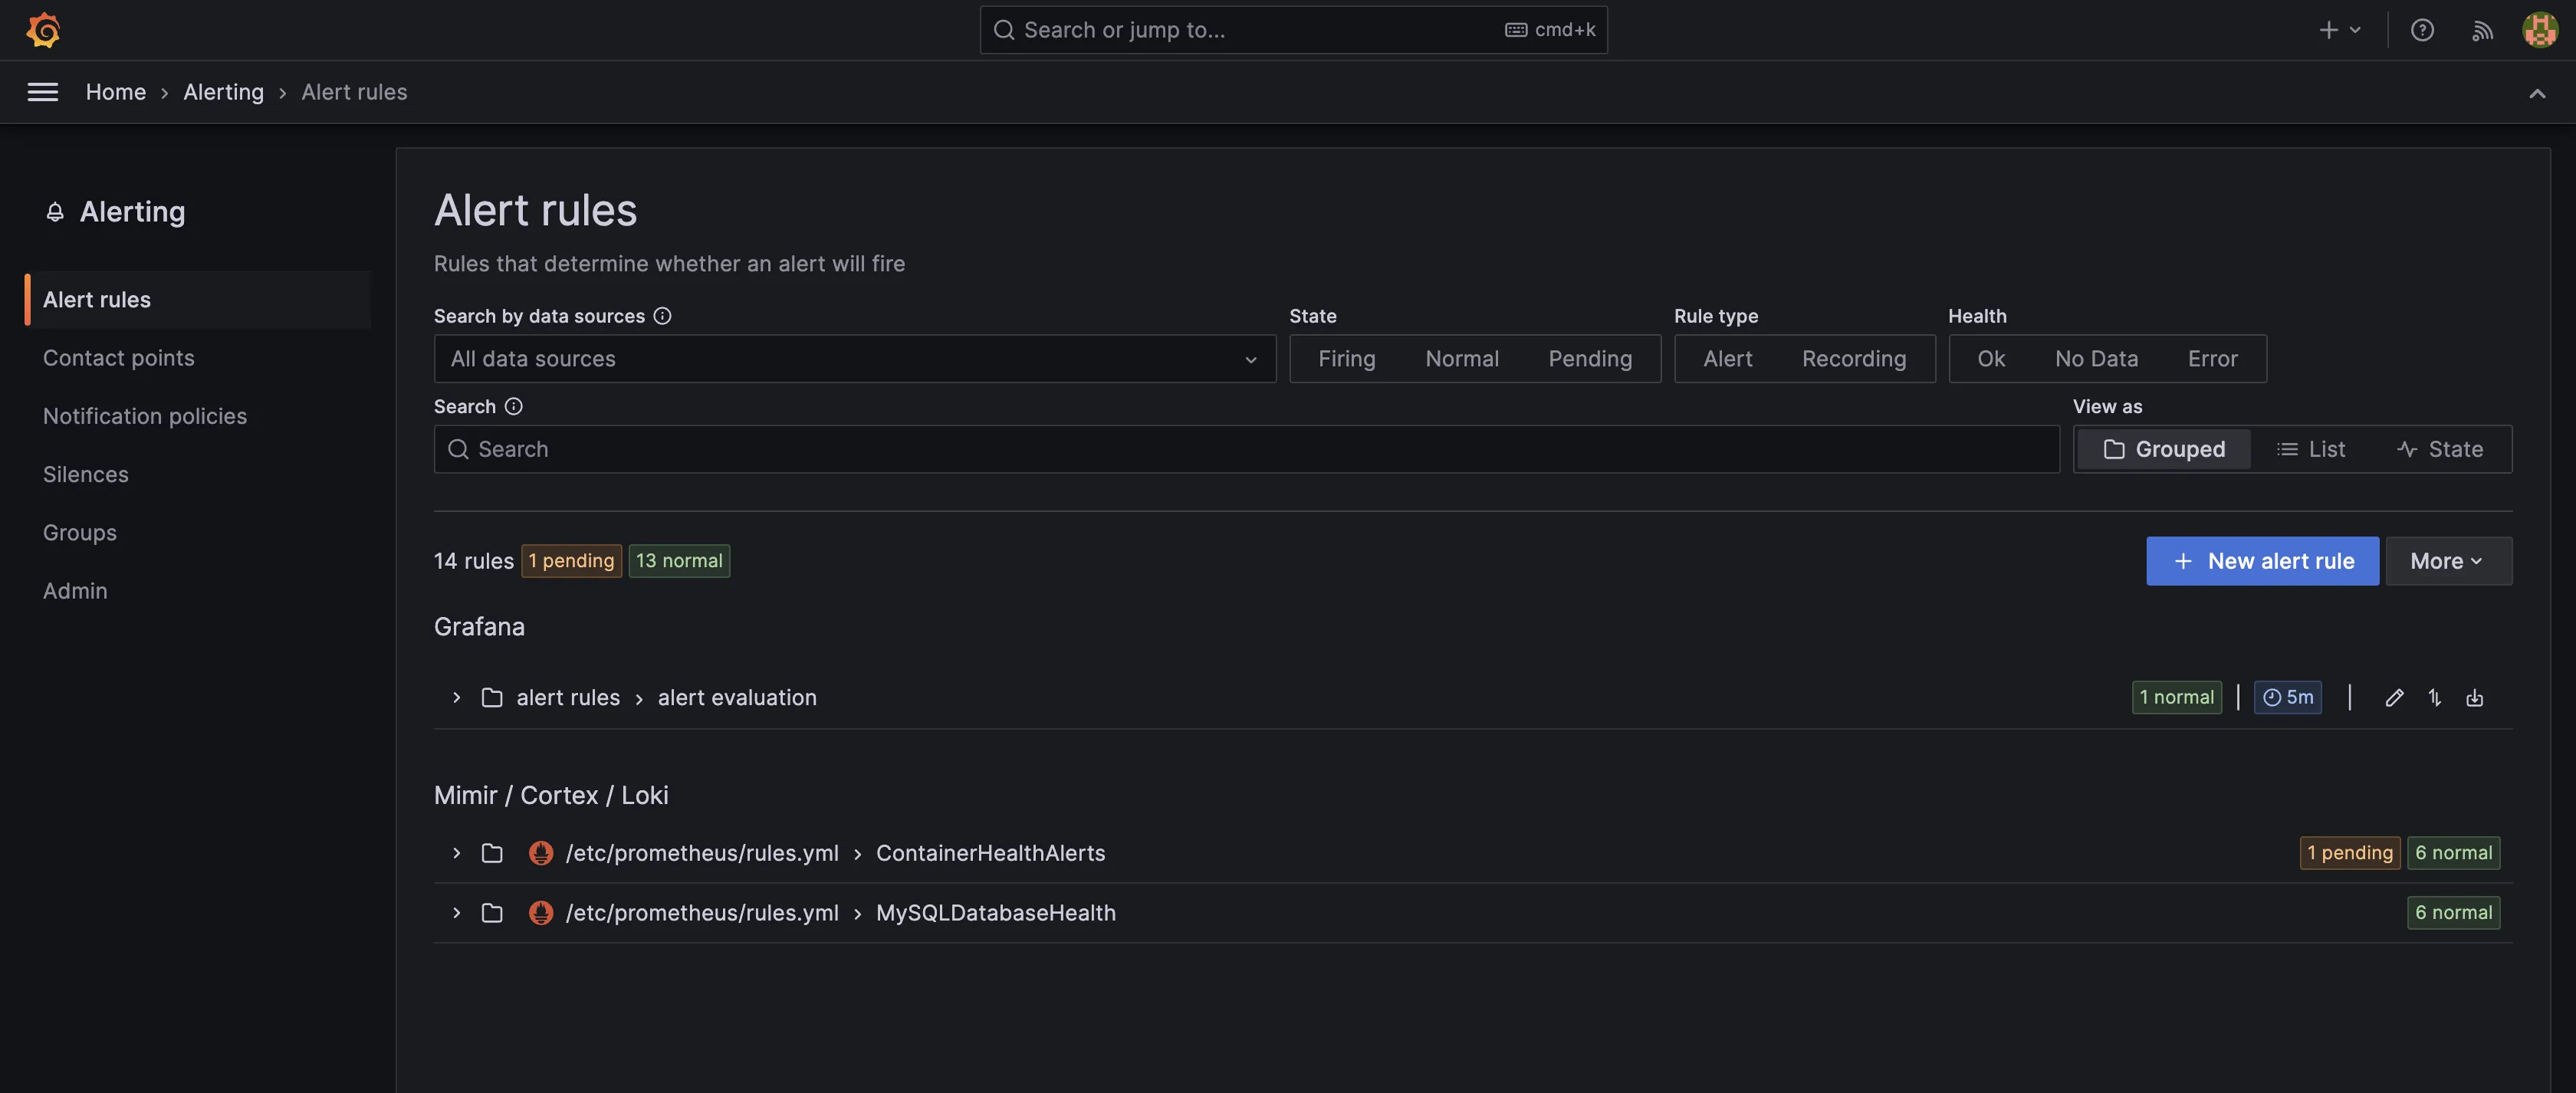
Grafana allows users to create alerts based on queries and expressions from multiple data sources. Alerting rules are configured through the UI, providing a visually intuitive approach. Users can set up alert rules, add labels, and define notification policies to specify where, when, and how notifications are routed.
If you want to keep your alerting system separate from your visualization layer, Prometheus's Alertmanager is an excellent choice, as it is a dedicated component offering enhanced flexibility and customization for managing alerts.
If you are already utilizing Grafana for visualization and require a comprehensive, integrated alerting solution, then Grafana's alerting features would be the appropriate choice for your needs.
Verdict
Which tool offers better alerting capabilities between Prometheus vs Grafana?
In the Prometheus vs Grafana comparison, each tool provides unique advantages for alerting, depending on your specific requirements and setup.
Cloud Option: Grafana Wins
Prometheus
Prometheus does not offer a cloud service or option. This means users are responsible for deploying and managing their Prometheus instances.
Grafana
Grafana, on the other hand, offers a fully managed cloud service known as Grafana Cloud. This service provides a seamless experience for deploying, managing, and scaling Grafana dashboards and data sources. Grafana Cloud eliminates the need for manual setup and maintenance, allowing teams to focus on creating and sharing insights from their data. It's an excellent choice for organizations looking for a hassle-free monitoring solution that requires minimal operational overhead.
Verdict
Which tool offers better cloud options between Prometheus vs Grafana?
In the Prometheus vs Grafana comparison for cloud options, Grafana stands out with its managed cloud service, offering ease of use and reduced operational overhead.
UI/UX: Grafana Wins
Prometheus
Prometheus provides a basic web interface, primarily focused on querying and visualizing time series data. The UI is functional but relatively minimalistic, with options for executing PromQL queries, viewing graphs, and exploring metrics. The user experience in Prometheus is straightforward and intuitive.
Grafana
Grafana offers a visually appealing and robust UI, compared to Prometheus. It has a user-friendly interface for easy navigation and interaction. The user experience in Grafana is designed to be intuitive and accessible.
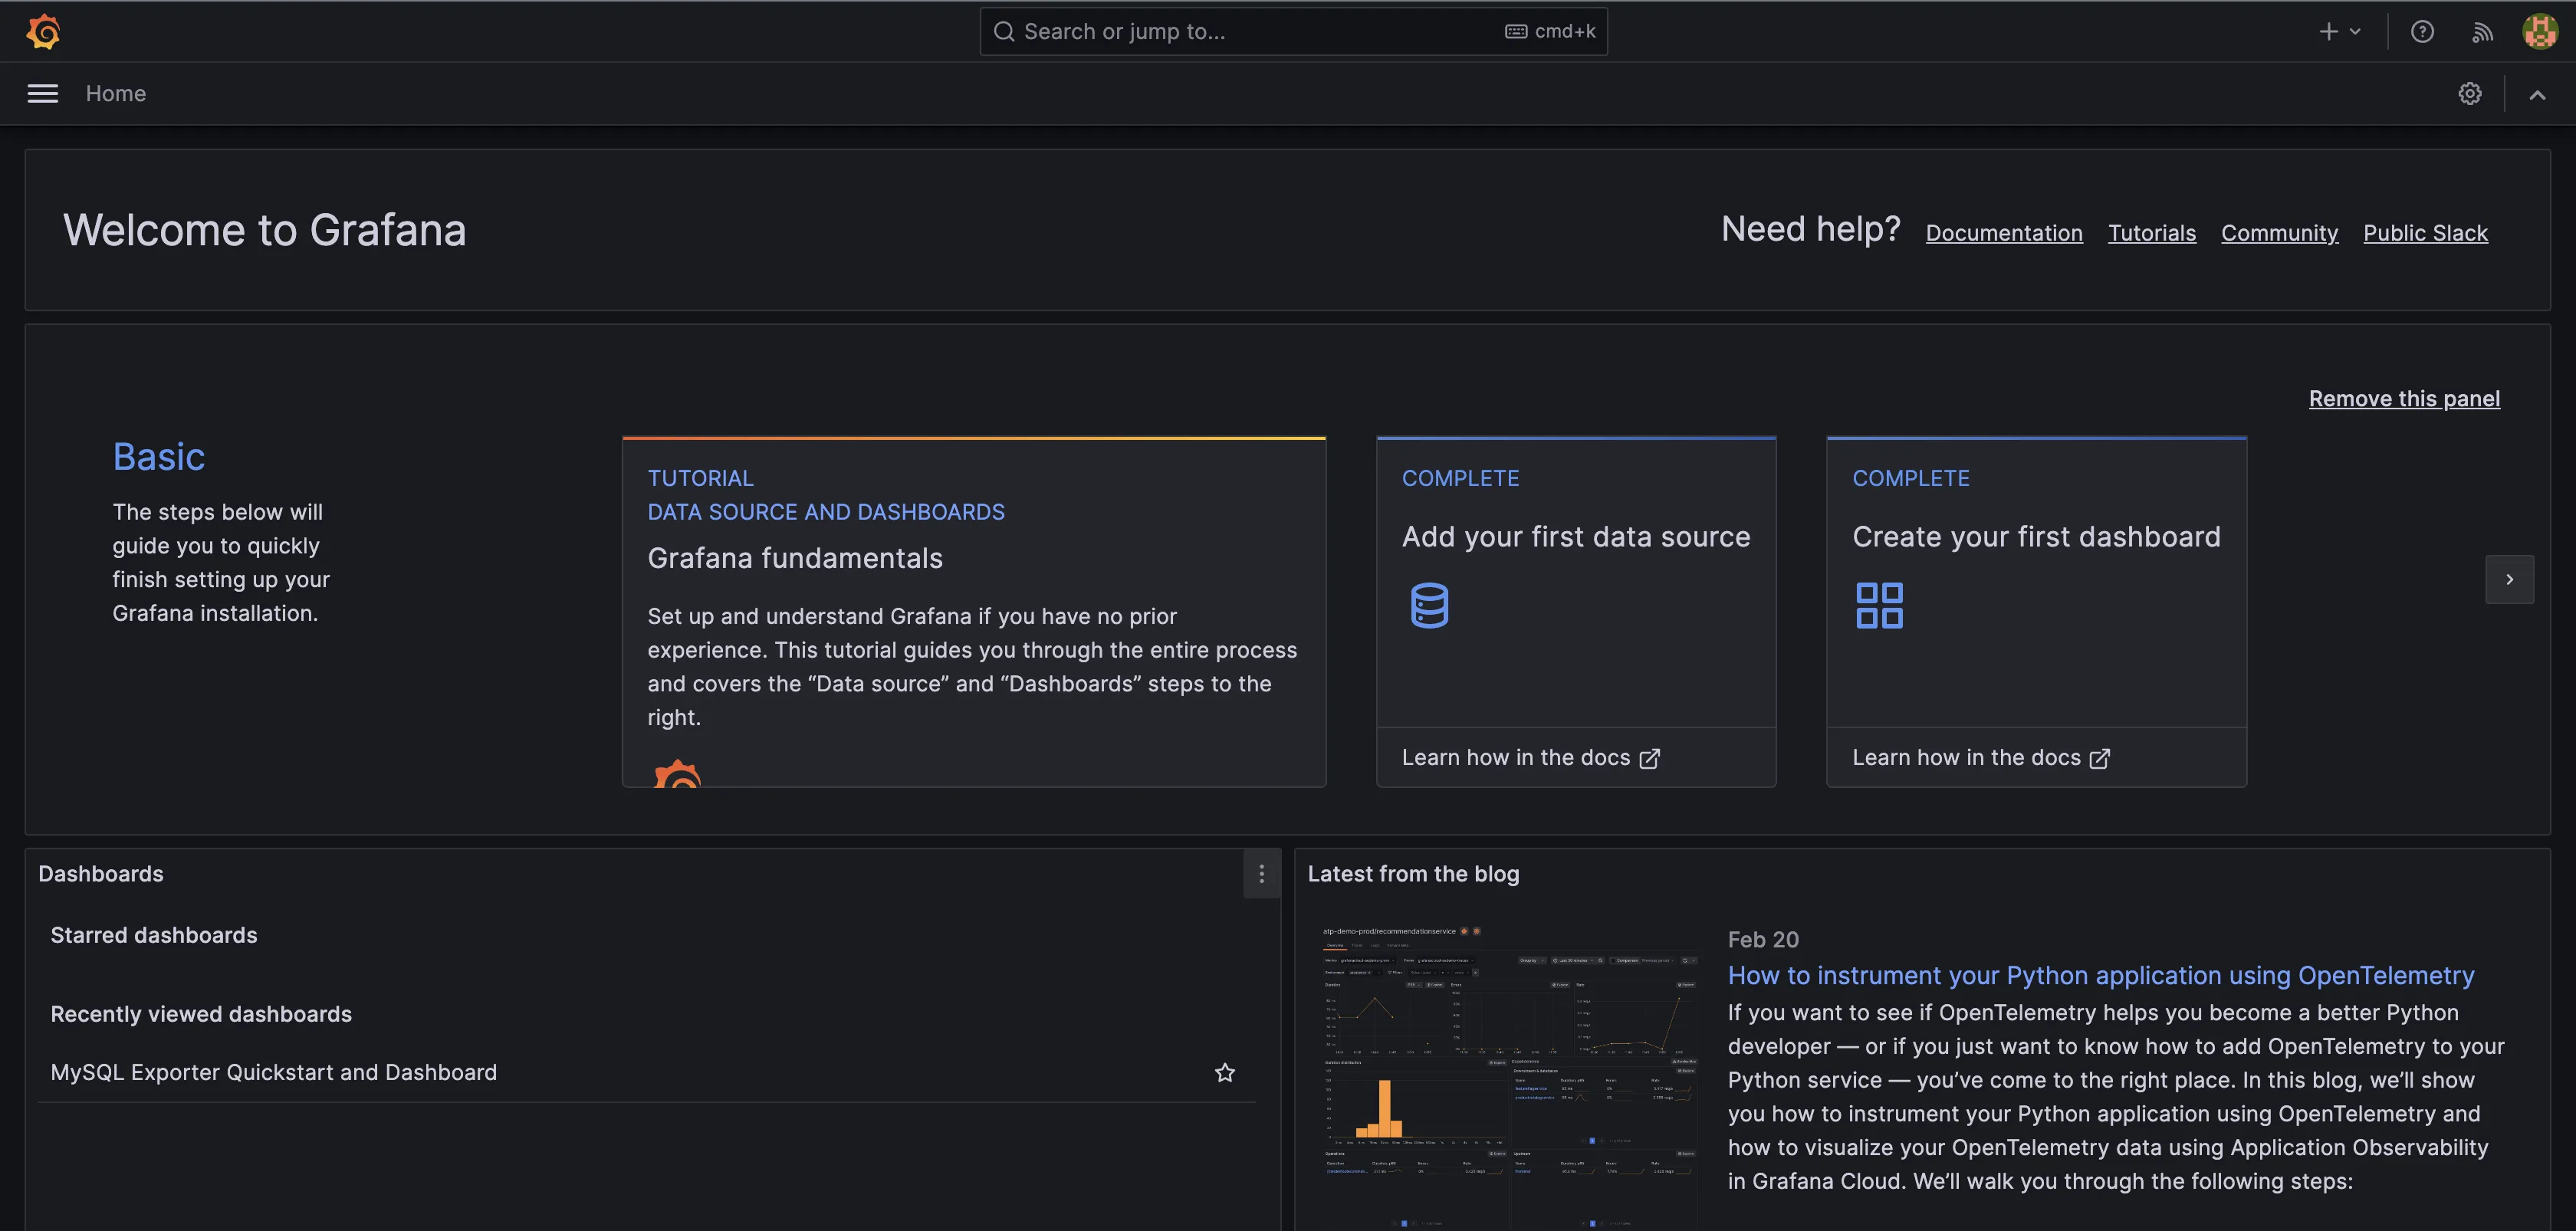
Both tools offer satisfactory user experiences, but Grafana has richer UI functionality compared to Prometheus. Grafana not only provides a visually appealing interface but also offers a broader range of features and customization options.
Verdict
Which tool offers better UI/UX between Prometheus vs Grafana?
Both tools offer satisfactory user experiences, but Grafana has richer UI functionality compared to Prometheus. Grafana not only provides a visually appealing interface but also offers a broader range of features and customization options.
Pricing: Prometheus Wins
Prometheus
Prometheus is open-source and completely free to use, making it a good option for organizations of all sizes.
Grafana
Grafana's open-source offering is available at no cost, making it accessible to a wide range of users who wish to leverage its powerful visualization capabilities without incurring additional expenses.
Grafana’s paid cloud option, Grafana Cloud, provides a range of pricing options to cater to various user requirements. The free forever plan includes a set of limited resources, encompassing metrics, visualizations, logs, traces, and profiles. Users looking to scale monitoring and visualization can opt for the pay-as-you-go model with no upfront costs, starting at $0, or the advanced premium bundle starting at $299 per month.
Verdict
Which tool offers better pricing options between Prometheus vs Grafana?
Prometheus, being completely open-source and free, offers a cost-effective solution for organizations of all sizes. Grafana also provides an open-source version for free, but its paid cloud option, Grafana Cloud, caters to users looking for more advanced features and scalability, starting at $0 with a pay-as-you-go model.
Documentation and Community Support: Grafana Wins
Prometheus
Prometheus has very comprehensive and easy-to-understand documentation. The community around Prometheus is active and responsive, with numerous forums, mailing lists, and chat rooms where users can ask questions, share experiences, and contribute to the knowledge base.
Grafana
Grafana also provides comprehensive documentation that is accessible and easy to navigate. The Grafana community is vibrant and supportive, with a variety of channels for engagement, including online forums, social media groups, official community events like webinars and workshops, and a comprehensive library of educational videos and materials.
Verdict
Which tool offers better documentation and community support between Prometheus vs Grafana?
Overall, both Prometheus and Grafana have excellent documentation and active communities for support. However, Grafana, being a self-hosted and managed service, provides more extensive support channels and resources for users.
Prometheus vs Grafana: The Final Verdict
Prometheus and Grafana are powerful tools, each with its strengths, weaknesses, and use cases. Understanding their differences is crucial for making the right choice for your monitoring and visualization needs.
Here’s a use-case-based guide for Prometheus vs Grafana:
- If your primary goal is to collect metrics like resource usage, then choose Prometheus.
- If your focus is solely on visualization, choose Grafana.
- If you prefer a highly customizable dashboarding experience with support for multiple data sources, choose Grafana.
- If you want a fully managed option for both visualization and monitoring, choose Grafana Cloud.
- If you want a cost-effective monitoring solution, especially for smaller teams or projects, choose Prometheus.
For effective monitoring and observability of your applications, all your telemetry signals should be under a single pane of glass. Prometheus and Grafana lack this, as Prometheus is limited to monitoring and Grafana to visualization. To get these added telemetry signals in the setup, you would have to integrate Loki and Tempo, part of the Grafana stack, into the setup. This quickly introduces complexity and can be difficult to manage. Even though the Grafana Cloud version provides complete observability through a unified interface, the cost can easily go up as you are charged based on the amount of telemetry data sent and user seats.
If you are replacing the visualization layer, the Grafana alternatives guide goes deeper. And for Prometheus related comparisons, see Datadog vs Prometheus, Loki vs Prometheus, and Jaeger vs Prometheus.
A better Prometheus and Grafana Alternative: SigNoz
SigNoz is a full-stack open-source application performance monitoring and observability tool that serves as an excellent Prometheus and Grafana alternative.
Why SigNoz?
Because it consolidates logs, metrics, and traces under a single pane of glass, providing complete telemetry signals simplifying your workflows as compared to Grafana. SigNoz is also cost-effective, as you are charged only for the amount of telemetry data sent.
Some of the key features of SigNoz are:
- Comprehensive Monitoring: Out-of-the-box charts for application metrics such as request latency, and custom dashboards for monitoring infrastructure.
- Effortless Correlation: Easily correlate metrics and traces with a single click, simplifying root cause analysis and performance troubleshooting.
- Built-in Alerting: In-built alerting feature that ensures you are promptly notified of any anomalies or performance issues.
- Seamless Integration: Support for Prometheus remote read, facilitating a smooth transition from Prometheus to SigNoz for metrics monitoring.
- Advanced Log Management: Excellent log management capabilities with features like a log query builder, multi-field search, structured table views, and JSON views.
- Native OpenTelemetry Support: Native integration with OpenTelemetry, aligning with the industry standard for telemetry data.
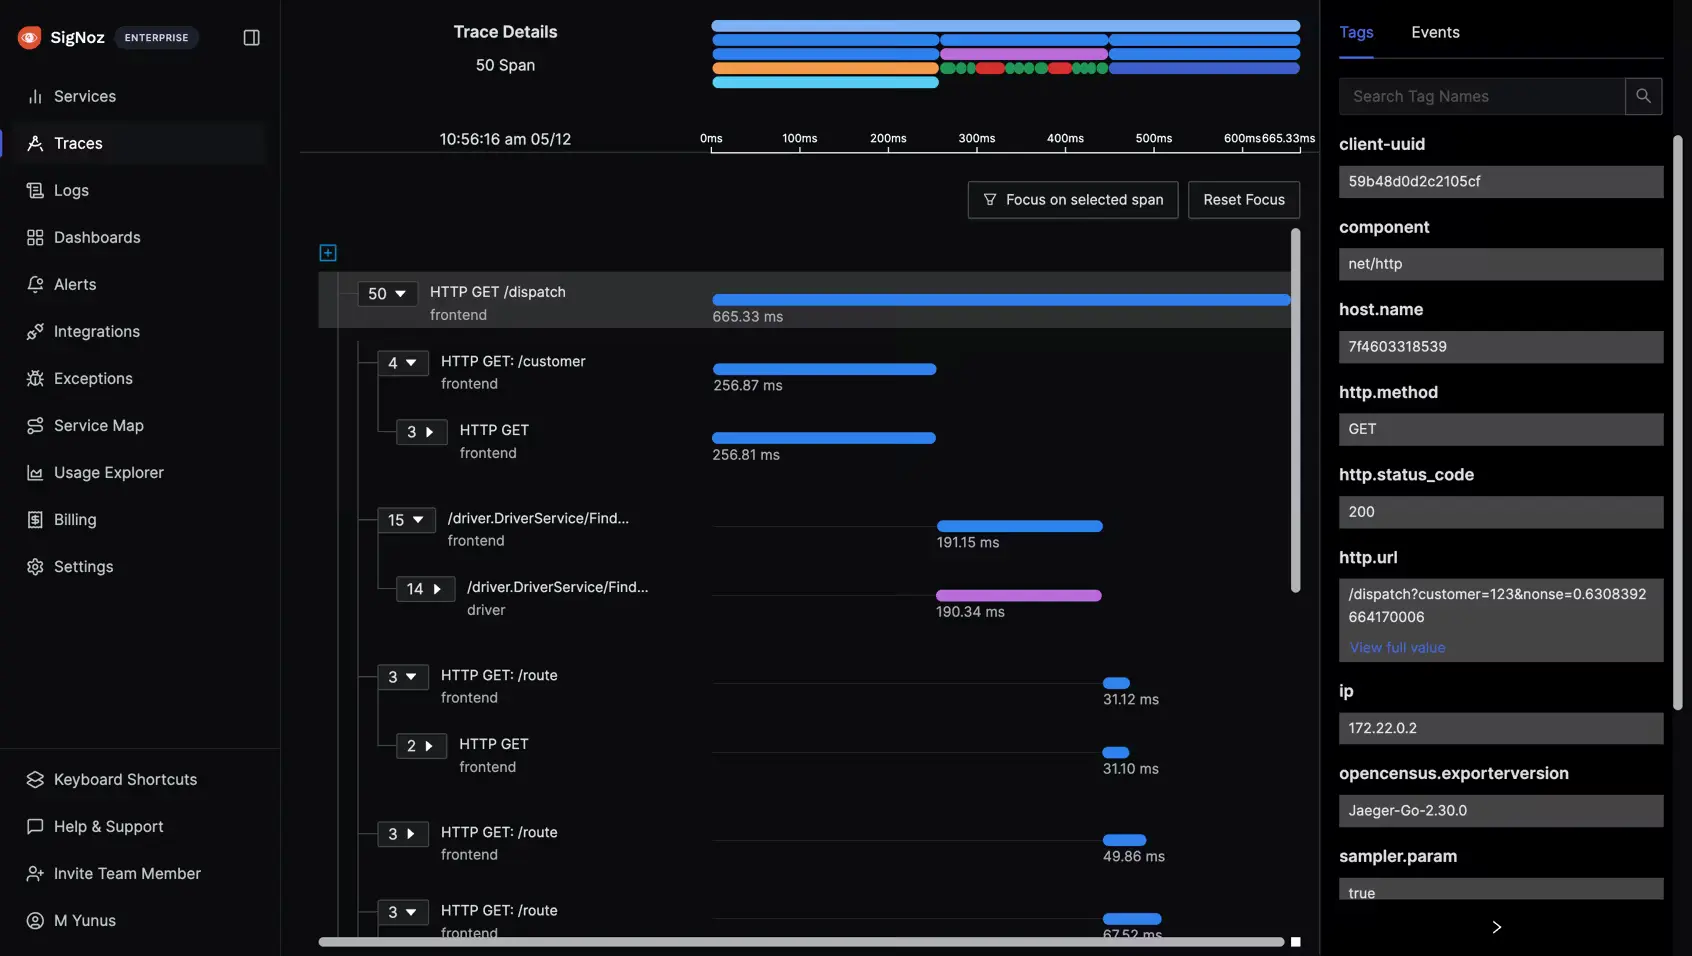
- End-to-End Tracing: End-to-end distributed tracing to gain complete visibility of your services.
- High-Performance Database: Utilizes Clickhouse, a high-performance OLAP database, for efficient data ingestion and aggregation.
For a detailed comparison between Grafana and SigNoz, check out this comprehensive article.
Getting Started with SigNoz
SigNoz Cloud is the easiest way to run SigNoz. Sign up for a free account and get 30 days of unlimited access to all features.

You can also install and self-host SigNoz yourself since it is open-source. With 24,000+ GitHub stars, open-source SigNoz is loved by developers. Find the instructions to self-host SigNoz.
FAQs
We have answered a few common questions that developers often have around Prometheus and Grafana below:
Is Prometheus the same as Grafana?
No, Prometheus and Grafana serve different purposes. Prometheus is used for metrics collection and monitoring, while Grafana excels in data visualization and dashboarding.
Is it possible to use Grafana without Prometheus?
Yes, Grafana supports a wide range of data sources and can be used without Prometheus.
What is the difference between Grafana and Prometheus and Kibana?
Prometheus is a monitoring tool for metrics, Grafana is a visualization tool for various data sources, and Kibana is a visualization tool specifically for Elasticsearch data.
What is Prometheus and Grafana in DevOps?
Prometheus and Grafana are used in DevOps for monitoring and visualizing application and system metrics, aiding in performance analysis and alerting.
What is Prometheus used for?
Prometheus is used for collecting and storing metrics data, which helps in monitoring the performance and health of applications and infrastructure.
Is Prometheus better than CloudWatch?
Prometheus and CloudWatch have different strengths. Prometheus is open-source and customizable, while CloudWatch is a managed service integrated with AWS.
What is better than Grafana?
The choice depends on specific needs. SigNoz offers integrated monitoring and observability in a single pane, which might be better for some use cases.
What are the disadvantages of Prometheus?
Prometheus lacks long-term storage and native log management, requiring integration with other tools for comprehensive monitoring.
Is Grafana better than Kibana?
Grafana and Kibana serve different purposes. Grafana supports multiple data sources and is highly customizable, while Kibana is tailored for Elasticsearch.
Is Prometheus and Grafana free?
Yes, both Prometheus and Grafana have open-source versions available for free.
Further Reading:
