Prometheus Query Tutorial with examples
Monitoring tools are only as good as the range and visibility they offer admins into applications’ performance. Prometheus is a metrics monitoring tool that provides a pull-based system to collect and monitor time-series samples. Once the data is collected and stored, you can use Prometheus Queries to interact with the data: select and aggregate across the provided dimensions.
This article takes the reader from concept to content state about the Prometheus Query language. A few examples will be discussed to impart real-world experience in writing useful queries for the day-to-day management of apps monitored by the Open Source Prometheus APM.
No pre-query language knowledge is necessary for you to understand the content that follows, although it could come in handy grasping the logic flow of PromQL at first glance. That said, the best starting point would be to focus on the language without much to do about its syntax.
Prometheus Overview
Once your Prometheus instance starts to ingest data, the platform facilitates selecting, sorting, aggregating, and displaying data in real-time through PromQL. Depending on query arguments, a user can create tables of views of the time series data in the Prometheus expression browser.
You can also use a third-party tool to visualize the metrics data collected by Prometheus. The external system can consume the data using an HTTP API provided by Prometheus.
There are two major parts to Prometheus metrics monitoring:
- How metrics data is stored in Prometheus
- How to interact with stored metrics data
How Metrics Data is Stored in Prometheus
Any time series datastore engine requires objects recorded to possess a key(timestamp)-value pair structure. As a rule of thumb, time is an independent incrementing value since you cannot sum it, but you can query for range. You can use such storage means to observe changes (metrics) as time progresses.
Understanding how the Prometheus time-series engine stores data gives you an idea of intended query results before, while, and as your expressions execute.
For example, if the data you're looking for has different timestamps/or is just unknown in complexity, and you wish to aggregate (sum or average) occurrences, it might be best for you to create subqueries that end with tabular views. Tabular views allow filtering before joining only the time series vectors necessary to your reports.
While you can find the count of events for a single time stamp, you must take heed to keep your query scripts legal by not attempting to operate on time as though it were a standard integer variable. Just this simple structure-knowledge-based practice can avoid overloading your instances.
Here’s an article with a list of terms around Prometheus storage.
How to Interact With Stored Metrics Data
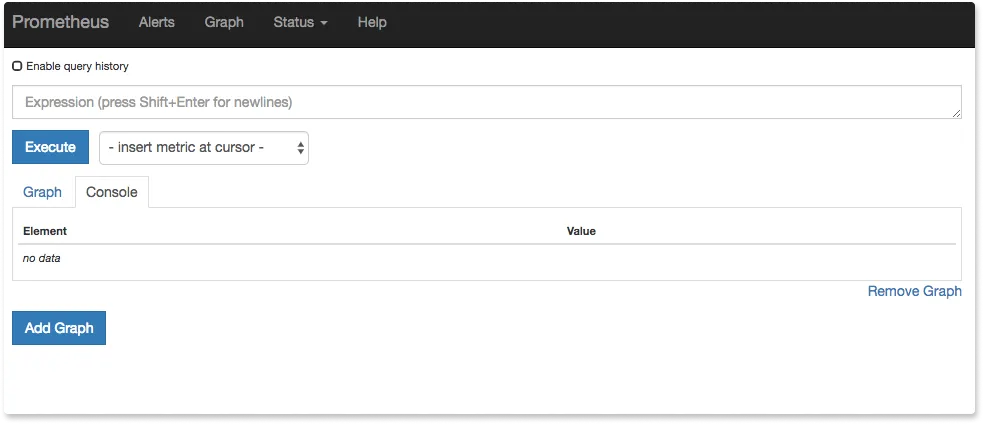
Once you have collected metrics data with Prometheus, you need to access it to generate insights. By default, Prometheus provides a user interface at http://<server_address>:9090 for you to interact with the engine and time series data stored. You can straight away enter PromQL queries into the expression console and view the results in the same window.
You can also query Prometheus from the command line. If you prefer working exclusively with a CLI, here's a list of Prometheus command line options/flags to help you practice using its REST API to tinker around with an instance and relative configuration variables.
Every command thereat would follow the format:
./prometheus -<flag>
Now for the actual PromQL experience.
Introduction to PromQL
By now, you know what PromQL is and what you can achieve when executing well-written queries. This section delves into the how part of creating said queries and expressions.
To start with, the basic syntax of PromQL follows the general form of Google's Re2 (re ~ regular expressions) standards. You won't have to know it by heart, but it serves well as a good manual for creating custom expressions within the allowed syntactic bounds. At the very least, it should serve as a guide on how to mix the supported data types for unique expression logic construction.
Let's break down a simple expression to learn by example:
http_requests_total{job="apiserver", handler="/api/comments"}[5m]
The expression above queries the time series engine for all http_requests_total occurrences that come under the apiserver job and /api/comments handler. The intended output would be a range that spans five minutes [5m] from the moment the expression executes.
Such a request, when executed in the default Prometheus browser, would yield a graph dating back to the span/interval specified. Removing the time variable would give a single vector result closest to the time of execution, if any.
Earlier, we touched on the topic of subqueries as a way of creating more refined sets of time series results from expressions. Essentially it dials down the results of the main query (the ones we examined above) to produce a specific subset.
Here's a typical subquery and a breakdown of its structure:
rate(http_requests_total{job="apiserver", handler="/api/comments"}[5m])[range,resolution]
As described in the earlier example, this subquery applies the same logic, only that it further requests for the rate of occurrences of the query result over a specified range. The resolution would be the spread of a specified range, crucial for displaying the output as graphical visualizations.
One can tinker around with subqueries and have nested queries (brackets(within brackets(within brackets))), but this just complicates time-series analysis and makes understanding custom queries a cumbersome chore for other team members. A best practice when writing these is to create separate queries when the urge to nest arises.
PromQL comes with a handy library of built-in functions that help craft useful queries. Utilizing the functions library can take you from a beginner to an adept user quickly.
Here's a typical function:
label_join(up{job="api-server",src1="a",src2="b",src3="c", srcN="z"}, "New", ",", "src1", "src2", "src3", srcN)
Put simply, the label_join() function above returns a new time series ("New"), which has values from the specified sources. In this case, these are (a, b, c, z). There is no limit to the number of sources you can concatenate this way. The separator element should also be defined in the function. In this case, it is a simple comma separator (",").
Conclusion: Improving Your PromQL Scripting Skills
Prometheus is a powerful metrics monitoring tool every DevOps professional should be acquainted with. Not only does it store system event data in a time-series format, but it also comes packed with functionality to query and display useful snapshots (tables) and combined perspectives (views) of data in real-time. This is made possible by an expressive requesting language (PromQL) that communicates with the time-series engine.
Writing good queries takes practice but should be of no consequence to professionals familiar with other database query languages. Knowing your Prometheus instance's structure and storage logic goes a long way in getting the most from every query draft. In addition, it will improve your PromQL query scripting and referencing of given function libraries from time to time.
Prometheus is a powerful metrics monitoring tool. But it provides a basic visualization layer. It is often combined with Grafana, an open source data visualization tool, to build richer dashboards. Moreover, Prometheus is more suited to getting infrastructure and resource metrics. Getting application metrics from Prometheus is not an easy task.
SigNoz - a better alternative to Prometheus
Metrics are just one aspect of monitoring your software systems. You need other types of telemetry (logs and traces) too to set up robust performance monitoring. SigNoz, an open source APM can help you collect, visualize, and analyze all three types of telemetry data - metrics, traces, and logs. It provides out-of-box charts for application metrics like p99, p95, and p50 latency.
You can also correlate your metrics with traces easily to investigate the root causes of performance issues.

It is easy to get started with SigNoz. It can be installed on macOS or Linux computers in just three steps by using a simple installation script.
The install script automatically installs Docker Engine on Linux. However, you must manually install Docker Engine on macOS before running the install script.
git clone -b main https://github.com/SigNoz/signoz.git
cd signoz/deploy/
./install.sh
You can visit our documentation for instructions on how to install SigNoz using Docker Swarm and Helm Charts.

You can check out SigNoz GitHub repo:
SigNoz is built to support OpenTelemetry natively. OpenTelemetry is becoming the world standard for generating and collecting telemetry data. You can read the following blogs to get more ideas on OpenTelemetry:
