Zabbix vs Grafana - Choosing the Right Observability Tool
When it comes to monitoring and observability, Zabbix and Grafana are two widely used tools. Each serves a unique purpose in helping organizations monitor their infrastructure and applications effectively. While Zabbix focuses on comprehensive infrastructure monitoring, Grafana excels in data visualization and dashboarding. This article dives into their key features, use cases, and examples to help you determine which tool aligns best with your requirements.
Zabbix vs. Grafana: At a Glance
The following table provides a high-level comparison between Zabbix and Grafana:
| Feature | Zabbix | Grafana |
|---|---|---|
| Core Functionality | IT infrastructure monitoring with built-in templates. | Data visualization platform for external sources. |
| User Interface | Traditional, preconfigured dashboards. | Modern, customizable, drag-and-drop dashboards. |
| Alerting | Advanced triggers with multi-channel notifications. | Dashboard-based alerts; integrates with Prometheus Alertmanager. |
| Setup | Complex initial setup; scales for enterprises. | Quick setup via Docker or Grafana Cloud. |
| Performance | Optimized for large-scale IT environments. | High performance for time-series data. |
| Pricing | Free and open-source; paid support optional. | Free core; paid plans for advanced features. |
Before we dive into the key differences between Zabbix and Grafana, let's briefly explore each platform.
Overview of Zabbix and Grafana
Zabbix: Infrastructure Monitoring and Alerting
Zabbix is an all-in-one, open-source monitoring tool designed primarily for tracking the health and performance of infrastructure components such as servers, networks, databases, and virtual machines. It provides a centralized platform for collecting, analyzing, and acting on metrics to identify and resolve potential issues before they impact users.
Key Features of Zabbix
- Comprehensive Infrastructure Monitoring: Tracks performance metrics for servers, network devices, and virtual machines.
- Agent-Based Data Collection: Zabbix relies on agents installed on target machines to collect detailed performance data, though it also supports agentless methods like SNMP.
- Proactive Alerting and Notifications: Sends alerts when certain thresholds are breached, helping you address issues quickly. It also supports escalation workflows to ensure the right person gets notified.
- Built-In Templates: Pre-configured templates simplify setup for monitoring popular hardware and software like MySQL, Apache, and Cisco devices. You can check out the built-in templates here.
- Historical Data Storage and Trend Analysis: Stores historical data to help identify long-term performance trends and anomalies.
Grafana: Data Visualization and Dashboarding
Grafana is a leading open-source data visualization and analytics platform that helps users turn raw metrics into visually intuitive dashboards. Unlike Zabbix, Grafana does not collect data itself but connects to various sources to display information in an accessible format.
Key Features of Grafana
- Advanced Data Visualization: Allows users to create interactive dashboards with charts, graphs, heatmaps, and more, making it easier to spot anomalies or trends.
- Integration with Multiple Data Sources: Grafana integrates seamlessly with a wide variety of data sources, including Prometheus, Elasticsearch, MySQL, and AWS CloudWatch.
- Custom Alerts and Notifications: Alerts can be configured directly from dashboard panels to notify teams of any critical events. These alerts integrate with tools like Slack, PagerDuty, and email.
- Extensive Plugin Ecosystem: Supports plugins for advanced visualizations, including world maps, pie charts, and tables.
- User-Friendly Dashboards: Grafana's drag-and-drop interface makes it simple for both technical and non-technical users to create and customize dashboards.
Feature Comparison: Zabbix vs. Grafana
When comparing Zabbix and Grafana, it’s important to focus on their key functionalities and how they cater to different use cases. Below is a breakdown of their core functionalities and user interfaces to help you understand their strengths:
Core Functionalities
Zabbix and Grafana excel in monitoring and visualization but approach these tasks differently based on their primary objectives.
Zabbix
Extensive Metric Collection: Zabbix collects performance data from a wide range of systems and protocols, including SNMP (Simple Network Management Protocol), IPMI (Intelligent Platform Management Interface), and JMX (Java Management Extensions). This makes it highly versatile for IT environments.
IT Infrastructure Monitoring: With a focus on infrastructure, Zabbix monitors servers, databases, and network devices to ensure they operate within acceptable thresholds.

Infrastructure Monitoring in Zabbix Built-In Discovery and Monitoring Templates: Zabbix simplifies setup through automated discovery and prebuilt templates for various devices and applications.
Grafana
Advanced-Data Visualization: Grafana specializes in creating dynamic and interactive dashboards that are perfect for time-series data and logs. It connects to multiple data sources, making it a powerful tool for teams that rely on visual analysis.

Dynamic and interactive dashboards in Grafana Focus on Time-Series Data: Grafana excels in time-series data analysis, making it an ideal choice for monitoring metrics like system performance over time or log-based trends.
Plugins for Extended Functionality: Grafana supports a rich ecosystem of plugins to add features like heatmaps, alerting, and integration with third-party tools.
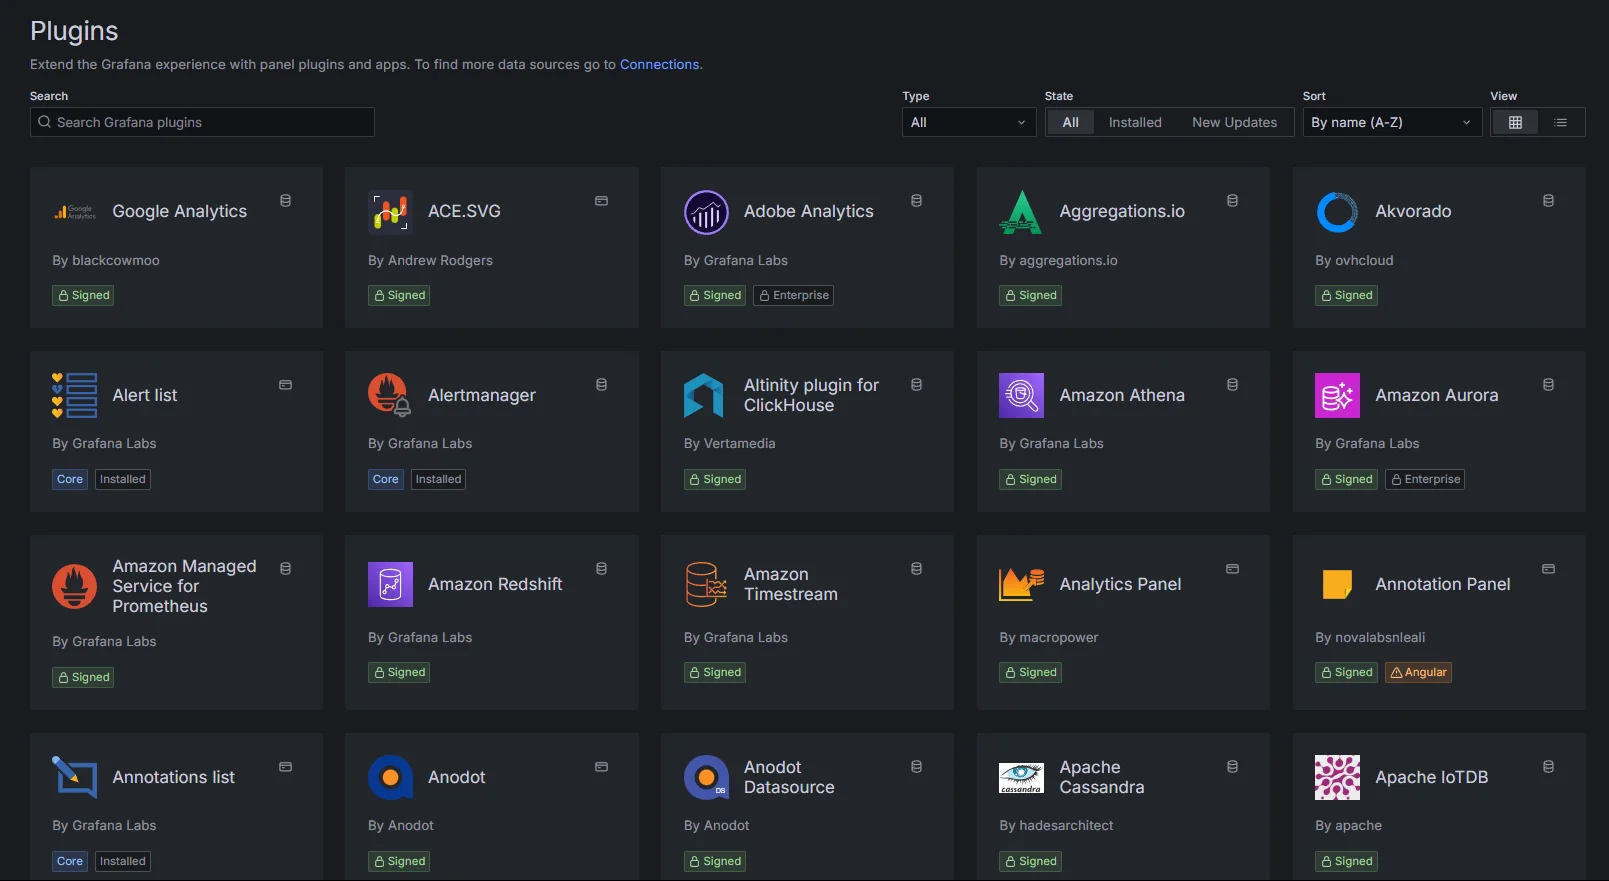
Community Plugins for Enhanced Features in Grafana
User Interface
The user interface is a critical factor when choosing between Zabbix and Grafana. While Zabbix provides a traditional, task-oriented interface, Grafana focuses on modern, customizable visuals.
Zabbix
Web-Based UI: Zabbix offers a centralized, web-based interface designed for IT administrators. The interface is task-focused and facilitates managing multiple devices from a single location.

Zabbix Web-based UI Traditional Design: The UI prioritizes functionality over aesthetics, making it ideal for those who prefer a straightforward, no-frills approach to IT monitoring.
Preconfigured Templates: Zabbix includes prebuilt templates for common devices and applications, simplifying the process of creating dashboards.

Built-In Templates for Quick Setup : Zabbix
Grafana
Modern and Customizable Interface: Grafana’s drag-and-drop dashboard builder allows users to create highly customizable visualizations. It’s intuitive enough for non-technical users yet powerful for advanced analytics.
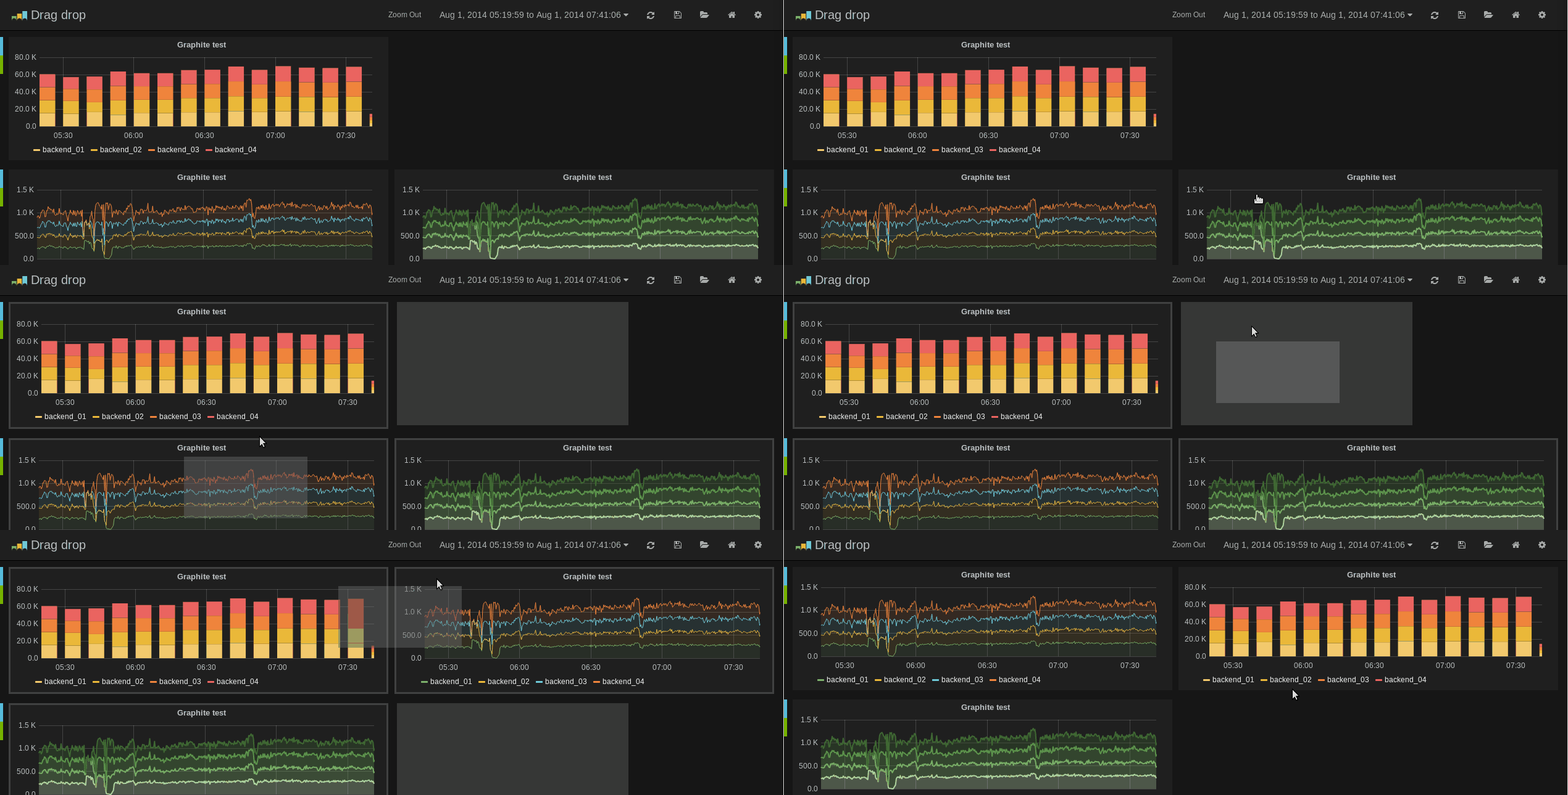
Grafana’s drag-and-drop dashboard builder Real-Time Visualization: The interface is optimized for real-time metrics and logs, providing live updates as data changes.
Interactive Themes: Grafana allows users to switch between light and dark themes for a more personalized experience.
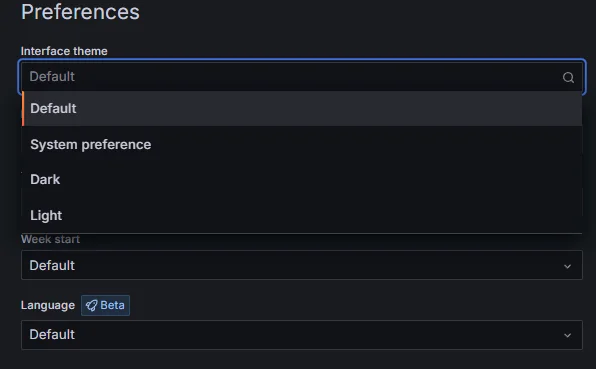
Setting Themes in Grafana
Alerting Capabilities
Alerting is a critical aspect of monitoring tools, ensuring that issues are detected and addressed promptly. Both Zabbix and Grafana offer alerting functionalities, but they cater to different needs.
Zabbix
- Advanced Triggers and Escalation: Zabbix provides a powerful trigger system where alerts are defined based on flexible thresholds and conditions. Alerts can be escalated based on severity, ensuring the right teams are notified.
Example: If a server's CPU usage exceeds 80% for 10 minutes, Zabbix can trigger an alert and escalate to senior administrators if unresolved.
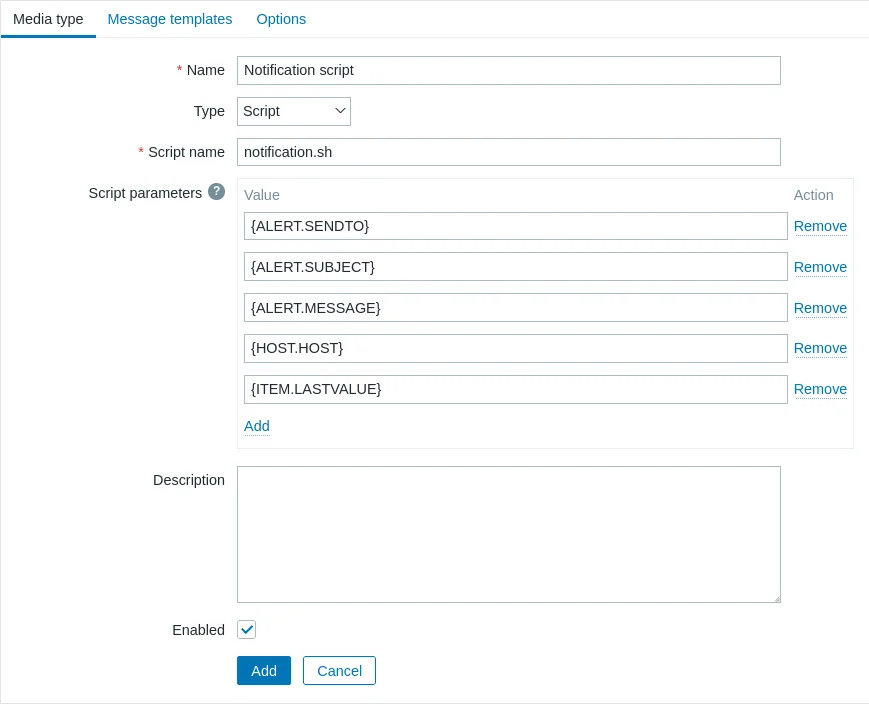
Sending alerts in Zabbix using Custom Scripts
- Multi-Channel Notifications: Zabbix supports notifications via multiple channels, including email, SMS, Slack, Microsoft Teams, and custom scripts. This versatility makes it suitable for enterprise environments.
- Infrastructure Health Focus: The alerting capabilities in Zabbix are specifically tailored for infrastructure health monitoring, ensuring timely detection of hardware and network issues.
Grafana
Metric-Based Alerting: Grafana’s alerting system is tied directly to the metrics displayed on dashboards, allowing for real-time notifications based on user-defined thresholds.
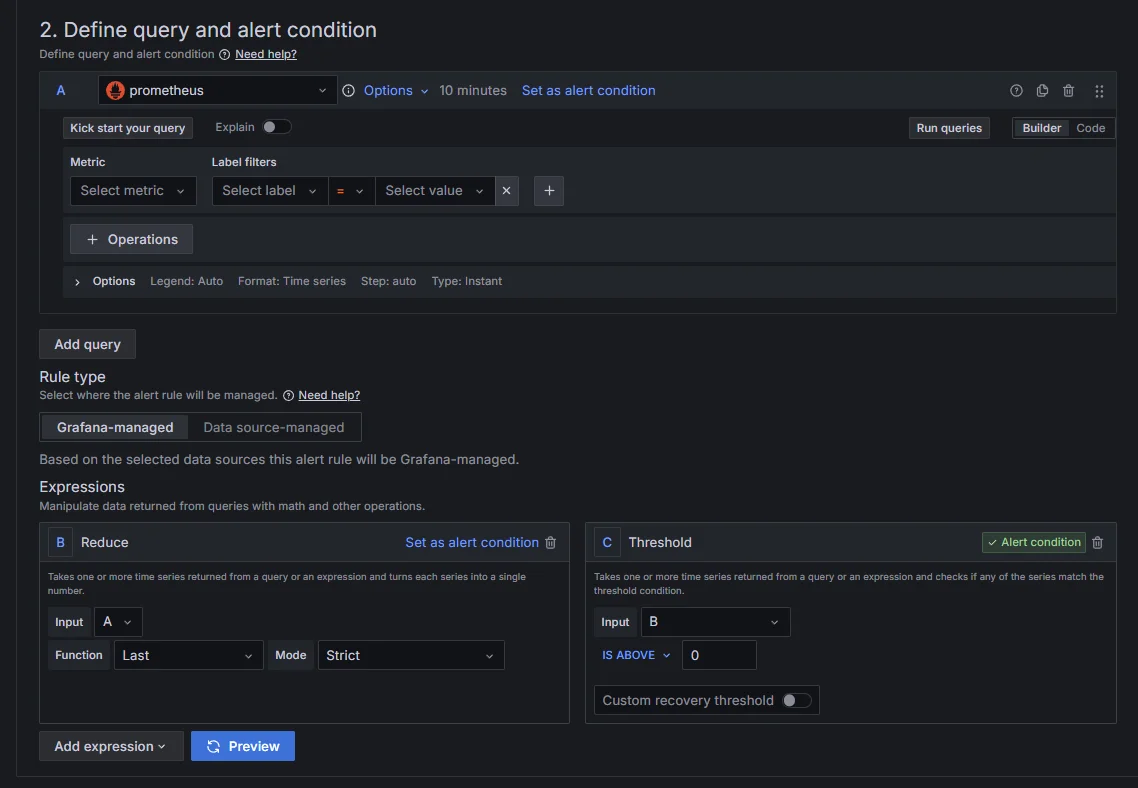
Custom alerts and notifications in Grafana Integration with Prometheus Alertmanager: For more complex workflows, Grafana integrates seamlessly with Prometheus Alertmanager, enabling routing, grouping, and silencing of alerts.
Less Robust Standalone Alerting: While Grafana’s alerting works well for visualization-based scenarios, it’s less comprehensive than Zabbix for standalone infrastructure monitoring. It’s best used as part of a larger monitoring stack.
Ease of Setup and Configuration
Setting up monitoring tools can vary in complexity, depending on the tool's architecture and flexibility. Here’s how Zabbix and Grafana differ in terms of setup and configuration.
Zabbix
- Comprehensive Setup Requirements: Zabbix requires the installation of a server, a database for storing metrics (e.g., MySQL or PostgreSQL), and agents on monitored devices. While the setup is more involved, it’s designed to support enterprise-scale infrastructure.
- Time-Intensive Initial Configuration: The initial configuration process, including defining hosts, creating triggers, and setting up templates, can be time-consuming but ensures scalability and reliability.
- Built-In Templates for Simplification: Zabbix offers prebuilt templates for common use cases, reducing the time needed for configuration.
Grafana
Quick Installation: Grafana is easy to set up, whether you use Docker, package managers, or Grafana Cloud. The installation process is straightforward and user-friendly.
Example: Spinning up Grafana on Docker with a single command:
docker run -d -p 3000:3000 grafana/grafana
Seamless Integration with Data Sources: Grafana’s setup largely depends on integrating it with data sources like Prometheus, InfluxDB, or Elasticsearch. The configuration process is intuitive, with guided steps for connecting and querying data.

Multiple data sources in Grafana Scales for Diverse Use Cases: Grafana’s modular architecture makes it adaptable for different teams and industries. For example, a SaaS company can use Grafana to monitor both infrastructure metrics and user engagement KPIs.
Performance and Scalability
Both tools are designed to handle large-scale environments, but their scalability depends on the underlying architecture and use case.
Zabbix
- Enterprise-Level Scalability: Zabbix scales well for large IT infrastructures by optimizing database usage and supporting distributed monitoring with proxies.
- High-Frequency Data Collection: Zabbix can handle frequent metric collection, but very large environments may require database tuning to maintain performance.
- Distributed Monitoring: Zabbix proxies enable decentralized monitoring, ensuring minimal downtime and improved reliability in global setups.
Grafana
- Optimized for Visualization Performance: Grafana is built for low-latency, high-performance visualization of time-series data, making it ideal for real-time monitoring.
- Scalability Depends on Data Source: While Grafana itself is lightweight, its scalability relies on the performance of connected data sources like Prometheus or Elasticsearch.
- Supports Massive Data Volumes: With the proper configuration of data sources, Grafana can handle vast amounts of data without performance degradation.
Pricing and Licensing
Pricing models can significantly impact your choice of monitoring tools, especially when scaling for enterprise use. Let’s break down the costs and licensing structures for Zabbix and Grafana.
Zabbix
Completely Free and Open-Source: Zabbix is entirely open-source under the GNU General Public License (GPL). This means there are no licensing costs, making it an excellent choice for organizations on a tight budget or those favoring open-source solutions.
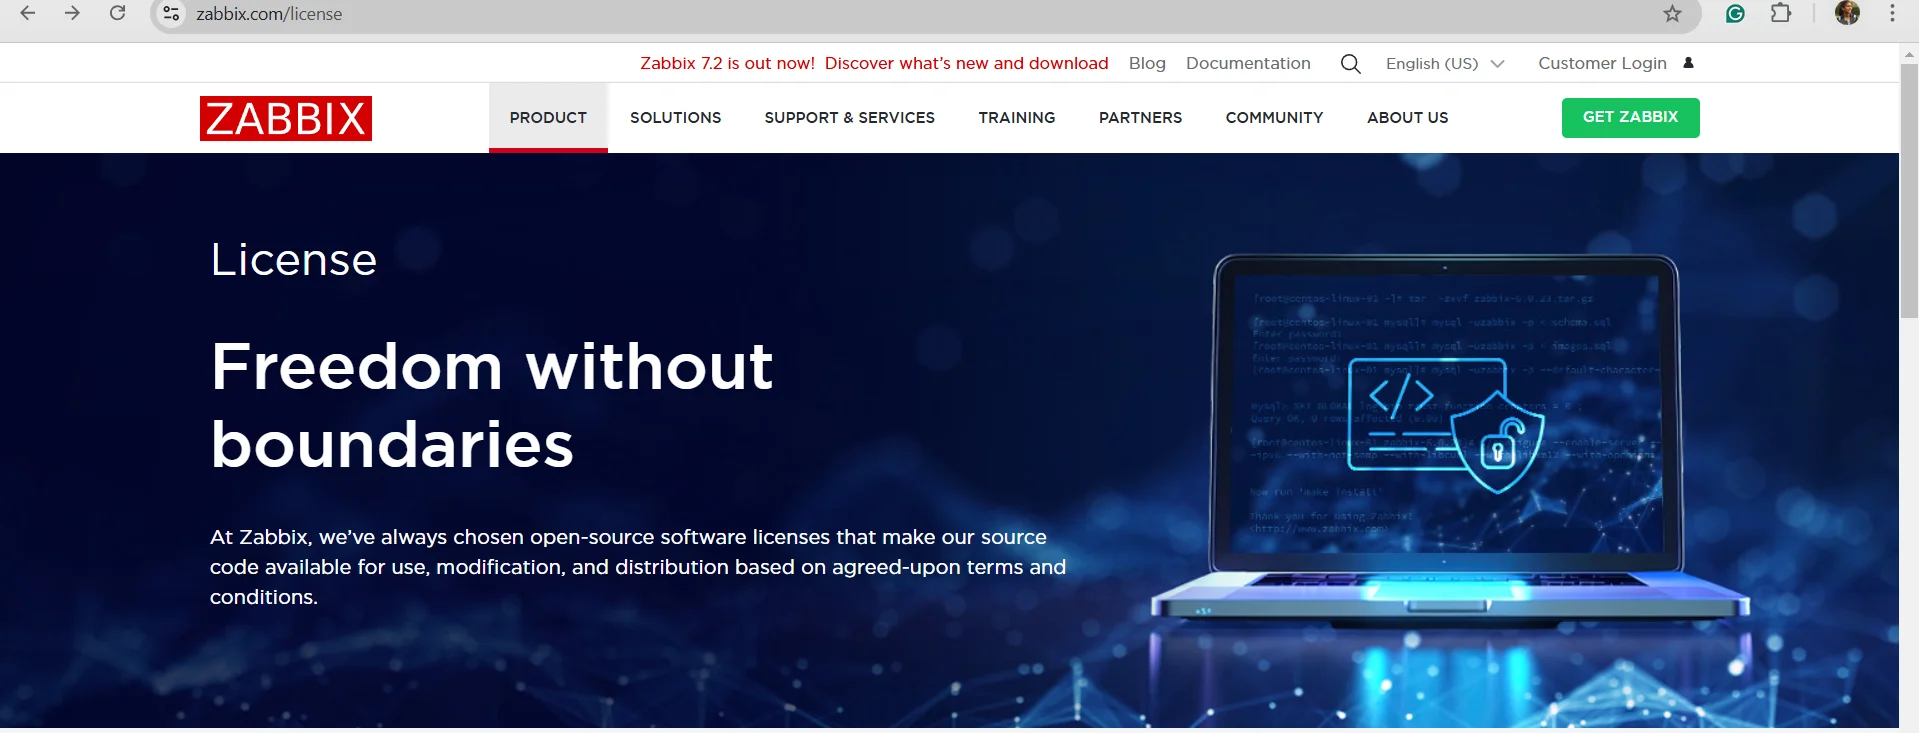
Zabbix is free to use Optional Enterprise Support: For large organizations that require dedicated support, Zabbix offers optional paid enterprise plans. These plans include expert assistance, SLA-based services, and access to additional tools.
Grafana
Free for Open-Source Usage: Grafana’s core functionality is available for free under the Apache 2.0 License. This makes it highly accessible for developers and small teams.
Paid Plans for Grafana Cloud: Grafana offers premium plans through Grafana Cloud, which include advanced features like enhanced scalability, hosted solutions, and extended data retention. Plans range from free tiers with basic limits to enterprise-level offerings.

Grafana Pricing
Check out the detailed pricing here.
Use Cases: Which Tool Should You Choose?
Choosing between Zabbix and Grafana depends on your organization’s specific needs. Below are scenarios where each tool excels:
When to Choose Zabbix
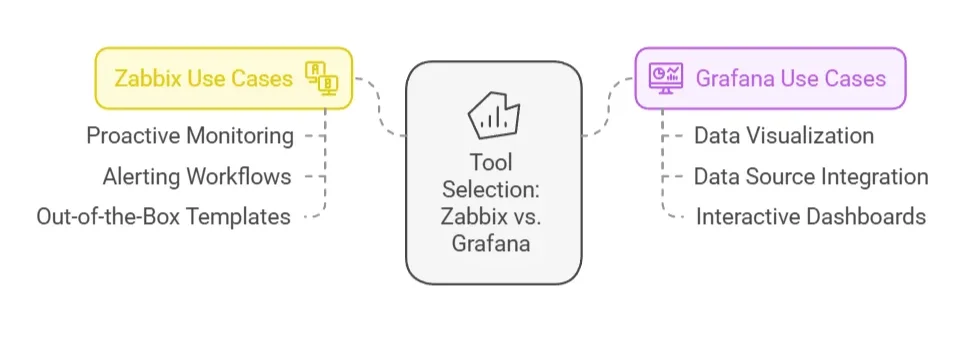
Proactive IT Infrastructure Monitoring:
If your primary goal is to monitor servers, network devices, and hardware for health and availability, Zabbix provides agent-based monitoring, SNMP support, and built-in discovery.
Comprehensive Alerting and Notification Workflows:
Zabbix excels in creating advanced triggers, alert escalations, and multi-channel notifications for quick issue resolution.
Out-of-the-Box Templates for Common Environments:
Predefined templates simplify the monitoring setup for popular systems and applications like MySQL, Apache, or Docker.
When to Choose Grafana
Advanced Visualization of Time-Series Data:
For teams looking to create detailed, dynamic dashboards to visualize metrics over time, Grafana offers unmatched flexibility and aesthetics.
Integration with Multiple Data Sources:
Grafana seamlessly connects with Prometheus, Elasticsearch, MySQL, and more, making it ideal for consolidating data from diverse systems.
Interactive Dashboards for Analytics:
Grafana’s drag-and-drop interface and customizable widgets are perfect for analytics-driven teams who need to present insights effectively.
A Better Alternative to Zabbix and Grafana: SigNoz
If you're looking for a solution that combines the best features of both Zabbix and Grafana while offering additional advantages, SigNoz is a powerful alternative that enhances your observability stack.
SigNoz vs. Zabbix
Focus Area: Zabbix specializes in infrastructure monitoring (CPU, memory, network, hardware metrics), while SigNoz is designed as an unified observability platform.
Data Collection: Zabbix relies on agents and SNMP polling, whereas SigNoz uses OpenTelemetry, allowing deeper insights into application and system behavior.
Observability: SigNoz offers distributed tracing and log correlation, which are not core features in Zabbix.

Unified Observability in SigNoz Adoption Curve: Zabbix has a steeper learning curve with complex configuration requirements, while SigNoz provides a more intuitive setup with OpenTelemetry's standardized instrumentation.
SigNoz vs. Grafana
Data Handling: Grafana is mainly a visualization layer that connects to various data sources (Prometheus, Loki, InfluxDB, etc.), whereas SigNoz stores, processes, and visualizes telemetry data in one platform.
.webp)
SigNoz Metric Dashboard Correlation: Grafana lacks native trace-log-metric correlation, requiring multiple tools, while SigNoz integrates all observability signals natively.
Querying: Grafana supports PromQL and other query languages but requires external storage. SigNoz provides native querying with PromQL support.
Deployment Complexity: With Grafana, you need to manage multiple components (Prometheus, Loki, Tempo) separately, while SigNoz offers a single deployment for complete observability.
Key Advantages of SigNoz
- End-to-End Solution: SigNoz eliminates the need to maintain separate tools for metrics, traces, and logs, reducing operational overhead.
- OpenTelemetry Native: Built from the ground up to support the industry-standard OpenTelemetry framework, ensuring future-proof observability.
- Reduced Tool Sprawl: Consolidate your monitoring stack instead of managing additional tools for APM.
- Cost Efficiency: SigNoz's open-source approach provides enterprise-grade observability without the premium pricing of proprietary solutions.
SigNoz Cloud is the easiest way to run SigNoz. Sign up for a free account and get 30 days of unlimited access to all features.
You can also install and self-host SigNoz yourself since it is open-source. With 24,000+ GitHub stars, open-source SigNoz is loved by developers. Find the instructions to self-host SigNoz.
Key Takeaways
- Zabbix is great for infrastructure monitoring, offering built-in agent-based monitoring, high customizability, and robust alerting systems.
- Grafana is useful for data visualization and dashboard creation, particularly effective in integrating with time-series databases like Prometheus, and creating visually appealing, interactive reports.
- Choose Zabbix if you need a comprehensive monitoring solution with built-in features for large-scale IT infrastructure, alerting, and reporting.
- Choose Grafana if you need powerful data visualization, real-time monitoring, and dashboard flexibility, especially when using time-series data from various sources.
FAQs
What are the core functionalities and purposes of Zabbix and Grafana, and how do they differ in their approach to monitoring?
Zabbix is a full-fledged monitoring solution that collects metrics and offers alerting, reporting, and customizability. Grafana is focused on visualizing data, particularly time-series data from external sources like Prometheus.
How do the user interfaces and data visualization capabilities of Zabbix and Grafana compare in terms of usability and aesthetics?
Zabbix has a functional but utilitarian UI, while Grafana offers sleek, interactive dashboards that are easier to navigate and more visually engaging.
What are the key differences in the alerting and notification systems of Zabbix and Grafana, and how do they help users stay informed about critical events?
Zabbix has a robust, built-in alerting system with customizable thresholds and notification methods, while Grafana’s alerting is more basic and relies on external systems like Prometheus.
Which tool is easier to set up and configure, and what are the trade-offs between the power and accessibility of each solution?
Zabbix requires more effort to set up but offers a complete monitoring solution, while Grafana is easier to set up for visualization but depends on other tools for full monitoring functionality.
How do the pricing models and licensing options of Zabbix and Grafana compare, and what are the considerations for enterprise and open-source deployments?
Both Zabbix and Grafana offer open-source versions. Zabbix has a premium enterprise version, while Grafana offers both an open-source and enterprise version with advanced features for team collaboration and security.
