Zabbix vs Prometheus (2026) - The Definitive Comparison
Zabbix and Prometheus are two popular open-source monitoring tools, but they are built for fundamentally different use cases. Zabbix is an all-in-one, traditional monitoring suite designed for stability and broad compatibility. Prometheus is a more specialized, time-series database and alerting tool at the heart of the cloud-native ecosystem.
This comparison breaks down the key differences in 2026, paying close attention to recent updates like Zabbix 7.x's improved high availability and Prometheus 3.x's native OpenTelemetry support. We'll cover architecture, data collection, scalability, and the specific use cases where each one excels.
TL;DR: When to Pick Zabbix vs. Prometheus
| Feature | Zabbix | Prometheus |
|---|---|---|
| Primary Scope | All-in-one infrastructure monitoring (metrics, events, UI) | Time-series metrics and alerting |
| Architecture | Server-agent, centralized (SQL DB) | Pull-based, decentralized (local TSDB) |
| Data Collection | Agents (push/pull), SNMP, JMX, IPMI, ODBC | Pull via HTTP /metrics (Exporters), Push (Pushgateway) |
| Best For | Traditional IT: servers, network devices, VMs | Cloud-Native: Kubernetes, microservices, containers |
| Alerting | Built-in UI, complex escalations, dependencies | PromQL rules (YAML) + external Alertmanager |
| Visualization | Rich built-in UI (dashboards, maps) | Built-in UI (revamped in v3.0) for querying and exploring metrics; teams still commonly use Grafana for full dashboards. |
| High Availability | Native HA cluster (active-standby), Proxy HA (7.0+) | Run duplicate servers + clustered Alertmanager |
| OpenTelemetry | Roadmap for 8.0 (2026), not native in 7.x | Native OTLP ingest support (3.x) |
What is Prometheus?
Prometheus is an open-source monitoring and alerting toolkit originally built at SoundCloud and now a graduated project of the Cloud Native Computing Foundation (CNCF).
Its scope is intentionally focused: it is a time-series database. It excels at collecting and querying multi-dimensional metrics, making it the de-facto standard for monitoring dynamic, cloud-native environments like Kubernetes.
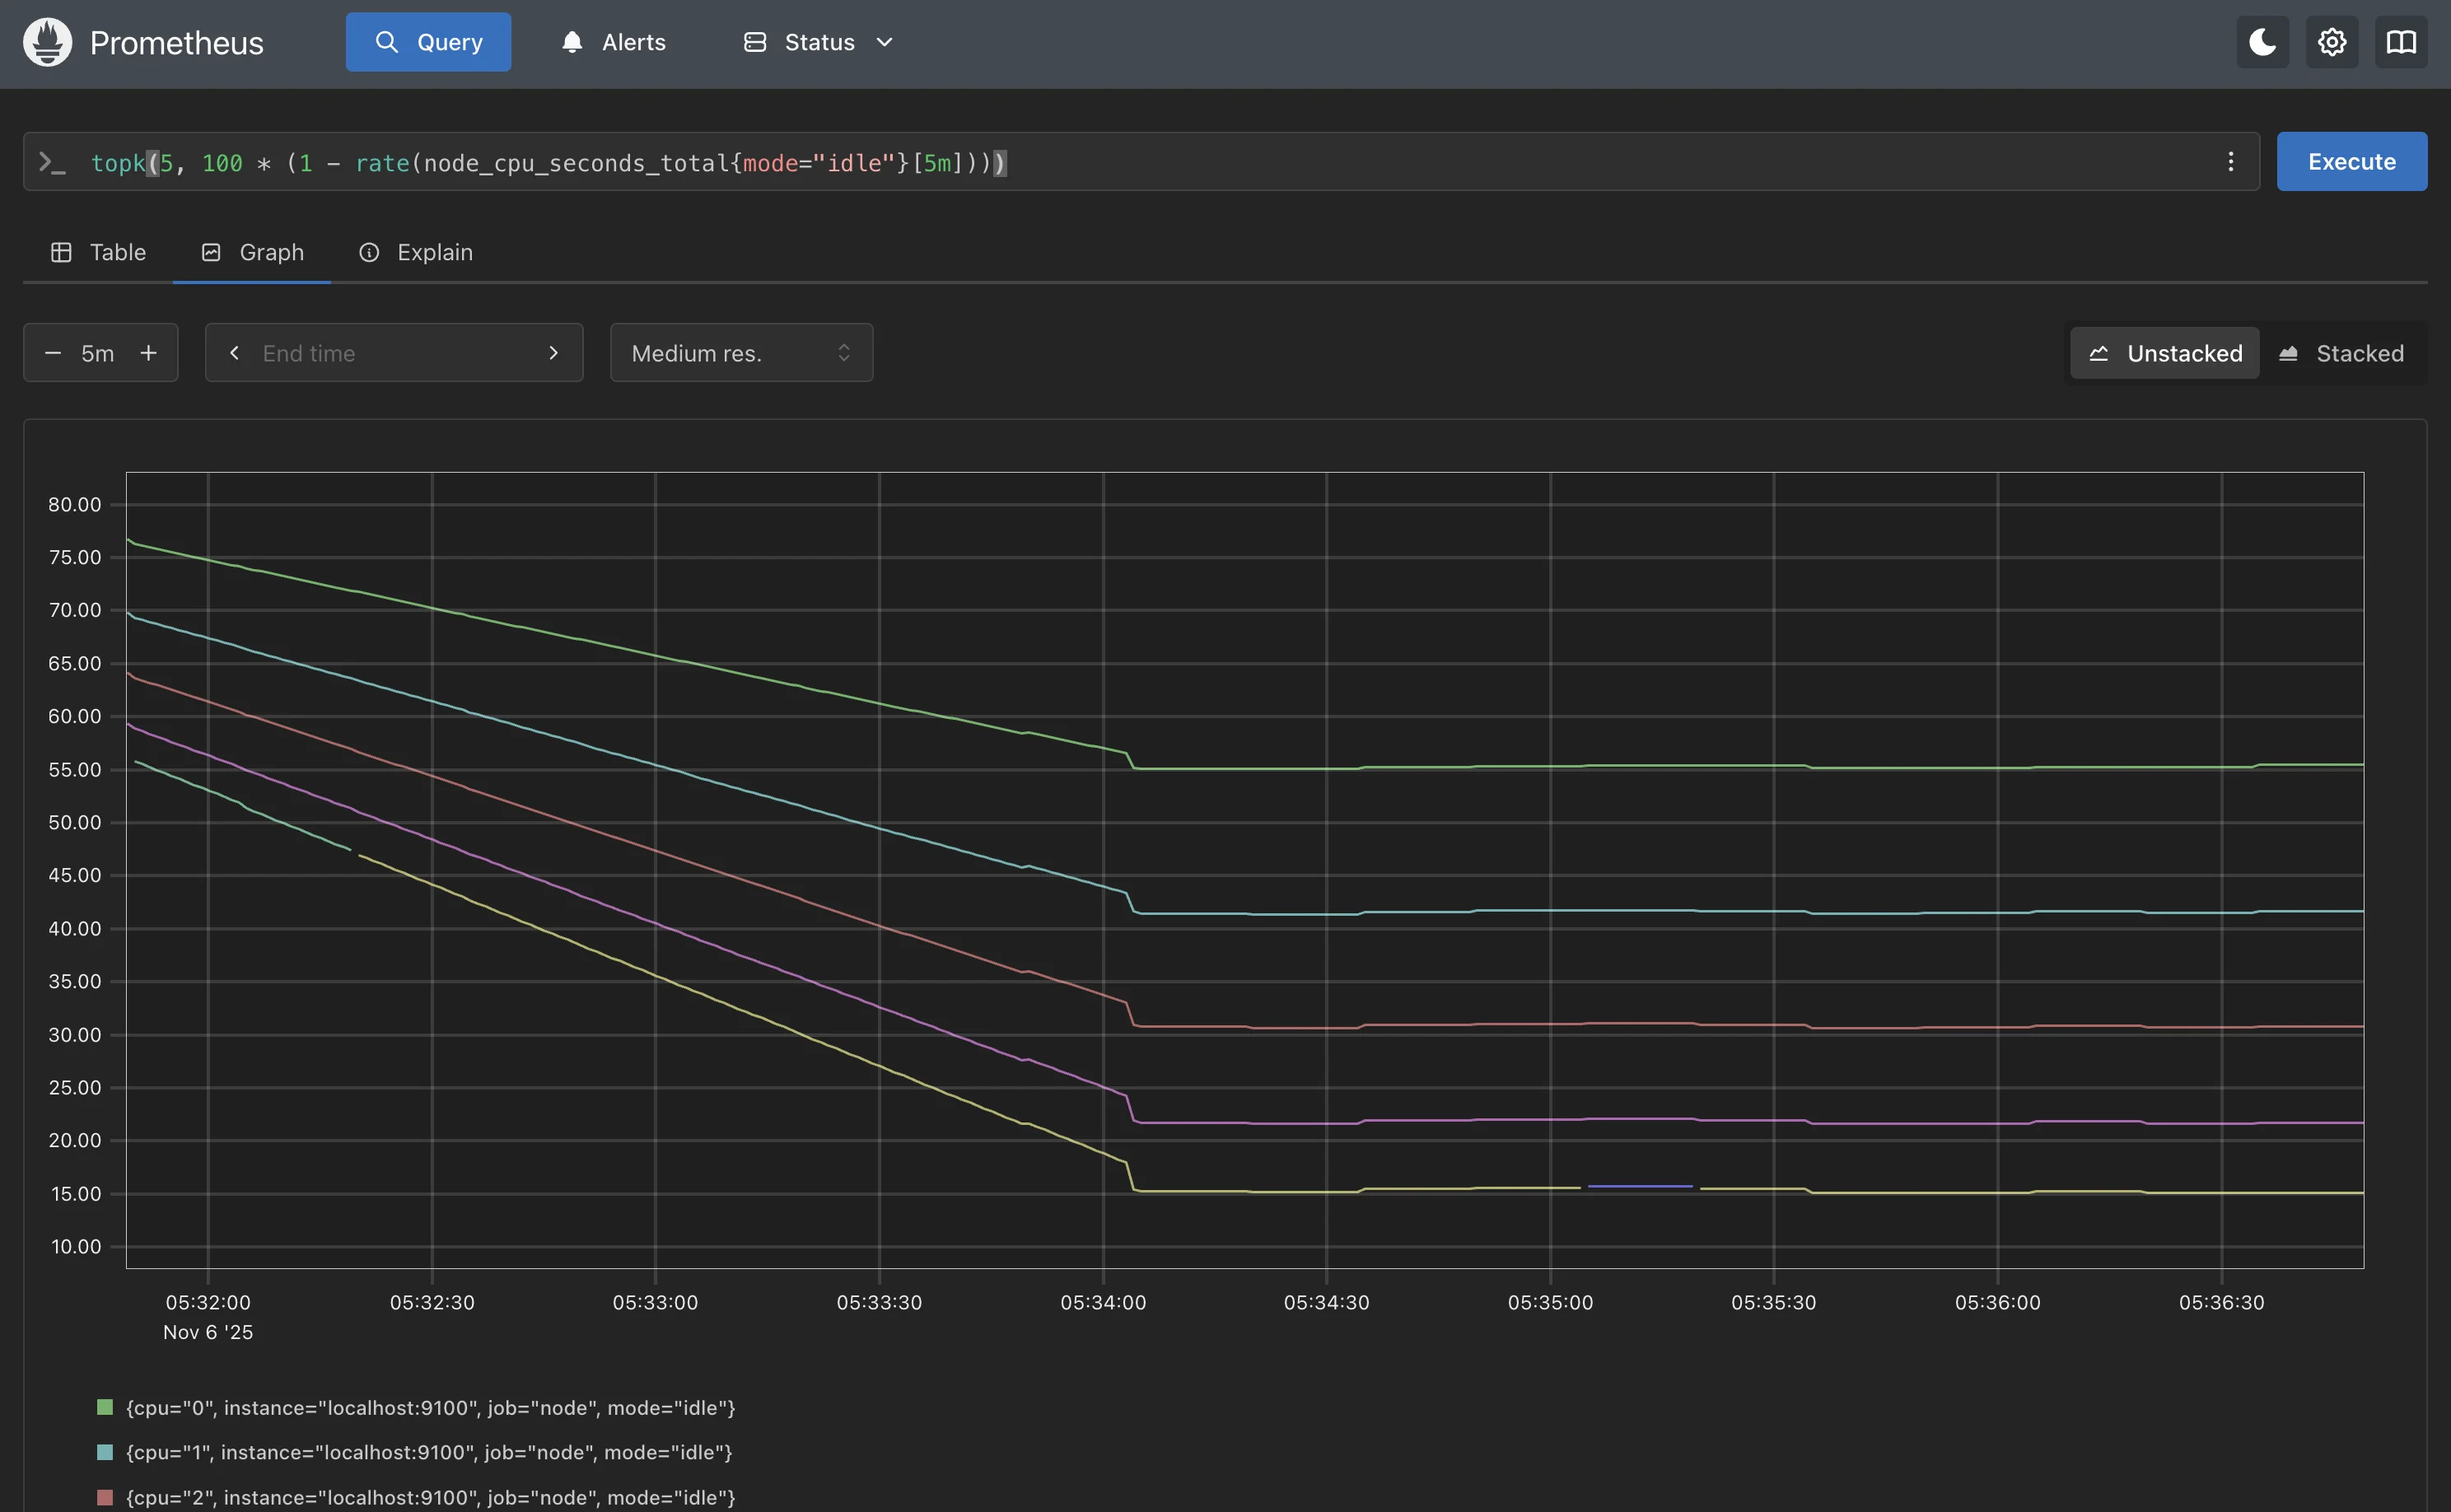
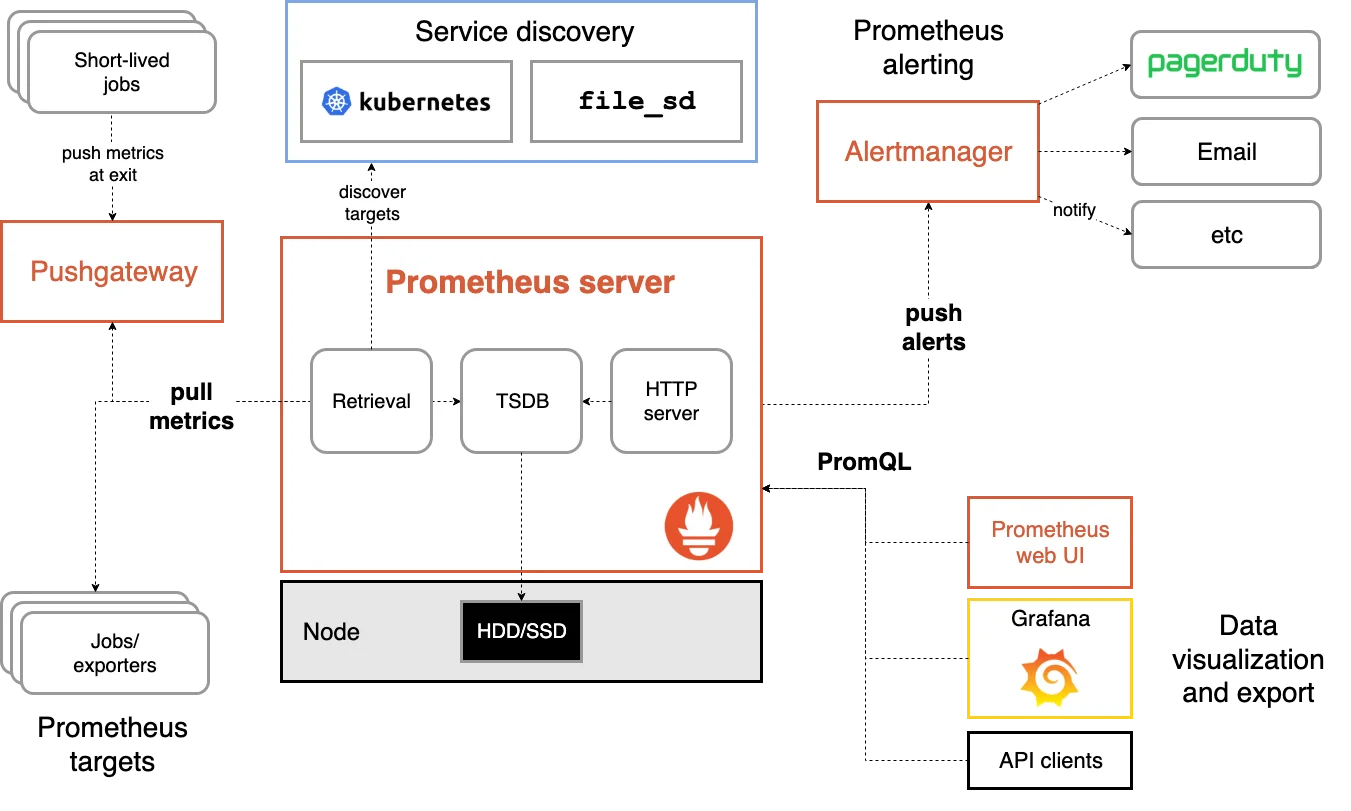
Prometheus operates on a pull-based model, where the server actively scrapes metrics from HTTP endpoints on targets. It stores this data in a highly efficient local time-series database. Analysis and alerting are done using its powerful query language, PromQL. For a complete monitoring stack, Prometheus is typically combined with other components like Grafana (for dashboards) and Alertmanager (for alert routing and deduplication).
What is Zabbix?
Zabbix is an all-in-one, enterprise-grade open-source monitoring solution. It provides a complete package that includes data collection, storage, a rich web-based UI for visualization, and a flexible alerting system.
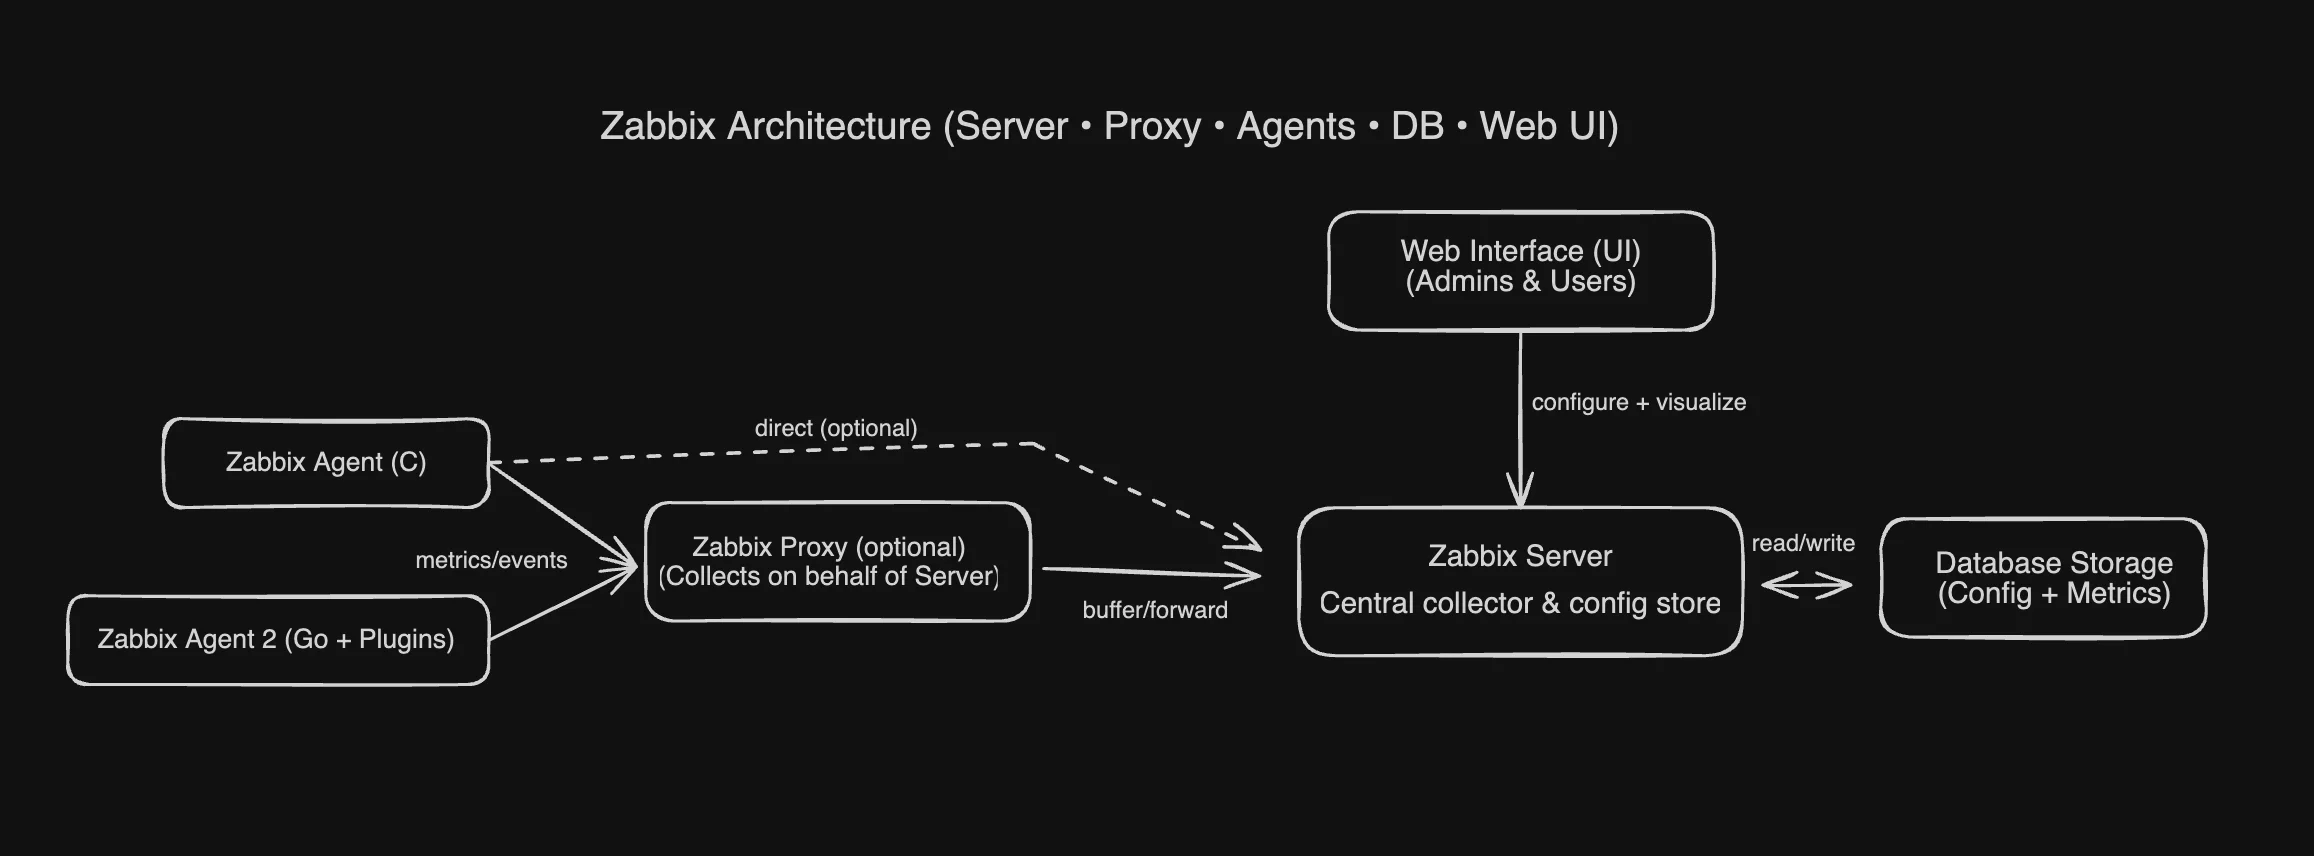
Its architecture is based on a traditional server-agent model. A central Zabbix server polls or receives data from Zabbix agents running on monitored hosts. It also has strong native support for agent-less monitoring using protocols like SNMP, JMX, and IPMI, making it a favorite for network and hardware monitoring. All configuration and collected data are stored in a centralized relational database (like MySQL or PostgreSQL).
Core Differences: Zabbix vs. Prometheus
While both tools monitor infrastructure, their approach and design differ significantly.
1. Architecture
Prometheus uses a pull-based, decentralized architecture.
- Each Prometheus server is autonomous. It scrapes metrics from configured targets (like applications, servers via an exporter, or Kubernetes clusters) over HTTP.
- Data is stored in its own local time-series database (TSDB) on disk.
- This design is simple to start with (a single binary) and scales horizontally. For long-term storage and a global view, it integrates with tools like Thanos or Mimir.
Zabbix uses a centralized, server-agent architecture.
- A central Zabbix server (or HA cluster) acts as the brain. It stores all configuration, history, and trend data in a SQL database.
- Zabbix agents run on monitored hosts and can operate in two modes: passive (the server polls the agent) or active (the agent pushes data to the server).
- For distributed environments, Zabbix proxies can be deployed to collect data locally before forwarding it to the server, reducing server load and simplifying network configuration.
2. Data Collection and Service Discovery
This is one of the most significant differences and often the deciding factor.
Prometheus is built for dynamic environments.
- Collection: It primarily pulls metrics from HTTP endpoints exposing data in the Prometheus/OpenMetrics format. This is achieved by applications either using a client library to expose a
/metricsendpoint directly or by using an exporter (a sidecar that translates metrics from other systems, like a database or the Node Exporter for OS metrics). - Service Discovery: Its key strength is dynamic service discovery. Prometheus can automatically find and start monitoring targets by querying APIs from Kubernetes, AWS, Consul, and more. This is perfect for environments where containers and VMs are created and destroyed frequently.
Zabbix is built for broad, multi-protocol monitoring.
- Collection: It supports a vast range of collection methods:
- Zabbix Agent: A powerful agent for OS and application metrics.
- SNMP: First-class support for polling network devices like switches and routers.
- JMX, IPMI, ODBC: Native support for monitoring Java applications, hardware, and databases.
- Scripts: Can run custom scripts or commands to check anything.
- Service Discovery: Zabbix uses Low-Level Discovery (LLD). This is powerful for discovering static resources, like file systems on a host, network interfaces on a switch, or new hosts on a network segment. It is less suited for the high-churn, API-driven discovery of cloud-native platforms.
3. Data Storage and Scalability
Prometheus prioritizes query speed and efficiency with its local TSDB.
- Storage: The TSDB is highly optimized, using around 1-2 bytes per sample. Retention is typically short-term (e.g., 15 days) by default.
- Scalability: For long-term retention and high availability, the community standard is to use use remote write to backends like Mimir or SigNoz, or run Thanos with the sidecar/receive components to achieve long-term retention and a global query layer. Scaling is achieved by running multiple Prometheus instances (sharding) and using a global query layer on top.
Zabbix relies on a relational database, which has different scaling properties.
- Storage: Zabbix stores all data in MySQL, PostgreSQL, or Oracle. It separates data into
History(raw data) andTrends(hourly aggregates) to manage long-term storage. - Scalability: Scaling Zabbix means scaling its database. This can be a bottleneck, and large deployments require powerful database hardware and careful tuning (e.g., using TimescaleDB with PostgreSQL). Load is distributed using Zabbix proxies, which can buffer data and offload the main server.
4. Alerting
Prometheus decouples alerting logic from notification.
- Alert Definition: Alerts are defined as rules using PromQL in YAML configuration files. This is extremely powerful, allowing for complex and flexible alert conditions (e.g., "alert if the 95th percentile latency is over 500ms for 5 minutes").
- Notification: The Prometheus server sends firing alerts to a separate component, the Alertmanager. Alertmanager handles deduplication, grouping, silencing, and routing alerts to the correct receiver (like PagerDuty, Slack, or email).
Zabbix provides an integrated, UI-driven alerting system.
- Alert Definition: Alerts, called Triggers, are defined in the web UI based on expressions against collected items.
- Notification: Zabbix has a built-in system called Actions that handles notifications. Its strength lies in complex escalation workflows. For example: send an email, wait 5 minutes, if still a problem, send an SMS to an on-call engineer, wait 30 minutes, then escalate to a manager. It also supports acknowledgments and dependencies.
5. Visualization
Prometheus includes only a basic expression browser for running PromQL queries and viewing simple graphs. The standard practice is to use Grafana as the primary visualization layer. The Prometheus-Grafana pairing is powerful and flexible.
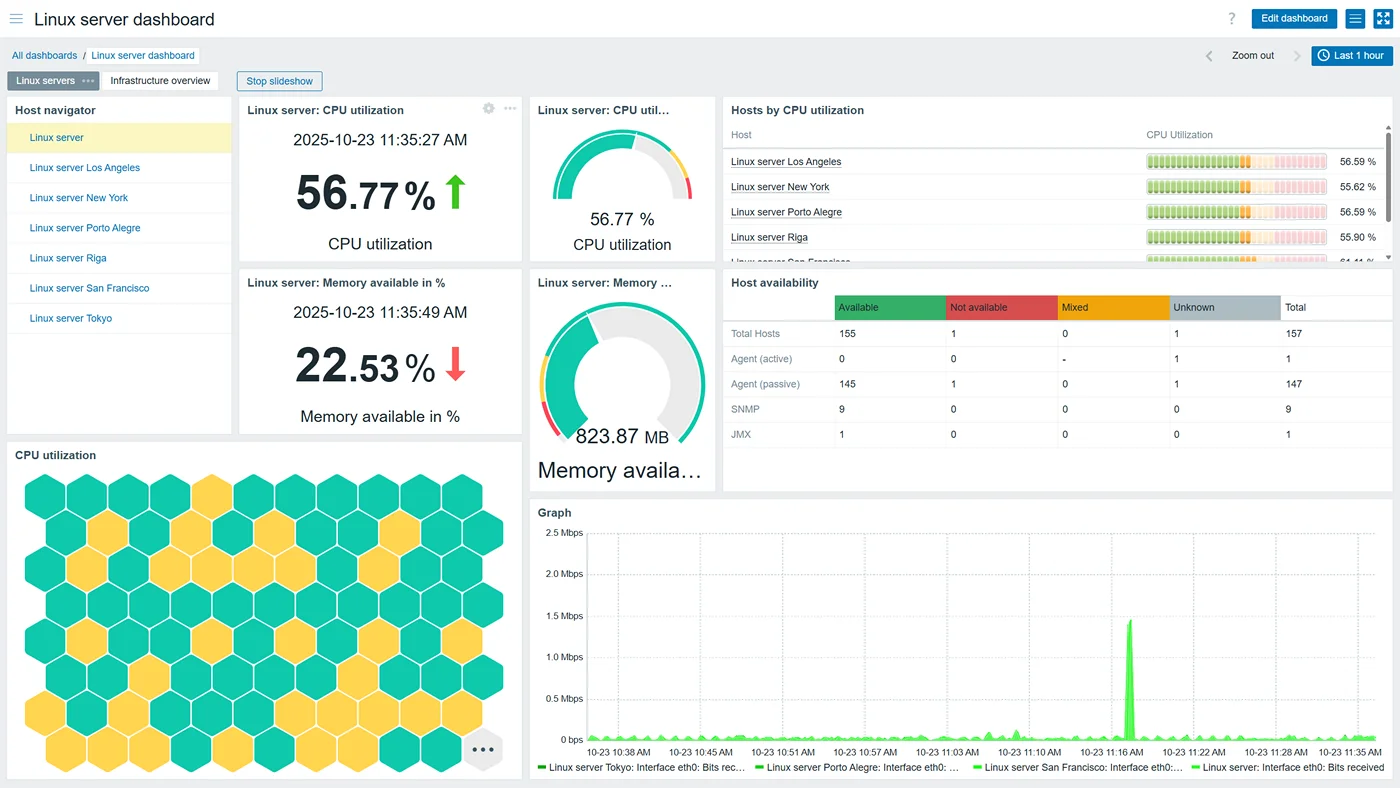
Zabbix provides a comprehensive, built-in web interface. Out of the box, it offers customizable dashboards, graphs, network maps, and problem-view screens. While it can also be used as a data source for Grafana, many users find the native Zabbix UI sufficient for their needs.
6. Cloud-Native (Kubernetes) vs. Traditional (Network Gear)
For Kubernetes and Microservices, Prometheus wins. Its native service discovery, pull model, and label-based data model (PromQL) were designed specifically for this world. It seamlessly discovers and monitors new pods and services as they are deployed.
For Network Monitoring (SNMP) and diverse IT, Zabbix wins. Zabbix's first-class SNMP support, pre-built templates for hundreds of vendors, and low-level discovery make monitoring a diverse network of switches, routers, and firewalls much simpler.
7. High Availability (HA)
Both tools have strong HA stories in 2026, but they are implemented differently.
Prometheus HA is achieved through redundancy. The standard setup is to run two identical Prometheus servers scraping the same targets. A clustered Alertmanager then receives alerts from both and deduplicates them, ensuring you only get paged once.
Zabbix HA is now a native feature. Since version 6.0, you can run a cluster of Zabbix servers in an active-standby model. If the active server fails, a standby server takes over within seconds. Version 7.0 (released in 2024) also introduced HA for Zabbix proxies.
8. OpenTelemetry (OTel) Integration
This is a major new differentiator.
Prometheus has embraced OpenTelemetry. Recent versions (3.x) can natively ingest OTLP metrics (OpenTelemetry's native protocol). This allows OTel-instrumented applications to send metrics directly to Prometheus, simplifying the stack.
Zabbix does not have native OTLP ingest in the current 7.x LTS release. OTel support is on the public roadmap for Zabbix 8.0 LTS (planned for 2026).
What Prometheus Offers (That Zabbix Doesn't)
- Powerful Query Language (PromQL): The ability to slice, dice, and aggregate high-cardinality, multi-dimensional metrics in real-time.
- Native Cloud Service Discovery: Automatically finds and monitors ephemeral resources in Kubernetes, AWS, etc.
- Vibrant Exporter Ecosystem: A massive community of exporters to get metrics from almost any third-party system.
- Configuration-as-Code: All configuration (scrape jobs, alerting rules) is in YAML files, which fits perfectly with GitOps and CI/CD workflows.
What Zabbix Offers (That Prometheus Doesn't)
- All-in-One Platform: A single, integrated product for collection, storage, visualization, and alerting.
- Broad Protocol Support: Native, out-of-the-box support for SNMP, JMX, IPMI, and ODBC without needing separate exporters.
- Built-in Escalation Engine: Complex, multi-step alert escalations and acknowledgments are built-in.
- Zabbix Proxies: A robust, built-in solution for monitoring distributed or firewalled locations.
- GUI-Driven Configuration: Many users find it easier to manage hosts, templates, and triggers through a web interface.
Organizations can use both: Zabbix for monitoring the core network and on-prem infrastructure (the "underlay"), and Prometheus for monitoring the applications and Kubernetes clusters running on top (the "overlay").
A Unified Alternative: SigNoz
While Prometheus excels at cloud-native metrics and Zabbix covers traditional infrastructure, many teams find they need both, plus separate tools for logs and traces. This creates a fragmented observability stack that is complex and costly to manage.
SigNoz offers a unified alternative. It is an open-source, all-in-one observability platform that combines metrics, traces, and logs into a single application.
Crucially, SigNoz is built to be 100% OpenTelemetry-native. This means it can ingest OTLP data from any instrumented application without vendor lock-in, acting as a unified backend for all your telemetry.
- All-in-One: A single tool for metrics, distributed traces, and logs.
- OpenTelemetry Native: Built on a future-proof, vendor-neutral standard.
- Powerful APM: Provides distributed tracing to see full request lifecycles across microservices, something neither Zabbix nor Prometheus (by itself) can do.
- Flexible Deployment: Can be self-hosted (like Zabbix/Prometheus) or used as a managed cloud service.
You can choose between various deployment options in SigNoz. The easiest way to get started with SigNoz is SigNoz cloud. We offer a 30-day free trial account with access to all features.
Those who have data privacy concerns and can't send their data outside their infrastructure can sign up for either enterprise self-hosted or BYOC offering.
Those who have the expertise to manage SigNoz themselves or just want to start with a free self-hosted option can use our community edition.
Hope we answered all your questions regarding Zabbix vs Prometheus. If you have more questions, feel free to use the SigNoz AI chatbot, or join our slack community.
You can also subscribe to our newsletter for insights from observability nerds at SigNoz, get open source, OpenTelemetry, and devtool building stories straight to your inbox.
