Apdex stands for Application Performance Index. It is a industry standard way to measuring the end user’s satisfaction based on the response times of the requests made by their applications and services, in comparison to a pre-determined threshold T.
Each request can be put into one of these three categories:
Satisfactory- The requests which were completed within the threshold timeTTolerated- The requests which were completed within time greater thanTbut less than4TFrustrated- The request either took greater than4Ttime to complete or resulted in an error.
An Apdex score is the ratio of the total acceptable requests (Satisfactory + Tolerated) to the total requests made.
Apdex Score = (A + 0.5 * B)/C
where
A = number of satisfactory requests
B = number of tolerated requests
C = total number of requests
Calculating score from metrics
In SigNoz, Apdex can be derived from histogram metrics like http.server.duration.bucket, which tracks request durations. The histogram uses upper-bound filters le to count requests below specific time thresholds.
The le (less than or equal) label represents the upper bound of a latency bucket. Every time a request completes, it's counted into all buckets where its duration is less than or equal to the bucket's upper bound.
For example, if a request takes 250ms to complete, it will be counted in:
le = 300le = 500le = 1000, and so on
This cumulative structure means each le value contains all requests less than or equal to that time.
Creating an Alert for Apdex Score
We can create an alert for evaluating Apdex score using a PromQL Query.
Let’s assume our threshold to be 2000 ms.
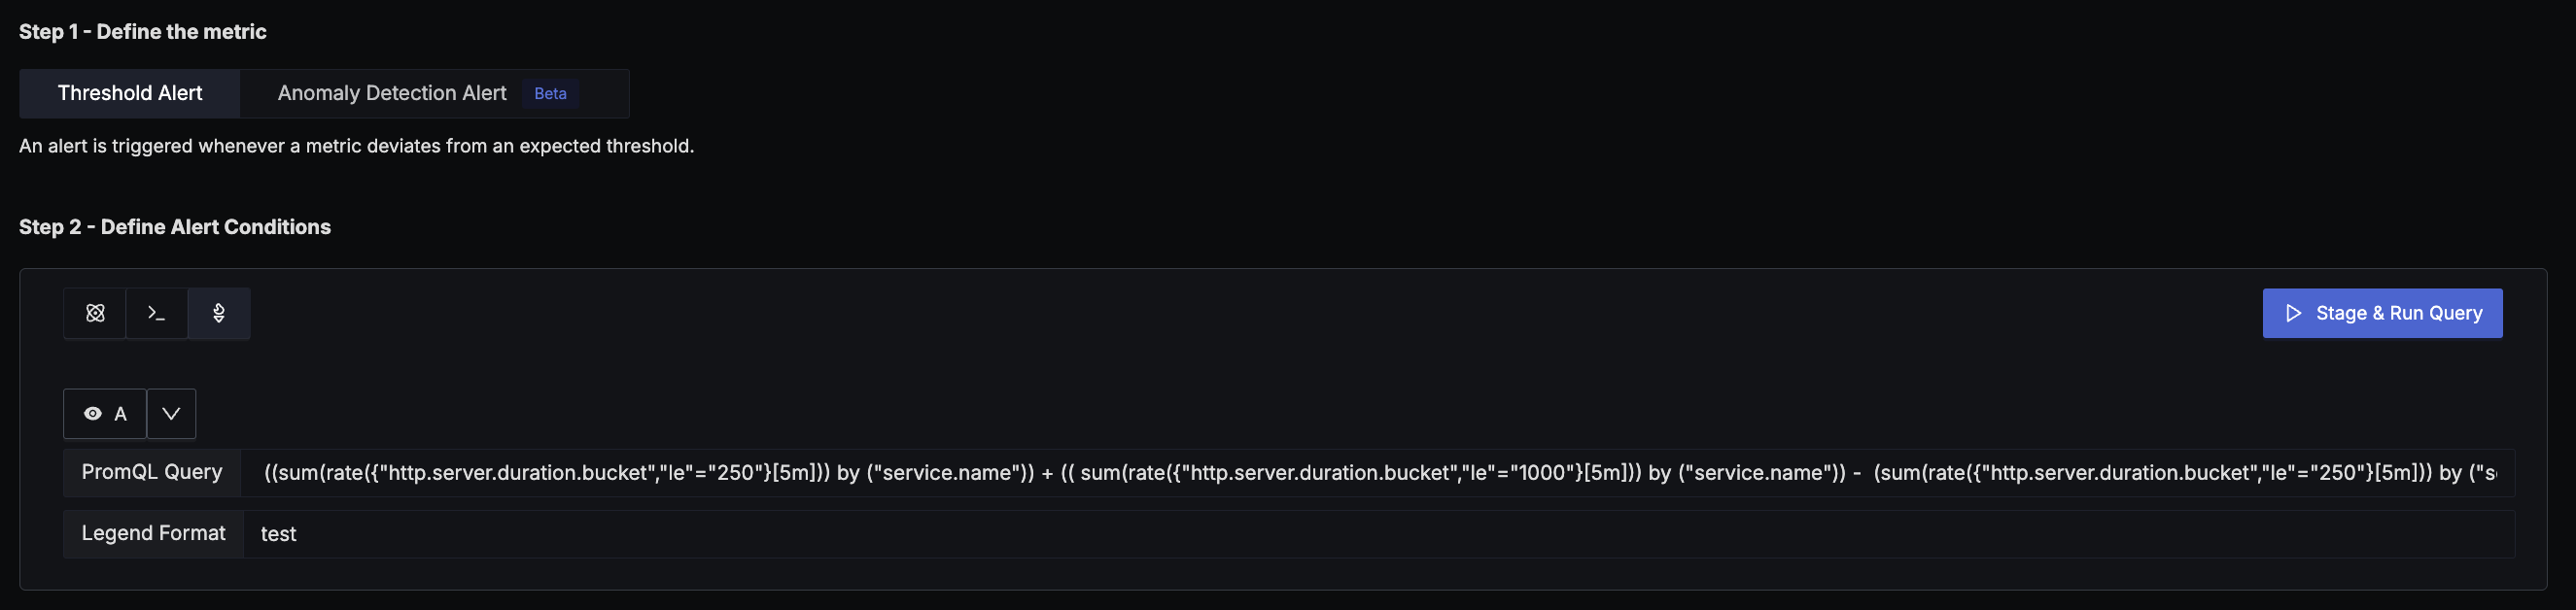
The written PromQL Query for the alert is:
((sum(rate({"http.server.duration.bucket","le"="250"}[5m])) by ("service.name")) + (( sum(rate({"http.server.duration.bucket","le"="1000"}[5m])) by ("service.name")) - (sum(rate({"http.server.duration.bucket","le"="250"}[5m])) by ("service.name")))*0.5) / (sum(rate({"http.server.duration.count"}[5m])) by ("service.name"))
The query can be broken into 3 parts:
Satisfied Requests- Requests that were completed within 250mssum(rate({"http.server.duration.bucket","le"="250"}[5m])) by ("[service.name](http://service.name/)")Tolerating Requet- Requests that were were completed within 250ms to 1000ms.i.e. Requests completed within 1000ms - Requests completed within 250ms
(sum(rate({"http.server.duration.bucket","le"="1000"}[5m])) by ("service.name"))
-
(sum(rate({"http.server.duration.bucket","le"="250"}[5m])) by ("service.name"))
Total Requestssum(rate({"http.server.duration.count"}[5m])) by ("service.name")
So the Apdex score becomes:
Satisfied Requests + (Total Requests * 0.5) / Total Requests
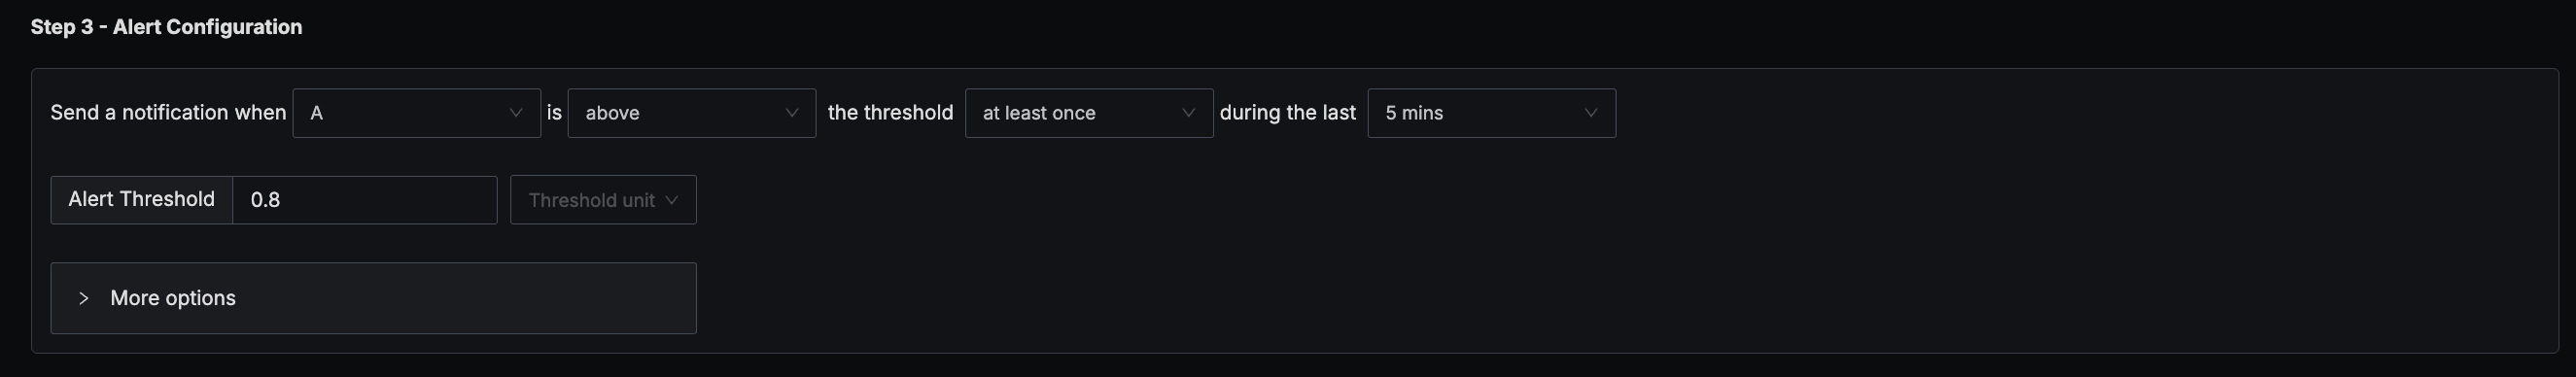
An Apdex score of 0.8 is consider good. So we can configure our alert to trigger whenever the value crossed the threshold of 0.8 during the last 5 minutes.