A Metric-based alert in SigNoz allows you to define conditions based on metric data and trigger alerts when these conditions are met. Here's a breakdown of the various sections and options available when configuring a Metric-based alert:
Step 1: Define the Metric
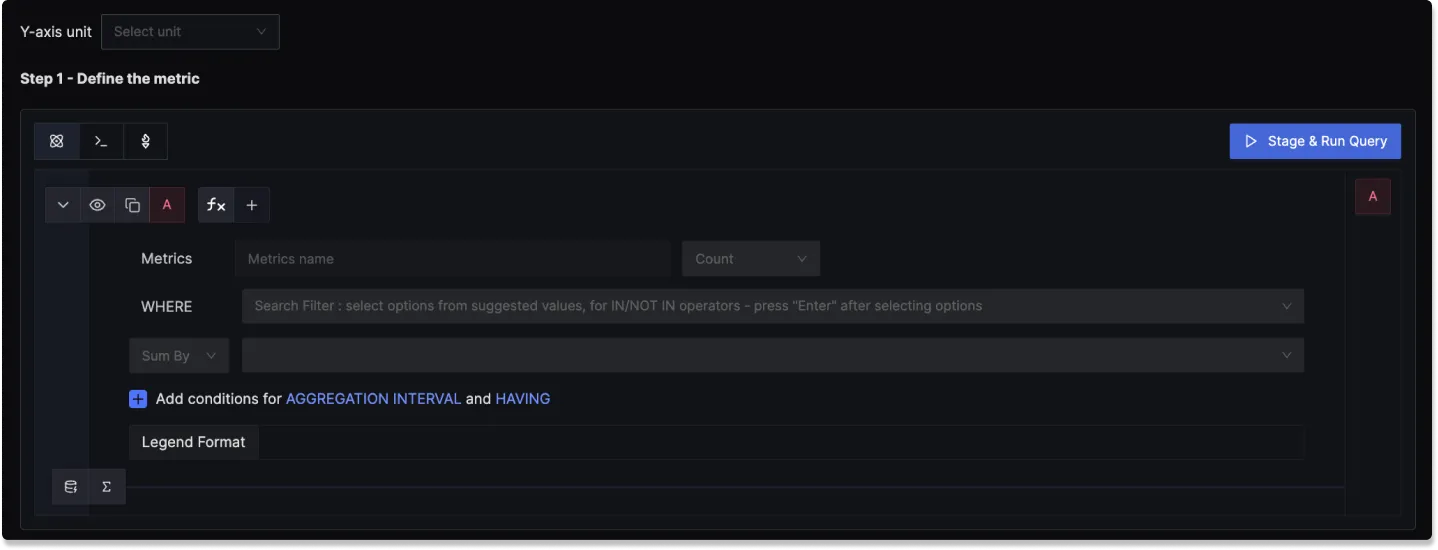
In this step, you use the Metrics Query Builder to choose the metric to monitor. The following fields that are available in Metrics Query Builder includes:
Metric: A field to select the specific metric you want to monitor (e.g., CPU usage, memory utilization).
Time aggregation: A field to select the time aggregation function to use for the metric. Learn more about time aggregation
WHERE: A filter field to define specific conditions for the metric. You can apply logical operators like "IN," "NOT IN".
Space aggregation: A field to select the space aggregation function to use for the metric. Learn more about space aggregation
Legend Format: An optional field to customize the legend's format in the visual representation of the alert.
Having: Apply conditions to filter the results further based on aggregate value.
To know more about the functionalities of the Query Builder, checkout the documentation.
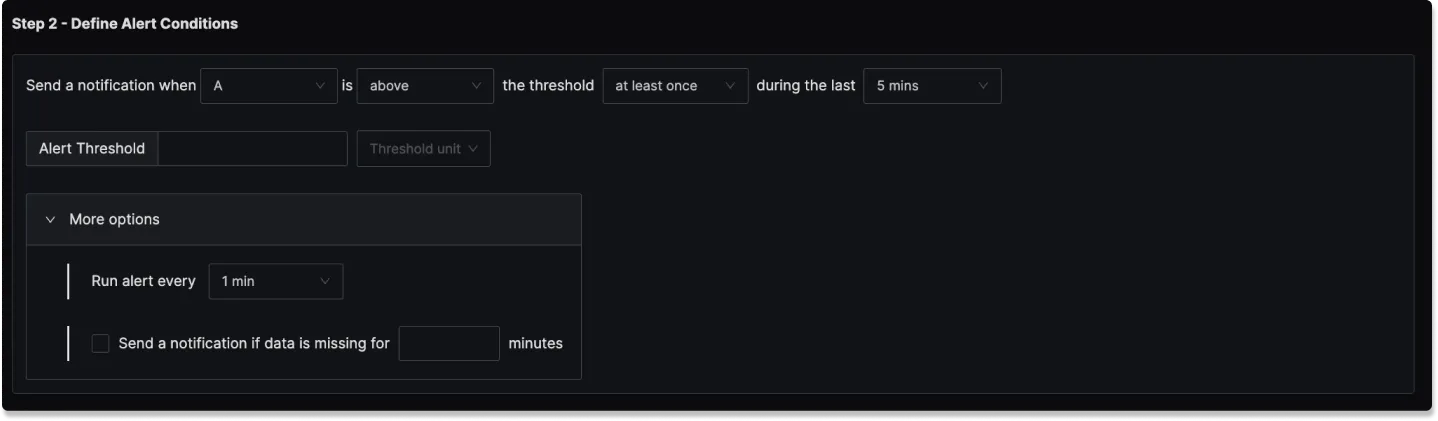
Step 2: Define Alert Conditions
In this step, you define the specific conditions for triggering the alert, as well as the frequency of checking those conditions. The condition configuration of an alert in SigNoz consists of 5 core parts:
Query
An alert can consist of multiple queries and formulas. But only 1 of them can be put into consideration while determining the alert condition.
You can define one or more queries or formulas to fetch the data you want to evaluate. However, only one of them can be used as the trigger for the alert condition.
For example:
A= Total request countB= Total error countC=B / A(Error rate)
You can use query C as the evaluation target to trigger alerts based on error rate.
Condition
This defines the logical condition to check against the selected query’s value.
| Operator | Description | Example Usage |
|---|---|---|
Above | Triggers if the value is greater than | CPU usage Above 90 (%) |
Below | Triggers if the value is less than | Apdex score Below 0.8 |
Equal to | Triggers if the value is exactly equal | Request count Equal to 0 |
Not equal to | Triggers if the value is not equal | Instance status Not Equal to 1 |
Match Type
Specifies how the condition must hold over the evaluation window. This allows for flexible evaluation logic.
| Match Type | Description | Example Use Case |
|---|---|---|
at least once | Trigger if condition matches even once in the window | Detect spikes or brief failures |
all the times | Trigger only if condition matches at all points in the window | Ensure stable violations before alerting |
on average | Evaluate the average value in the window | Average latency Above 500ms |
in total | Evaluate the total sum over the window | Total errors Above 100 |
last | Only the last data point is evaluated | Used when only latest status matters |
Evaluation Window (For)
Specifies how long the condition must be true before the alert is triggered.
e.g. For 5 minutes = The condition must remain true continuously for 5 minutes before the alert is triggered.
This helps reduce false positives due to short-lived spikes.
Threshold
This is the value you are comparing the query result against.
e.g. If you choose Condition = Above and set Threshold = 500, the alert will fire when the query result exceeds 500.
Threshold Unit
Specifies the unit of the threshold, such as:
- ms (milliseconds) for latency
- % for CPU usage
- Count for request totals
Helps interpret the threshold in the correct context and also for correct scaling while comparing 2 values.
Advanced Options
In addition, there are 3 more advanced options:
Alert Frequency
- How frequently SigNoz evaluates the alert condition.
- Default is
1 min - e.g. If set to
1 minthe alert will run once every minute.
Notification for missing data points
- Triggers an alert if no data is received for the configured time period.
- Useful for services where consistent data is expected.
- E.g. If set to
5 minutes, and no metric data is received during that period, the alert will fire.
Minimum Data Points in Result Group
- Ensures the alert condition is evaluated only when there's enough data for statistical significance.
- Helps avoid false alerts due to missing or sparse data points.
- E.g. If set to
3, the query must return at least 3 data points in the evaluation window for the alert to be considered.
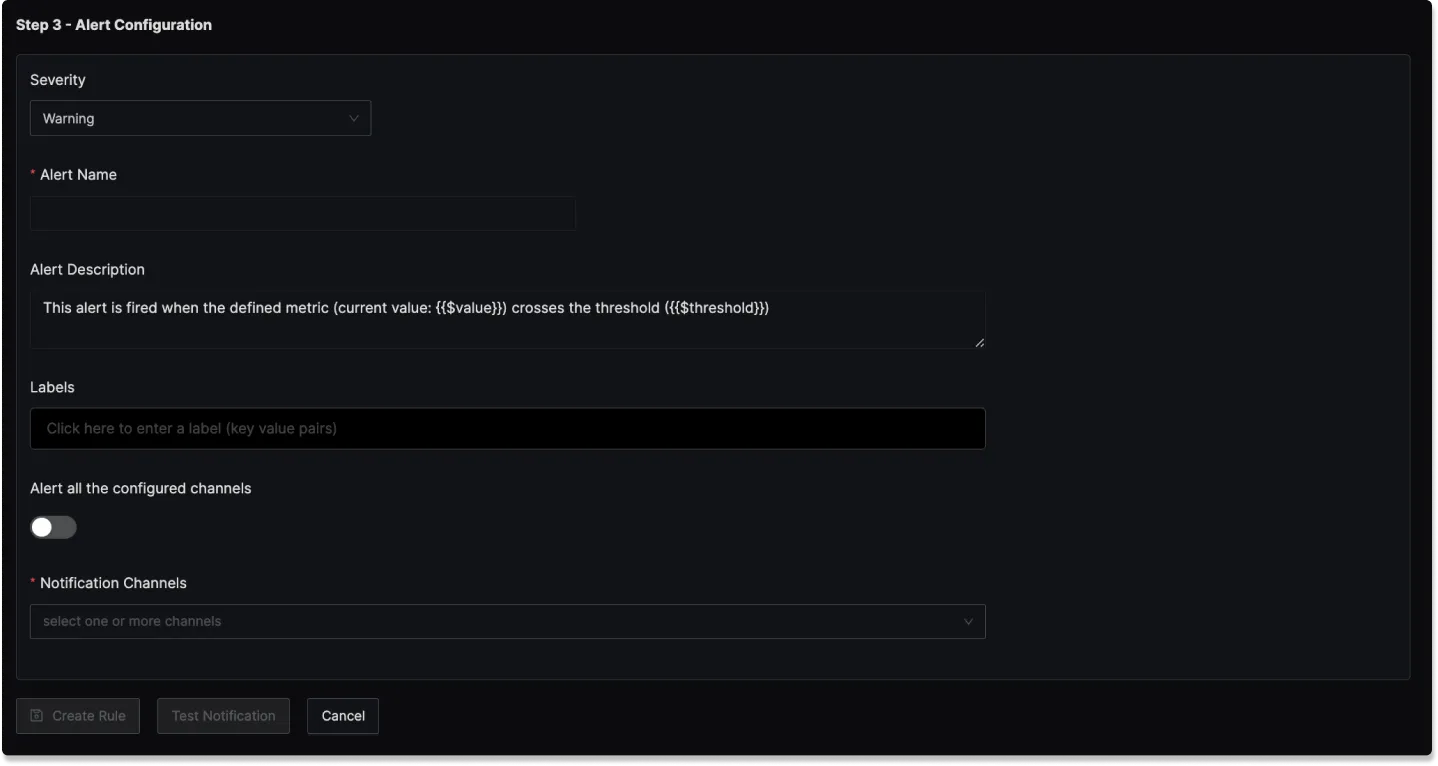
Step 3: Alert Configuration
In this step, you set the alert's metadata, including severity, name, and description:
Severity
Set the severity level for the alert (e.g., "Warning" or "Critical").
Alert Name
A field to name the alert for easy identification.
Alert Description
Add a detailed description for the alert, explaining its purpose and trigger conditions.
You can incorporate result attributes in the alert descriptions to make the alerts more informative:
Syntax: Use $<attribute-name> to insert attribute values. Attribute values can be any attribute used in group by.
Example: If you have a query that has the attribute service.name in the group by clause then to use it in the alert description, you will use $service.name.
Slack alert format
Using advanced slack formatting is supported if you are using Slack as a notification channel.
Labels
A field to add static labels or tags for categorization. Labels should be added in key value pairs. First enter key (avoid space in key) and set value.
Notification channels
A field to choose the notification channels from those configured in the Alert Channel settings.
Test Notification
A button to test the alert to ensure that it works as expected.
Examples
1. Alert when memory usage for host goes above 400 MB (or any fixed memory)
Here's a video tutorial for creating this alert:
Step 1: Write Query Builder query to define alert metric
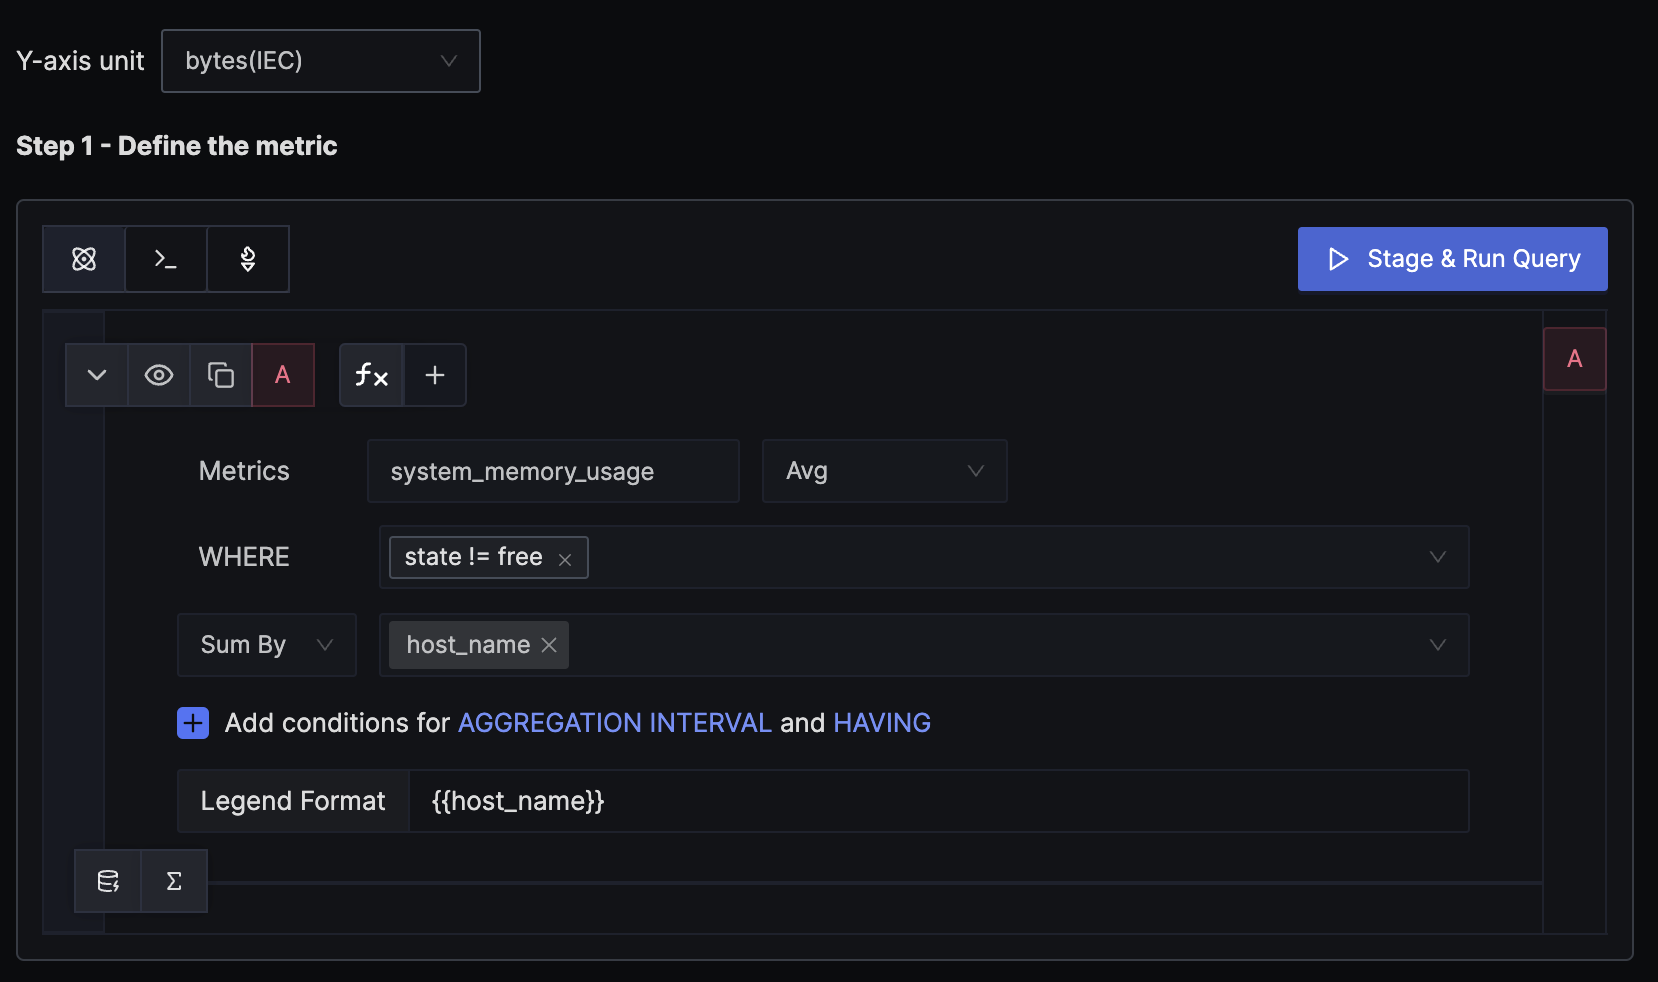
The hostmetricsreceiver creates several host system metrics, including system_memory_usage, which contains the memory usage for each state from /proc/meminfo. The states can be free, used, cached, etc. We want to alert when the total memory usage of a host exceeds the threshold, so the WHERE clause excludes the free state. We calculate the average value for each state and then sum them up by host to get the per-host memory usage.
Remember to set the unit of the y-axis to bytes, as that is the unit of the mentioned metric.
Step 2: Set alert conditions
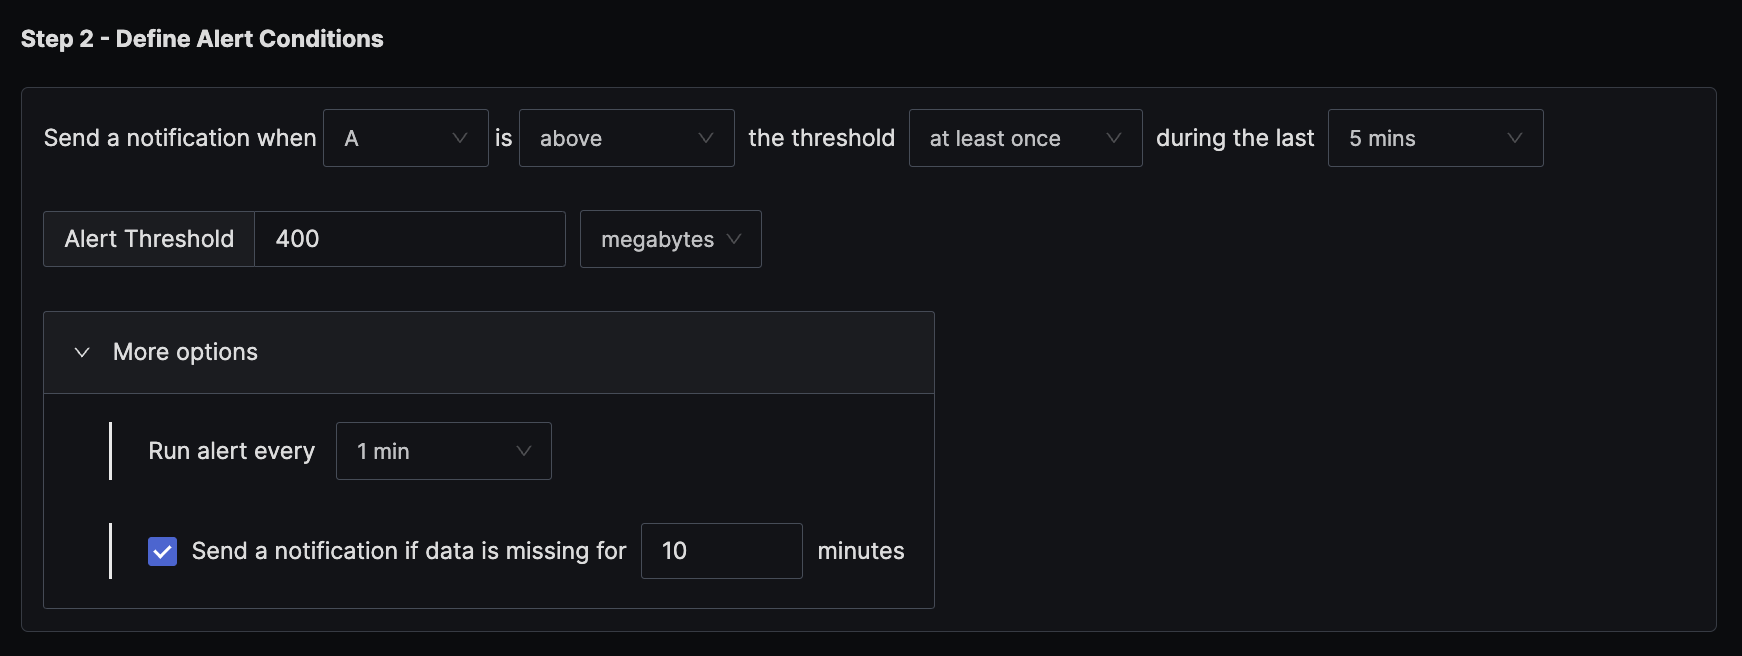
The condition is set to trigger a notification if the per-minute memory usage exceeds the threshold of 400 MB at least once in the last five minutes.
2. Alert when memory usage for host goes above 70%
You might want to alert based on the percentage rather than a fixed threshold. There are two ways to get the percentage: the convenient option is when the usage percentage is reported directly by the source, or when the source only sends the exact usage in bytes and you need to derive the percentage yourself. This example demonstrates how to derive the percentage from the original bytes metric.
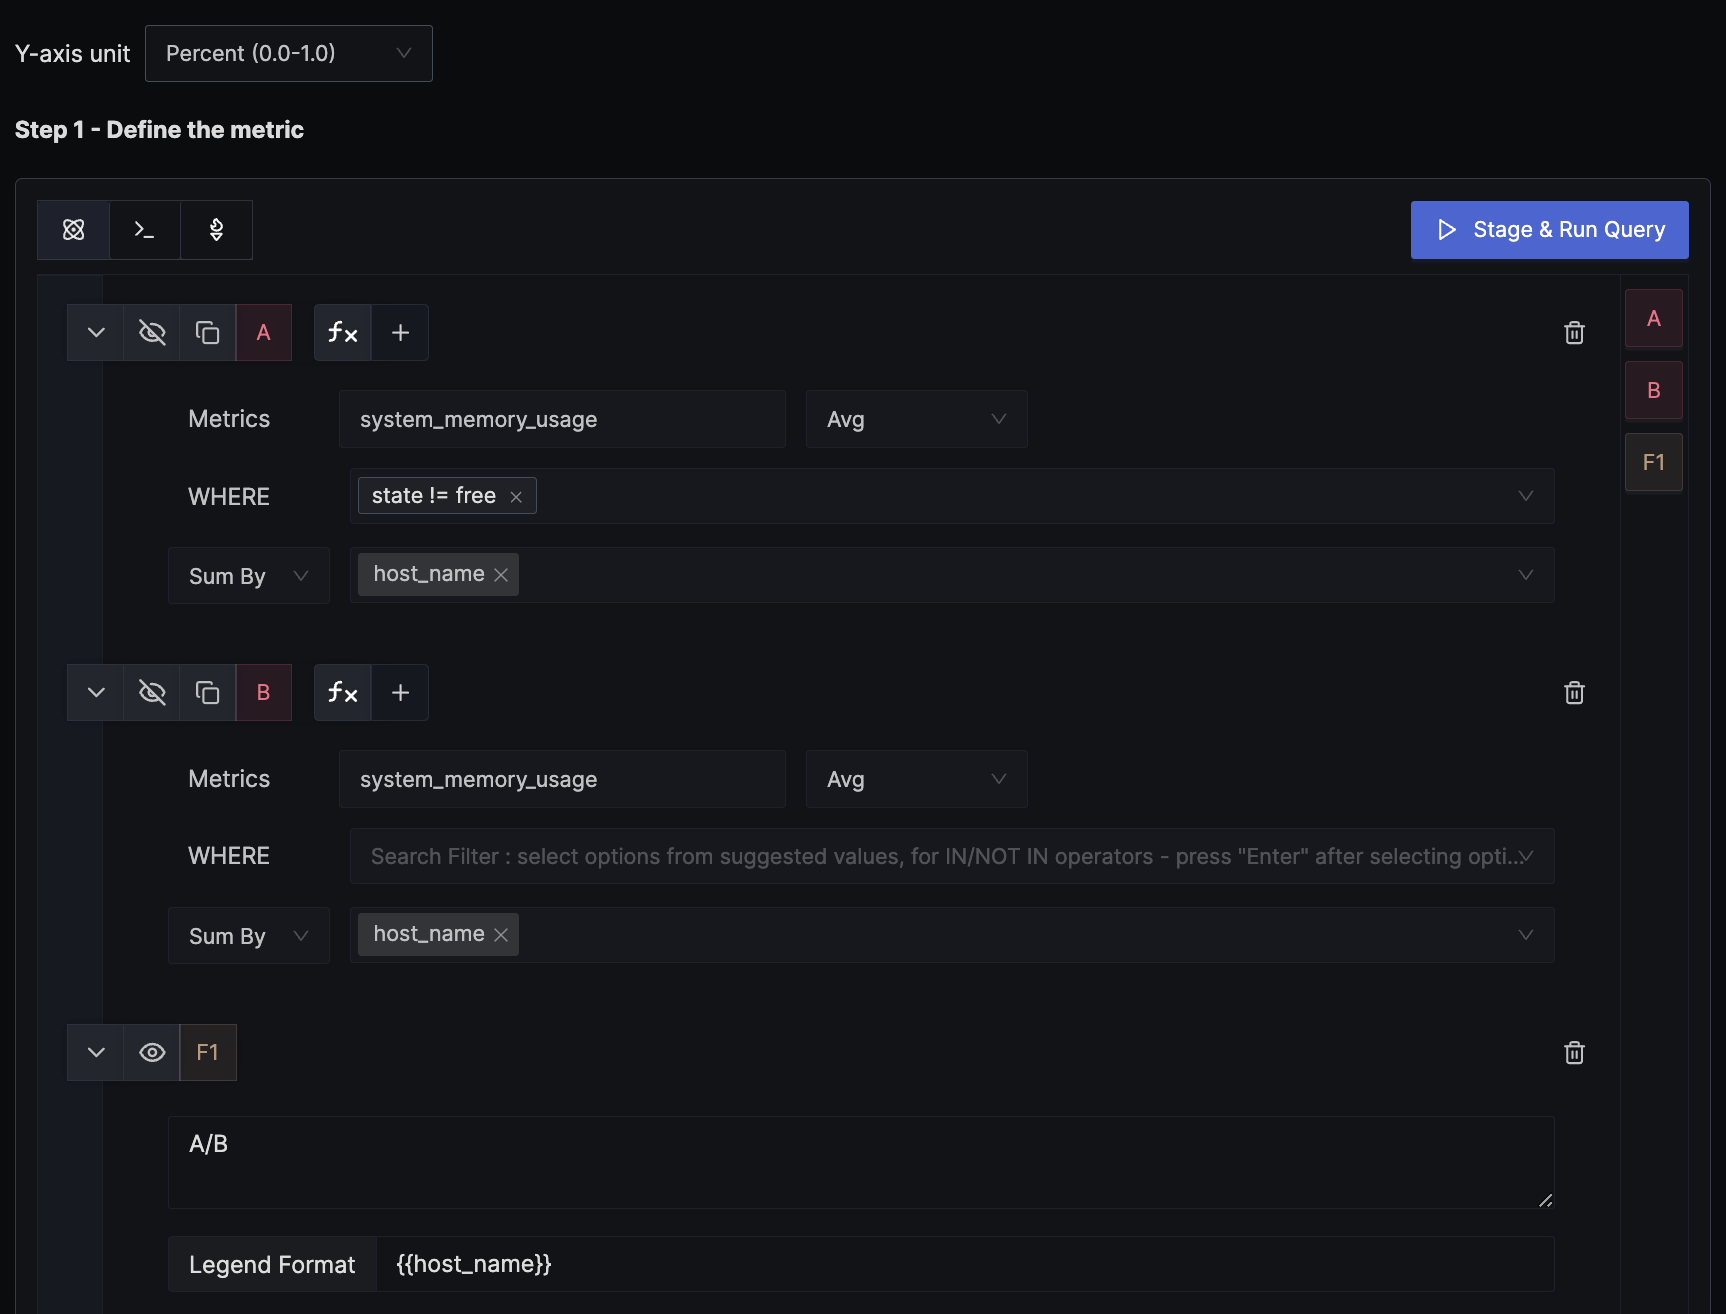
We use a formula to derive the percentage value from the exact memory usage in bytes. In the example, query A calculates the per-host memory usage, while query B, as shown in the image, doesn't have any WHERE clause filter, thus providing the total memory available. The formula for A/B is interpreted as (memory usage in bytes) / (total memory available in bytes). We set the unit of the y-axis to Percent (0.0 - 1.0) to match the result of the formula.
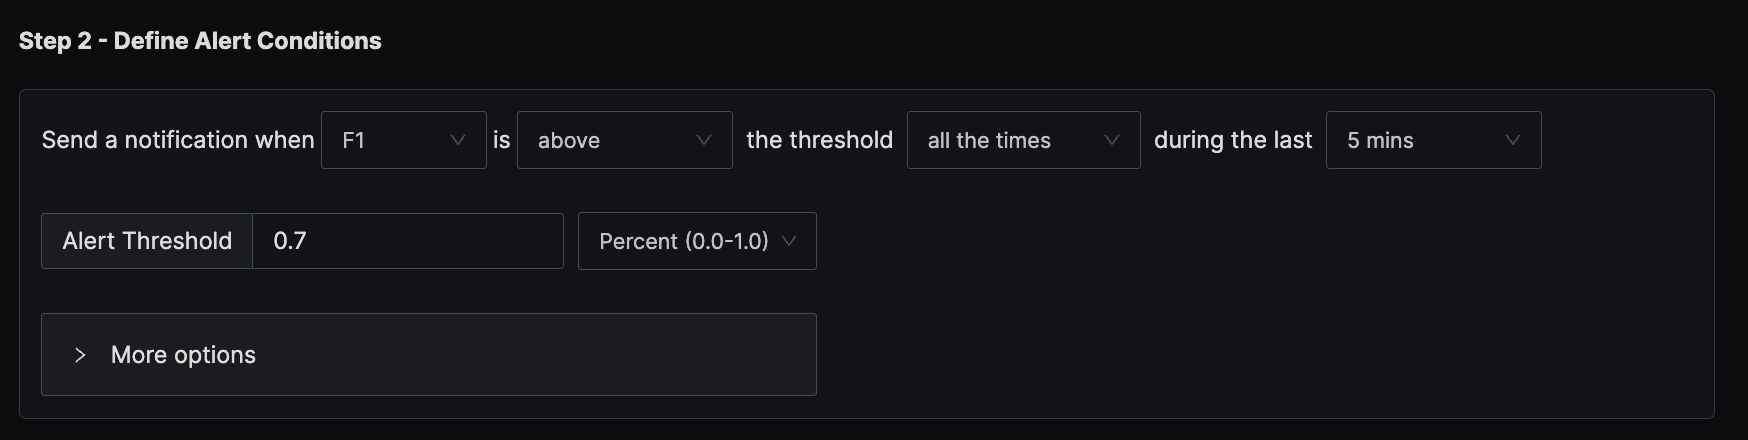
The condition is set to trigger a notification if the per-minute memory usage exceeds the threshold of 70% all the times in the last five minutes.
3. Alert when the error percentage for an endpoint exceeds 5%
SigNoz creates a metric signoz_calls_total from the trace data. The default attributes of the metric are service_name, operation, span_kind, status_code, and http_status_code. There is no separate metric for counting errors; instead, the status_code attribute is used to determine if a request counts as an error. This example demonstrates how to calculate the error percentage and alert on it.
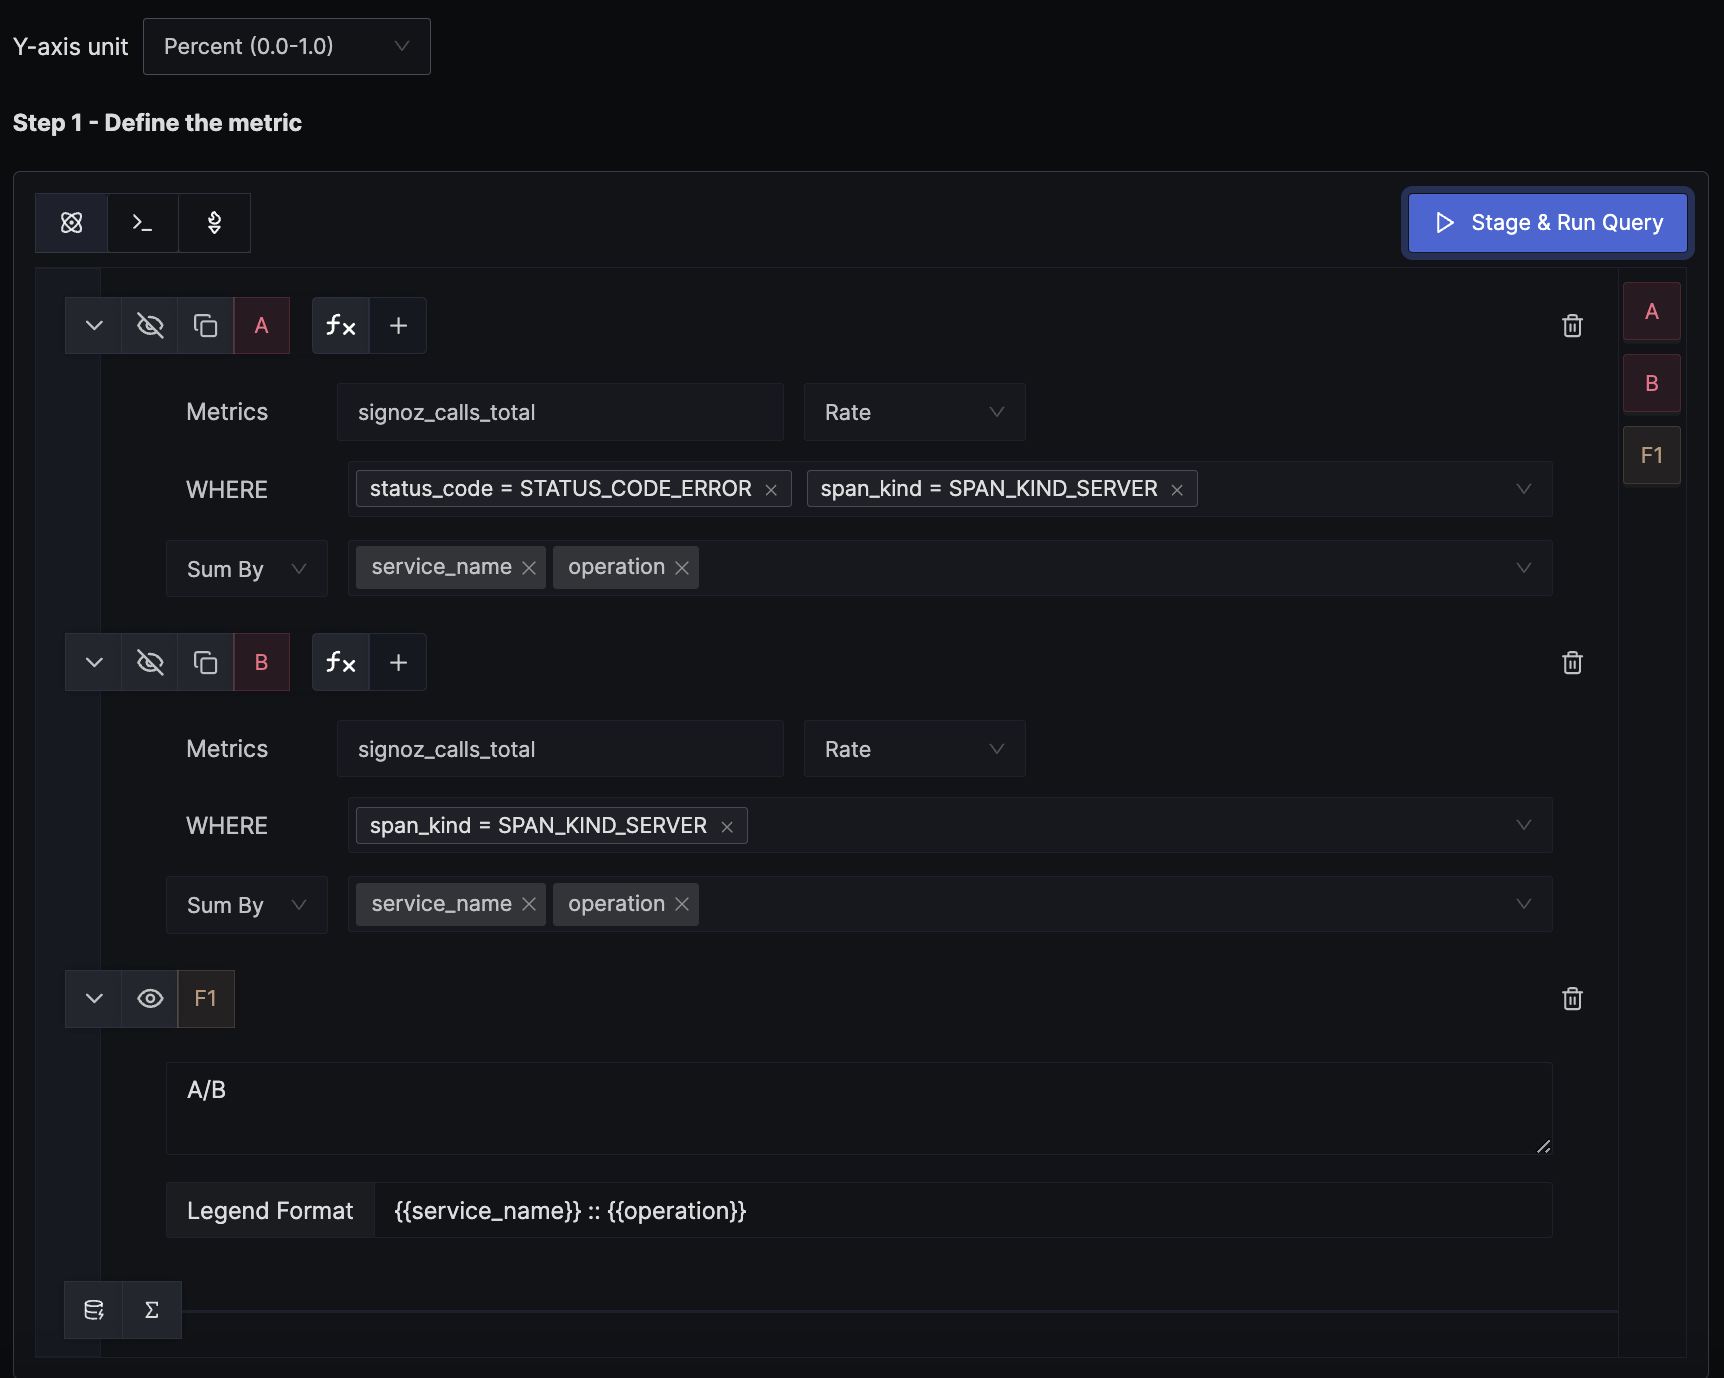
We use a formula to derive the error percentage from the total calls metric. In the example, query A calculates the per-endpoint error rate, while query B, as shown in the image, doesn't have any WHERE clause filter for status_code, thus providing the per-endpoint total request rate. The formula for A/B is interpreted as (error request rate) / (total request rate), which gives the error percentage per endpoint. We set the unit of the y-axis to Percent (0.0 - 1.0) to match the result of the formula.
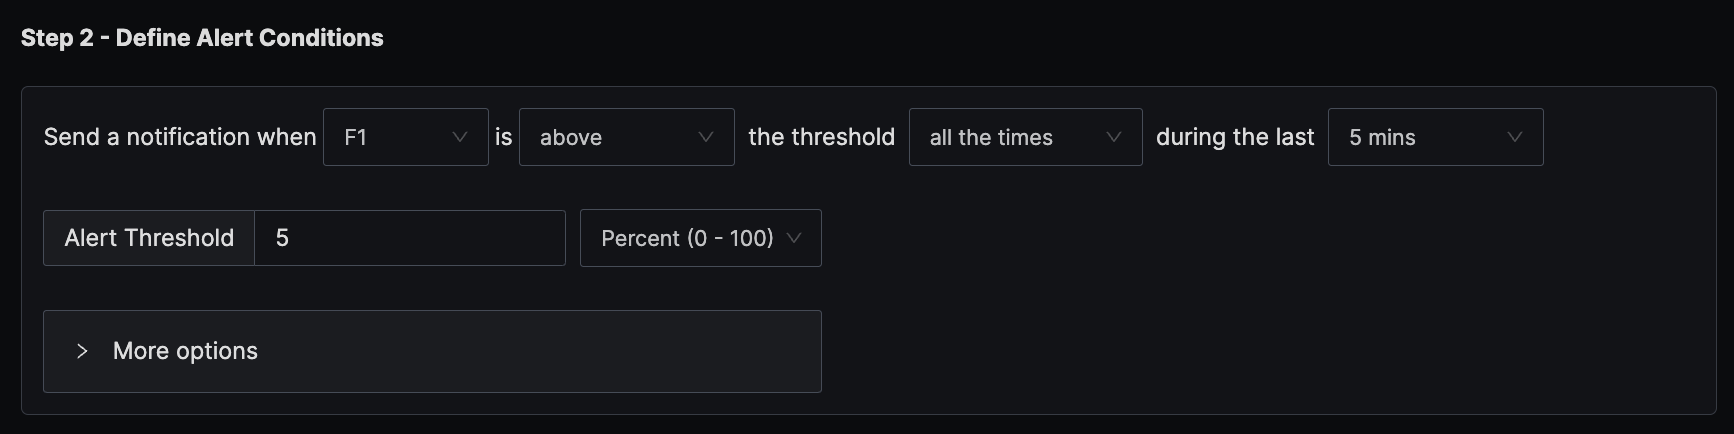
The condition is set to trigger a notification if the per-minute error percentage exceeds the threshold of 5% all the times in the last five minutes.
4. Alert when P95 latency for an endpoint is above 1200 ms
SigNoz creates a metric signoz_latency_bucket from the trace data. The default attributes of the metric are service_name, operation, span_kind, status_code, and http_status_code. This example demonstrates how to calculate the P95 latency for an endpoint and alert on it.
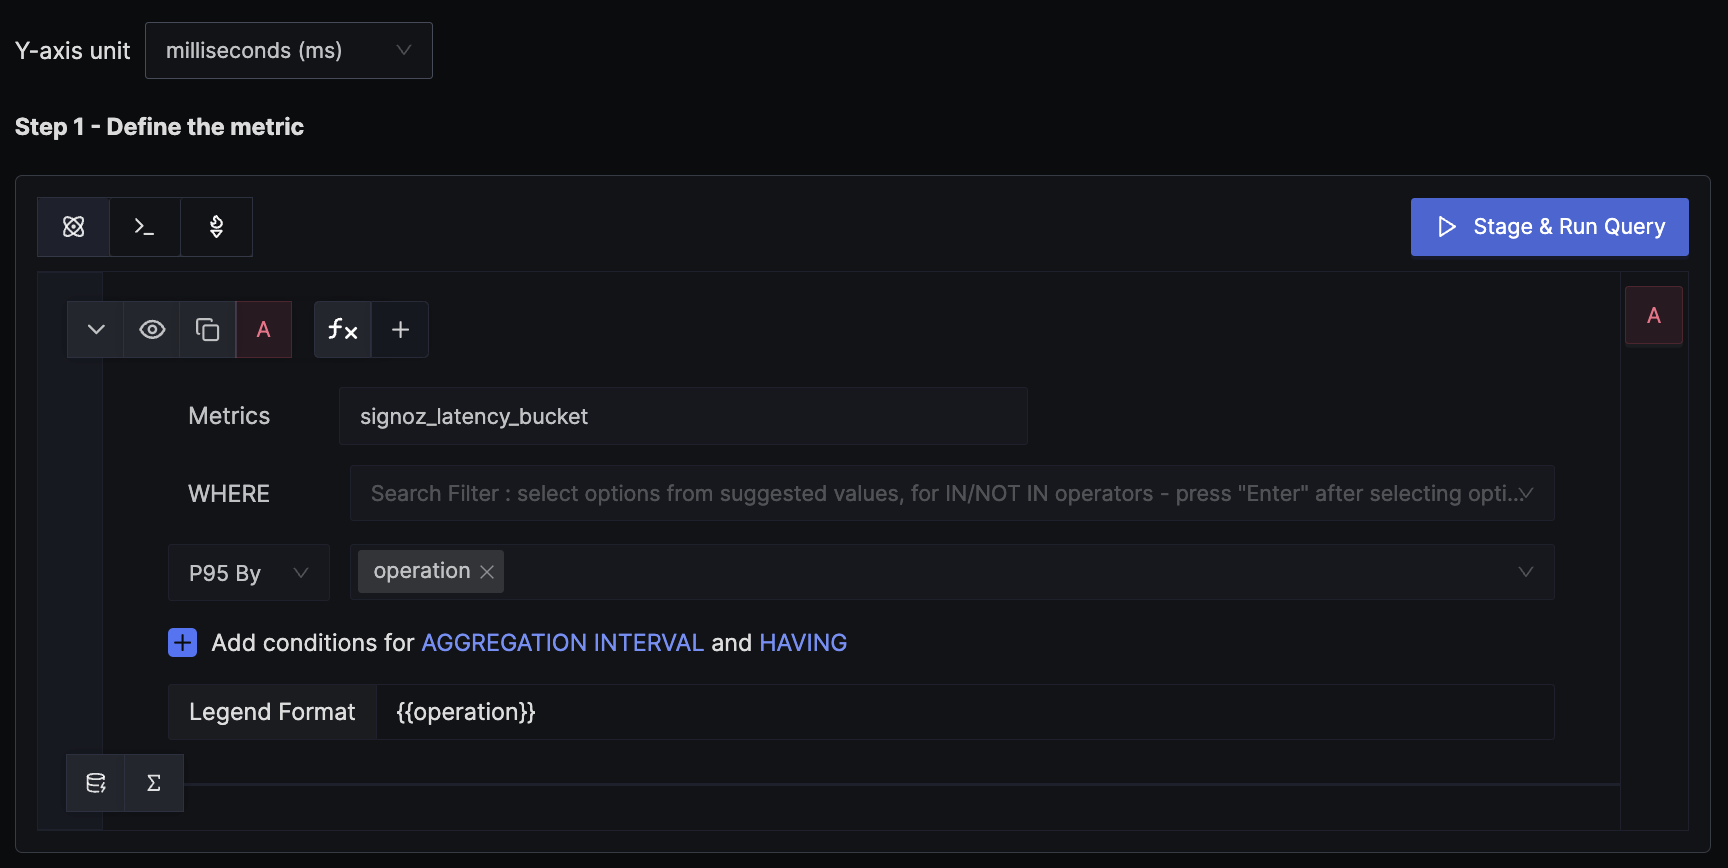
We use the P95 aggregation, which gives the 95th-percentile request latency per endpoint. We set the unit of the y-axis to milliseconds to match the unit of the metric.
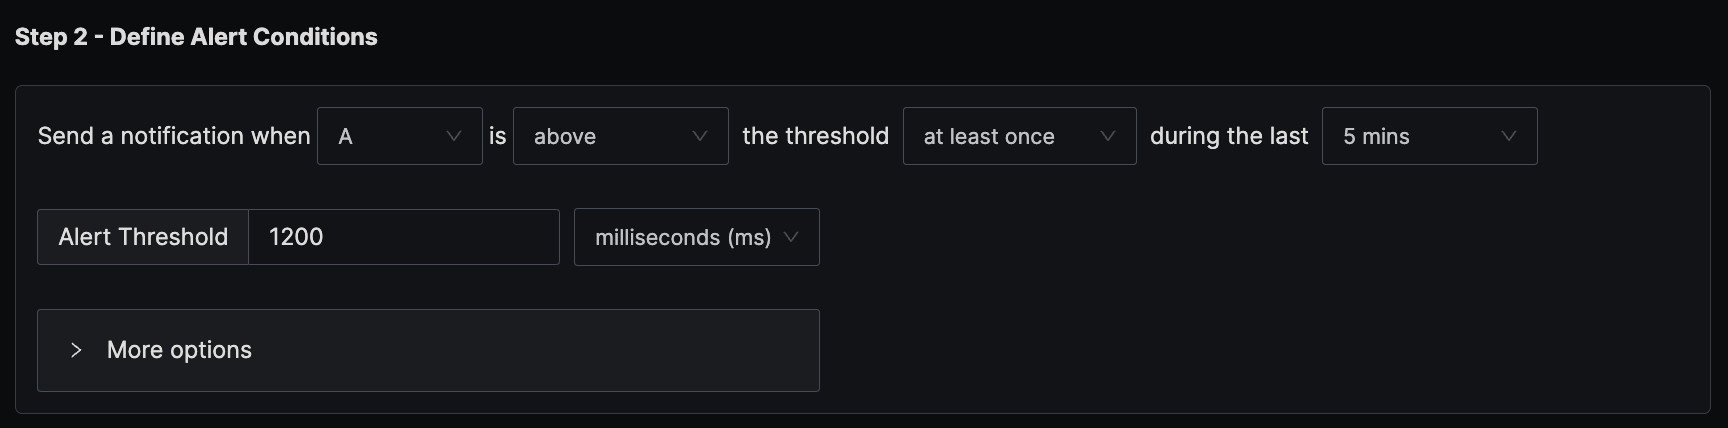
The condition is set to trigger a notification if the per-minute P95 latency exceeds the threshold of 1200 ms at any time in the last five minutes.
