Overview
This documentation provides a detailed walkthrough on how to set up an AWS Lambda function to collect AWS Lambda traces using OpenTelemetry auto-instrumentation. This will enable you to automatically sends your Lambda traces to SigNoz, enabling you to trace the activities of your Lambda function.
Prerequisites
- AWS account with full access to AWS Lambda.
AWS Lambda Auto-Instrumentation for Tracing
Creating a Lambda Function
Firstly, create a Lambda function in the language of your choice.
Navigate to AWS Lambda service on the AWS console, and click on the Create Function button present on the top right corner of the page.
In the Create function page, select Author from scratch.
In the Basic information section, provide an appropriate Function name, and Runtime based on the language in which you want to write your function.
Select the Architecture as per your requirement.
Click on Create function to create the function.
Next, we will create the Lambda function. The function will make a REST API call to the URL: https://api.restful-api.dev/objects?id=3&id=5, print the response and return the same. The URL will get the object details of the objects with ID 3 and 5.
On your machine, create a folder, say auto-instrument-tracing-lambda.
Add a file lambda_function.py in that folder with the lambda function code which will be as follows:
import json
import requests

def lambda_handler(event, context):
    res = requests.get('https://api.restful-api.dev/objects?id=3&id=5')
    print(res.json())
    return {
        'statusCode': 200,
        'body': res.json()
    }
Inside the folder, create a new directory named package into which you will install your dependencies.
$ mkdir package
Install the dependencies in the package directory using the command:
$ pip install --target ./package requests
Create a .zip file with the installed libraries at the root.
$ cd package
$ zip -r ../auto-instrument-tracing-lambda.zip .
This generates a auto-instrument-tracing-lambda.zip file in your project directory.
Add the lambda_function.py file to the root of the .zip file using the following command:
$ cd ..
$ zip auto-instrument-tracing-lambda.zip lambda_function.py
In the Code tab on the Lambda function page, click on Upload from button and choose .zip from the dropdown. Upload the auto-instrument-tracing-lambda.zip file. Now, you can test the lambda function.
On your machine, create a folder say auto-instrument-tracing-lambda. In the folder, create a file index.js and put the following code in it.
const https = import('https');

export const handler = (event) => {
    const url = 'https://api.restful-api.dev/objects?id=3&id=5';  // URL to be fetched

    try {
        const response = https.get(url, (res) => {
            let data = '';

            res.on('data', (chunk) => {
                data += chunk;
            });

            res.on('end', () => {
                return {
                    statusCode: 200,
                    body: data
                };
            });
        });

        response.on('error', (err) => {
            return {
                statusCode: 500,
                body: JSON.stringify({ error: err.message })
            };
        });
    } catch (err) {
        return {
            statusCode: 500,
            body: JSON.stringify({ error: err.message })
        };
    }
};
Install the npm package https using the command:
npm install https
Zip the nodejs package using the command:
zip -r auto-instrument-tracing-lambda.zip .
In the Code tab on the Lambda function page, click on Upload from button and choose .zip from the dropdown. Upload the auto-instrument-tracing-lambda.zip file. Now, you can test the lambda function.
On your machine, create a Maven package in Java, say AutoInstrumentationLambda. The pom.xml file would look like as follows:
<?xml version="1.0" encoding="UTF-8"?>
<project xmlns="http://maven.apache.org/POM/4.0.0"
         xmlns:xsi="http://www.w3.org/2001/XMLSchema-instance"
         xsi:schemaLocation="http://maven.apache.org/POM/4.0.0 http://maven.apache.org/xsd/maven-4.0.0.xsd">
    <modelVersion>4.0.0</modelVersion>

    <groupId>org.example</groupId>
    <artifactId>AutoInstrumentationLambda</artifactId>
    <version>1.0-SNAPSHOT</version>

    <properties>
        <maven.compiler.source>21</maven.compiler.source>
        <maven.compiler.target>21</maven.compiler.target>
        <project.build.sourceEncoding>UTF-8</project.build.sourceEncoding>
    </properties>

    <dependencies>
        <dependency>
            <groupId>com.amazonaws</groupId>
            <artifactId>aws-lambda-java-core</artifactId>
            <version>1.2.2</version>
        </dependency>
        <dependency>
            <groupId>com.amazonaws</groupId>
            <artifactId>aws-lambda-java-events</artifactId>
            <version>3.11.1</version>
        </dependency>
        <dependency>
            <groupId>com.amazonaws</groupId>
            <artifactId>aws-lambda-java-log4j2</artifactId>
            <version>1.5.1</version>
        </dependency>
    </dependencies>
    <build>
        <plugins>
            <plugin>
                <groupId>org.apache.maven.plugins</groupId>
                <artifactId>maven-shade-plugin</artifactId>
                <version>3.2.2</version>
                <configuration>
                    <createDependencyReducedPom>false</createDependencyReducedPom>
                </configuration>
                <executions>
                    <execution>
                        <phase>package</phase>
                        <goals>
                            <goal>shade</goal>
                        </goals>
                    </execution>
                </executions>
            </plugin>
        </plugins>
    </build>

</project>
Note that we have used Java 21 in this package.
Create the Main.java file in the location src/main/java/org/example/ inside the package. The Main.java will have the handleRequest method that will run on invoking the AWS Lambda function. Here are the contents of the Main.java file:
package org.example;

import java.io.BufferedReader;
import java.io.InputStreamReader;
import java.net.HttpURLConnection;
import java.net.URL;

import com.amazonaws.services.lambda.runtime.Context;
import com.amazonaws.services.lambda.runtime.RequestHandler;

public class Main implements RequestHandler<Object, String> {

    @Override
    public String handleRequest(Object event, Context context) {
        try {
            String urlString = "https://api.restful-api.dev/objects?id=3&id=5";
            URL url = new URL(urlString);
            HttpURLConnection connection = (HttpURLConnection) url.openConnection();
            connection.setRequestMethod("GET");

            int responseCode = connection.getResponseCode();
            System.out.println(responseCode);

            BufferedReader br = new BufferedReader(new InputStreamReader(connection.getInputStream()));
            StringBuilder sb = new StringBuilder();
            String line;
            while ((line = br.readLine()) != null) {
                sb.append(line+"\n");
            }
            br.close();
            return sb.toString();
        } catch(Exception e) {
            System.out.println("Exception: " + e.getMessage());
        }
        return null;
    }
}
Now, run the following commands from the terminal from the base folder which contains the pom.xml file:
# This will build the maven package
$ mvn clean install

# This will generate the .jar file in the `target` folder
$ mvn package
Upload the .jar file in the AWS console on the corresponding function's page.
Also, edit the Runtime Settings to edit the Handler to be org.example.Main::handleRequest.
On your machine, create a folder for the project say, auto-instrumentation-tracing, and run the command:
$ bundle init
Open the Gemfile file in the auto-instrumentation-tracing/bundle directory, and add the gems for net/http and uri in it. The contents of the Gemfile will look as follows:
source "https://rubygems.org"
gem "net/http"
gem "uri"
Run the following command to install the gems specified in your Gemfile.
$ bundle config set --local path 'auto-instrumentation-tracing/bundle' && bundle install
Create the lambda_function.rb file that will contain the code for the function:
require 'net/http'
require 'uri'
require 'json'

def handler(event)
  url = URI.parse('https://api.restful-api.dev/objects?id=3&id=5')  # URL to be fetched

  begin
    response = Net::HTTP.get_response(url)

    {
      statusCode: response.code.to_i,
      body: response.body
    }
  rescue => e
    {
      statusCode: 500,
      body: { error: e.message }.to_json
    }
  end
end

# Example invocation for local testing
puts handler({})
Zip the contents of the folder with the following command:
$ zip -r auto-instrumentation-tracing.zip lambda_function.rb auto-instrumentation-tracing
In the Code tab on the Lambda function page, click on Upload from button and choose .zip from the dropdown. Upload the auto-instrument-tracing-lambda.zip file. Now, you can test the lambda function.
Adding Language-specific Auto-instrumentation Layer
The language-specific auto-instrumentation lambda layers automatically instrument your Lambda function code with OpenTelemetry auto-instrumentation package for your specific language. Each language and region has its own layer ARN.
If your Lambda is already instrumented with an OpenTelemetry SDK, you can skip this step.
In order to auto-instrument your Lambda function, follow the steps:
- Go to the Lambda function you want to auto-instrument.
- In the Layers section, click on Add a layer.
- In the Choose a layer section, select Specify an ARN option.
- Choose the correct ARN based on the language, ensure you replace the
<region>with your region (ex.us-east-1):
arn:aws:lambda:<region>:184161586896:layer:opentelemetry-python-0_11_0:1
arn:aws:lambda:<region>:184161586896:layer:opentelemetry-nodejs-0_11_0:1
arn:aws:lambda:<region>:184161586896:layer:opentelemetry-javaagent-0_10_0:1
arn:aws:lambda:<region>:184161586896:layer:opentelemetry-ruby-0_4_0:1
The latest releases of the layers can be found in the OpenTelemetry Lambda Layers GitHub repository.
Navigate to the Configuration tab within your function, and select Environment variables from the left navigation menu.
Add the following environment variables.
OTEL_EXPORTER_OTLP_ENDPOINT=http://localhost:4318
AWS_LAMBDA_EXEC_WRAPPER=/opt/otel-instrument
OTEL_PROPAGATORS=tracecontext
OTEL_TRACES_SAMPLER=always_on
OTEL_EXPORTER_OTLP_ENDPOINT=http://localhost:4318
AWS_LAMBDA_EXEC_WRAPPER=/opt/otel-handler
OTEL_PROPAGATORS=tracecontext
OTEL_TRACES_SAMPLER=always_on
OTEL_EXPORTER_OTLP_ENDPOINT=http://localhost:4318
AWS_LAMBDA_EXEC_WRAPPER=/opt/otel-handler
OTEL_PROPAGATORS=tracecontext
OTEL_TRACES_SAMPLER=always_on
OTEL_EXPORTER_OTLP_ENDPOINT=http://localhost:4318
AWS_LAMBDA_EXEC_WRAPPER=/opt/otel-handler
OTEL_PROPAGATORS=tracecontext
OTEL_TRACES_SAMPLER=always_on
Adding OpenTelemetry Collector Lambda Layer
The collector Lambda layer allows you to forward traces from your Lambda function to SigNoz without impacting response times due to exporter latency.
In order to install the OpenTelemetry Collector Lambda layer, follow these steps:
- Go to the Lambda function.
- In the Layers section, click on Add a layer.
- In the Choose a layer section, select Specify an ARN option.
- Choose the correct ARN based on your function architecture, ensure you replace the
<region>with your region (ex.us-east-1):
arn:aws:lambda:<region>:184161586896:layer:opentelemetry-collector-amd64-0_12_0:1
arn:aws:lambda:<region>:184161586896:layer:opentelemetry-collector-arm64-0_12_0:1
- Add the followwing
collector.yamlfile to your project to configure the collector to send the traces to SigNoz:
# collector.yaml
receivers:
  otlp:
    protocols:
      grpc:
        endpoint: 'localhost:4317'
      http:
        endpoint: 'localhost:4318'

processors:
  batch: {}
  resource/env:
        attributes:
        - key: deployment.environment
          value: prod # can be dev, prod, staging etc. based on your environment
          action: upsert

exporters:
  otlp:
    endpoint: "ingest.{region}.signoz.cloud:443"
    tls:
      insecure: false
    headers:
      "signoz-ingestion-key": "<your-ingestion-key>"

service:
  pipelines:
    traces:
      receivers: [otlp]
      processors: [batch, resource/env]
      exporters: [otlp]
Depending on the choice of your region for SigNoz cloud, the otlp endpoint will vary according to this table.
| Region | Endpoint |
|---|---|
| US | ingest.us.signoz.cloud:443 |
| IN | ingest.in.signoz.cloud:443 |
| EU | ingest.eu.signoz.cloud:443 |
Navigate to the Configuration tab within your function, and select Environment variables from the left navigation menu.
Add the following environment variable:
OPENTELEMETRY_COLLECTOR_CONFIG_URI=/var/task/collector.yaml
Visualize the traces in SigNoz
Go to the SigNoz Cloud URL and head over to the Traces from the left navigation menu.
You should be able to see the trace details appearing on the List View and the Traces tab.
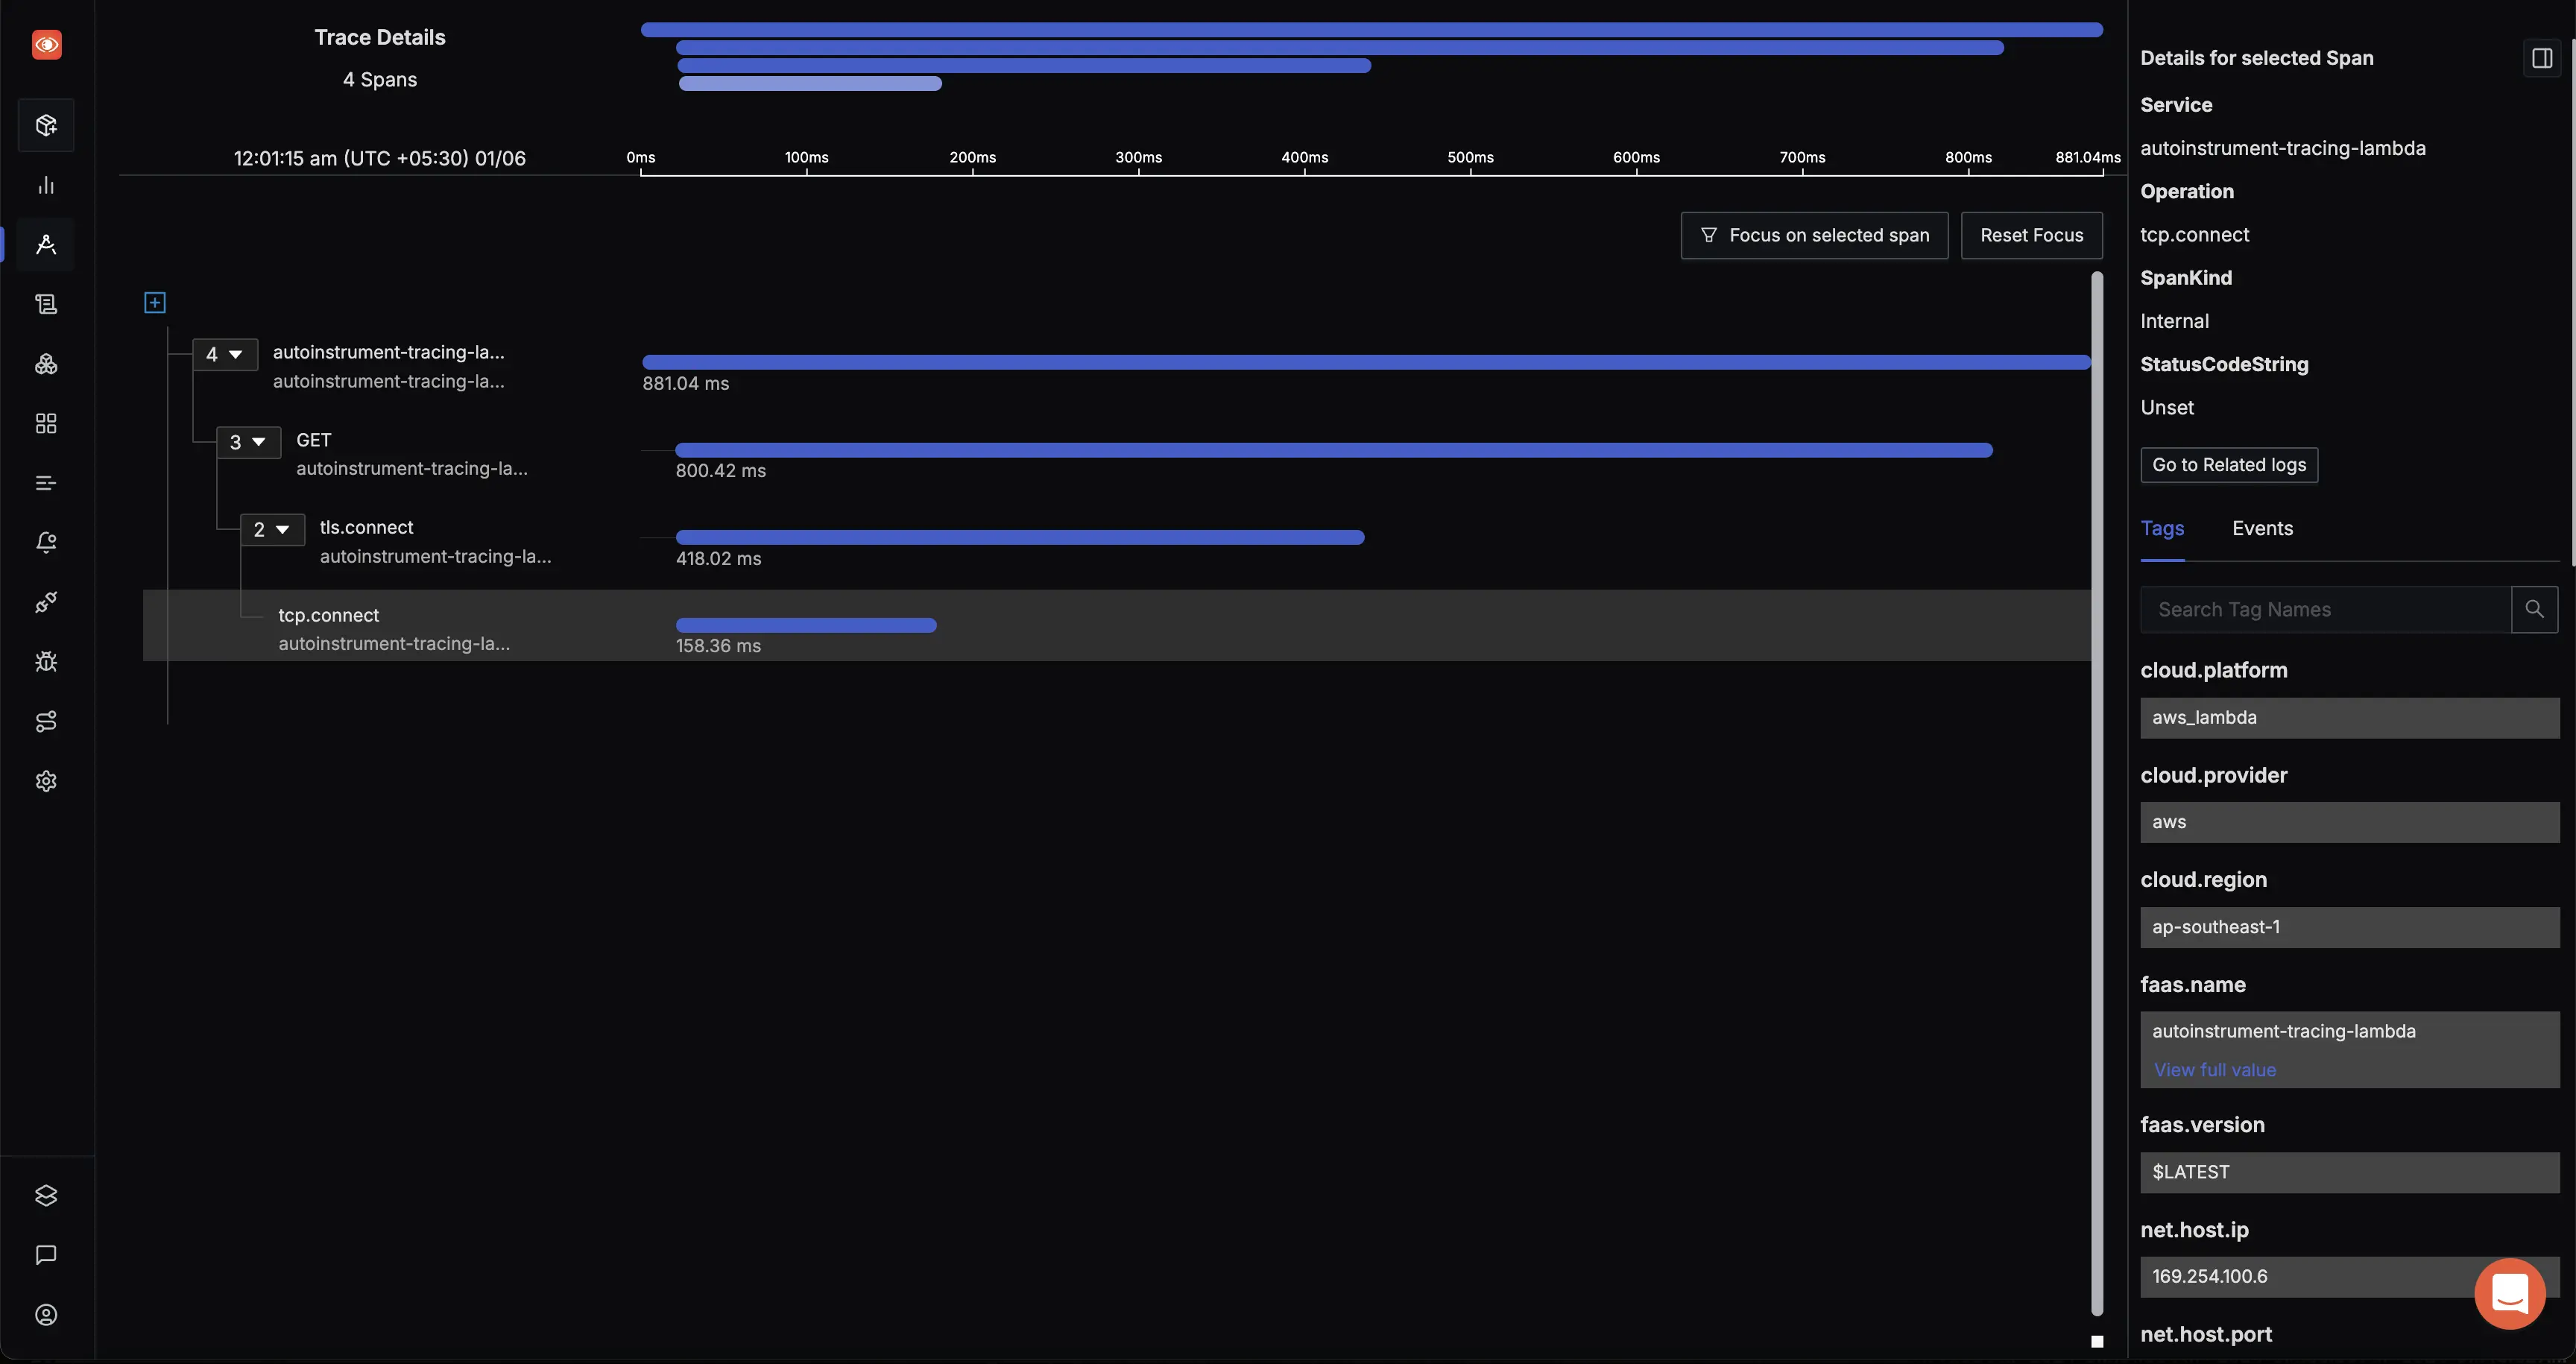
AWS Lambda Auto-Instrumented Trace
