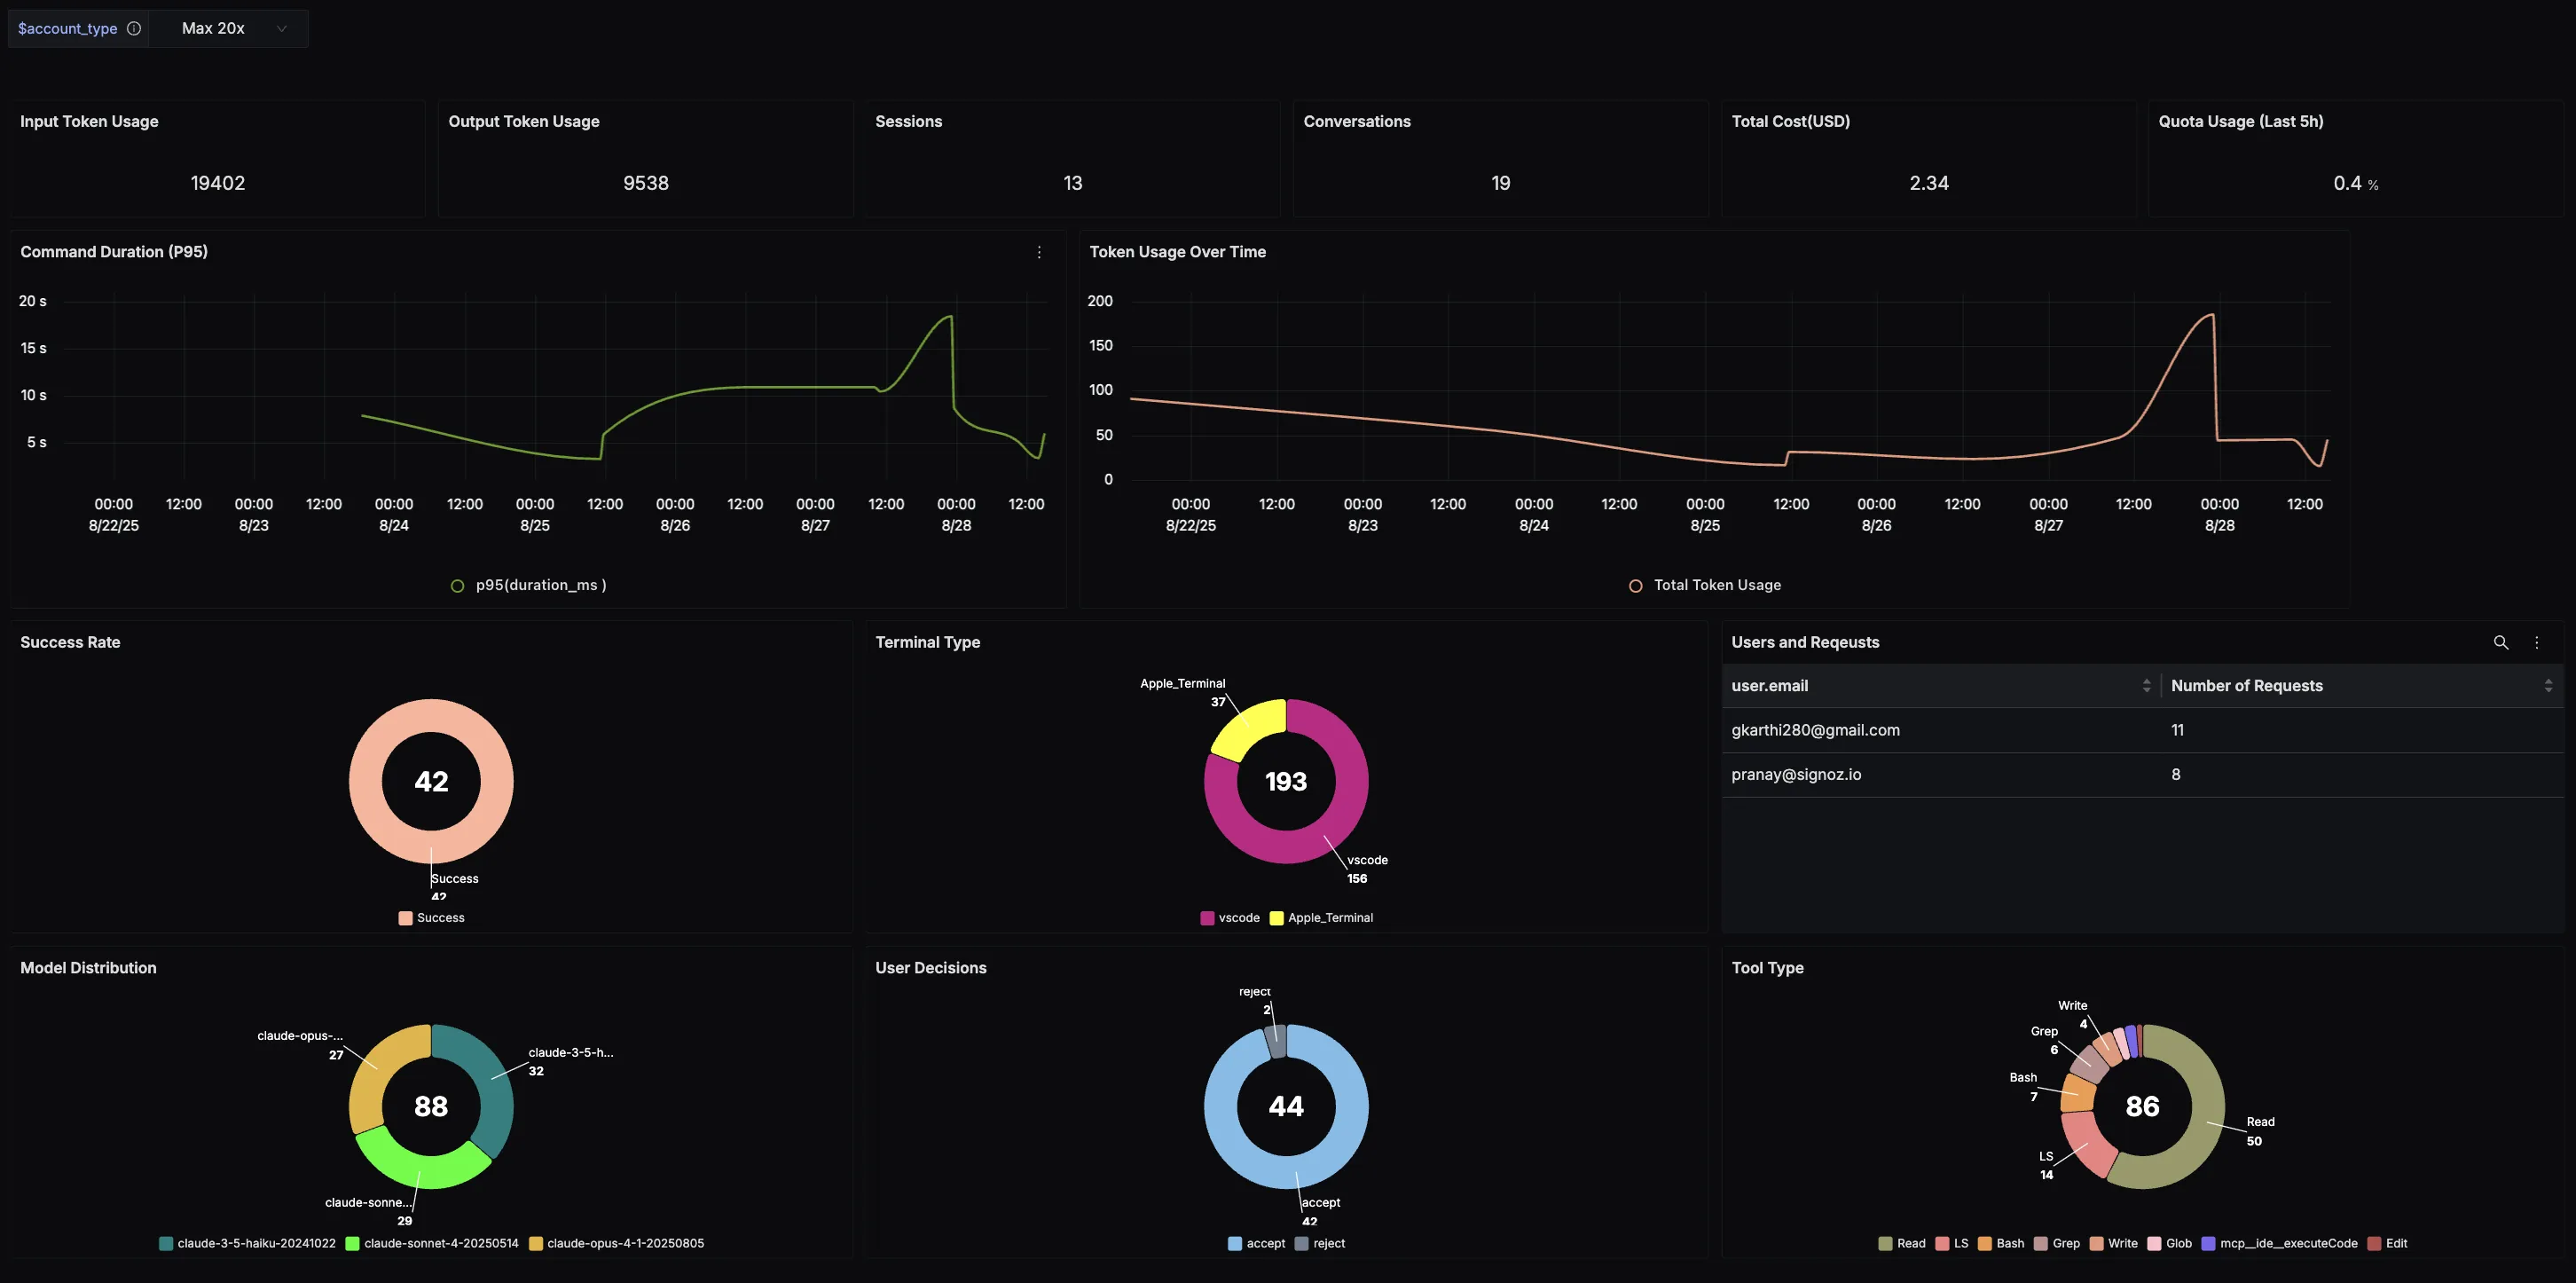
Overview
This guide walks you through enabling monitoring and observability in Claude Code and exporting logs and metrics to SigNoz using OpenTelemetry. Once set up, you’ll be able to track coding session activity, log outputs, and system-level metrics in SigNoz, giving you visibility into performance trends, error rates, and usage patterns directly from your development workflow.
Instrumenting Claude Code with telemetry provides full observability into how coding assistance is used in practice. This is especially useful for engineering teams building AI-assisted developer tools, where insights into latency, error handling, and user behavior are critical. With SigNoz, you can correlate logs and metrics in a single dashboard, set up alerts, and analyze historical data to continuously improve reliability, efficiency, and user experience.
Prerequisites
- SigNoz setup (choose one):
- SigNoz Cloud account with an active ingestion key
- Self-hosted SigNoz instance
- Internet access to send telemetry data to SigNoz Cloud
- Claude Code installed and running on your system
Monitoring Claude Code
Check out detailed instructions on how to set up OpenTelemetry instrumentation for your Claude Code usage over here.
Option 1 (VSCode)
Step 1: Launch VSCode with telemetry enabled
CLAUDE_CODE_ENABLE_TELEMETRY=1 \
OTEL_METRICS_EXPORTER=otlp \
OTEL_LOGS_EXPORTER=otlp \
OTEL_EXPORTER_OTLP_PROTOCOL=grpc \
OTEL_EXPORTER_OTLP_ENDPOINT="https://ingest.<region>.signoz.cloud:443" \
OTEL_EXPORTER_OTLP_HEADERS="signoz-ingestion-key=<your-ingestion-key>" \
OTEL_METRIC_EXPORT_INTERVAL=10000 \
OTEL_LOGS_EXPORT_INTERVAL=5000 \
code .
<region>: Your SigNoz Cloud region<your-ingestion-key>: Your SigNoz ingestion key
Using self-hosted SigNoz? Most steps are identical. To adapt this guide, update the endpoint and remove the ingestion key header as shown in Cloud → Self-Hosted.
This will open VSCode with the required environment variables already configured. From here, any Claude Code activity will automatically generate telemetry and export logs to your SigNoz Cloud instance.
For convenience, you can also clone our bash script, update it with your SigNoz endpoint and ingestion key, and run it directly.
Option 2 (Terminal)
Step 1: Launch Claude Code with telemetry enabled
CLAUDE_CODE_ENABLE_TELEMETRY=1 \
OTEL_METRICS_EXPORTER=otlp \
OTEL_LOGS_EXPORTER=otlp \
OTEL_EXPORTER_OTLP_PROTOCOL=grpc \
OTEL_EXPORTER_OTLP_ENDPOINT="https://ingest.<region>.signoz.cloud:443" \
OTEL_EXPORTER_OTLP_HEADERS="signoz-ingestion-key=<your-ingestion-key>" \
OTEL_METRIC_EXPORT_INTERVAL=10000 \
OTEL_LOGS_EXPORT_INTERVAL=5000 \
claude
- Set the
<region>to match your SigNoz Cloud region - Replace
<your-ingestion-key>with your SigNoz ingestion key
Using self-hosted SigNoz? Most steps are identical. To adapt this guide, update the endpoint and remove the ingestion key header as shown in Cloud → Self-Hosted.
This will launch Claude Code with telemetry enabled. Any Claude Code activity in the terminal session will automatically generate and export logs and metrics to your SigNoz Cloud instance.
For convenience, you can also clone our bash script, update it with your SigNoz endpoint and ingestion key, and run it directly.
Administrator Configuration
Administrators can configure OpenTelemetry settings for all users through the managed settings file. This allows for centralized control of telemetry settings across an organization. See the settings precedence for more information about how settings are applied.
The managed settings file is located at:
- macOS:
/Library/Application Support/ClaudeCode/managed-settings.json - Linux and WSL:
/etc/claude-code/managed-settings.json - Windows:
C:\ProgramData\ClaudeCode\managed-settings.json
Example managed settings configuration:
{
  "env": {
    "CLAUDE_CODE_ENABLE_TELEMETRY": "1",
    "OTEL_METRICS_EXPORTER": "otlp",
    "OTEL_LOGS_EXPORTER": "otlp",
    "OTEL_EXPORTER_OTLP_PROTOCOL": "grpc",
    "OTEL_EXPORTER_OTLP_ENDPOINT": "http://collector.company.com:4317",
    "OTEL_EXPORTER_OTLP_HEADERS": "Authorization=Bearer company-token"
  }
}
Managed settings can be distributed via MDM (Mobile Device Management) or other device management solutions. Environment variables defined in the managed settings file have high precedence and cannot be overridden by users.
Example Configurations
# Console debugging (1-second intervals)
export CLAUDE_CODE_ENABLE_TELEMETRY=1
export OTEL_METRICS_EXPORTER=console
export OTEL_METRIC_EXPORT_INTERVAL=1000

# OTLP/gRPC
export CLAUDE_CODE_ENABLE_TELEMETRY=1
export OTEL_METRICS_EXPORTER=otlp
export OTEL_EXPORTER_OTLP_PROTOCOL=grpc
export OTEL_EXPORTER_OTLP_ENDPOINT=http://localhost:4317

# Prometheus
export CLAUDE_CODE_ENABLE_TELEMETRY=1
export OTEL_METRICS_EXPORTER=prometheus

# Multiple exporters
export CLAUDE_CODE_ENABLE_TELEMETRY=1
export OTEL_METRICS_EXPORTER=console,otlp
export OTEL_EXPORTER_OTLP_PROTOCOL=http/json

# Different endpoints/backends for metrics and logs
export CLAUDE_CODE_ENABLE_TELEMETRY=1
export OTEL_METRICS_EXPORTER=otlp
export OTEL_LOGS_EXPORTER=otlp
export OTEL_EXPORTER_OTLP_METRICS_PROTOCOL=http/protobuf
export OTEL_EXPORTER_OTLP_METRICS_ENDPOINT=http://metrics.company.com:4318
export OTEL_EXPORTER_OTLP_LOGS_PROTOCOL=grpc
export OTEL_EXPORTER_OTLP_LOGS_ENDPOINT=http://logs.company.com:4317

# Metrics only (no events/logs)
export CLAUDE_CODE_ENABLE_TELEMETRY=1
export OTEL_METRICS_EXPORTER=otlp
export OTEL_EXPORTER_OTLP_PROTOCOL=grpc
export OTEL_EXPORTER_OTLP_ENDPOINT=http://localhost:4317

# Events/logs only (no metrics)
export CLAUDE_CODE_ENABLE_TELEMETRY=1
export OTEL_LOGS_EXPORTER=otlp
export OTEL_EXPORTER_OTLP_PROTOCOL=grpc
export OTEL_EXPORTER_OTLP_ENDPOINT=http://localhost:4317
Your Claude Code activity should now automatically emit logs and metrics.
Finally, you should be able to view logs in Signoz Cloud under the logs tab:

When you click on any of these logs in SigNoz, you'll see a detailed view of the log, including attributes:
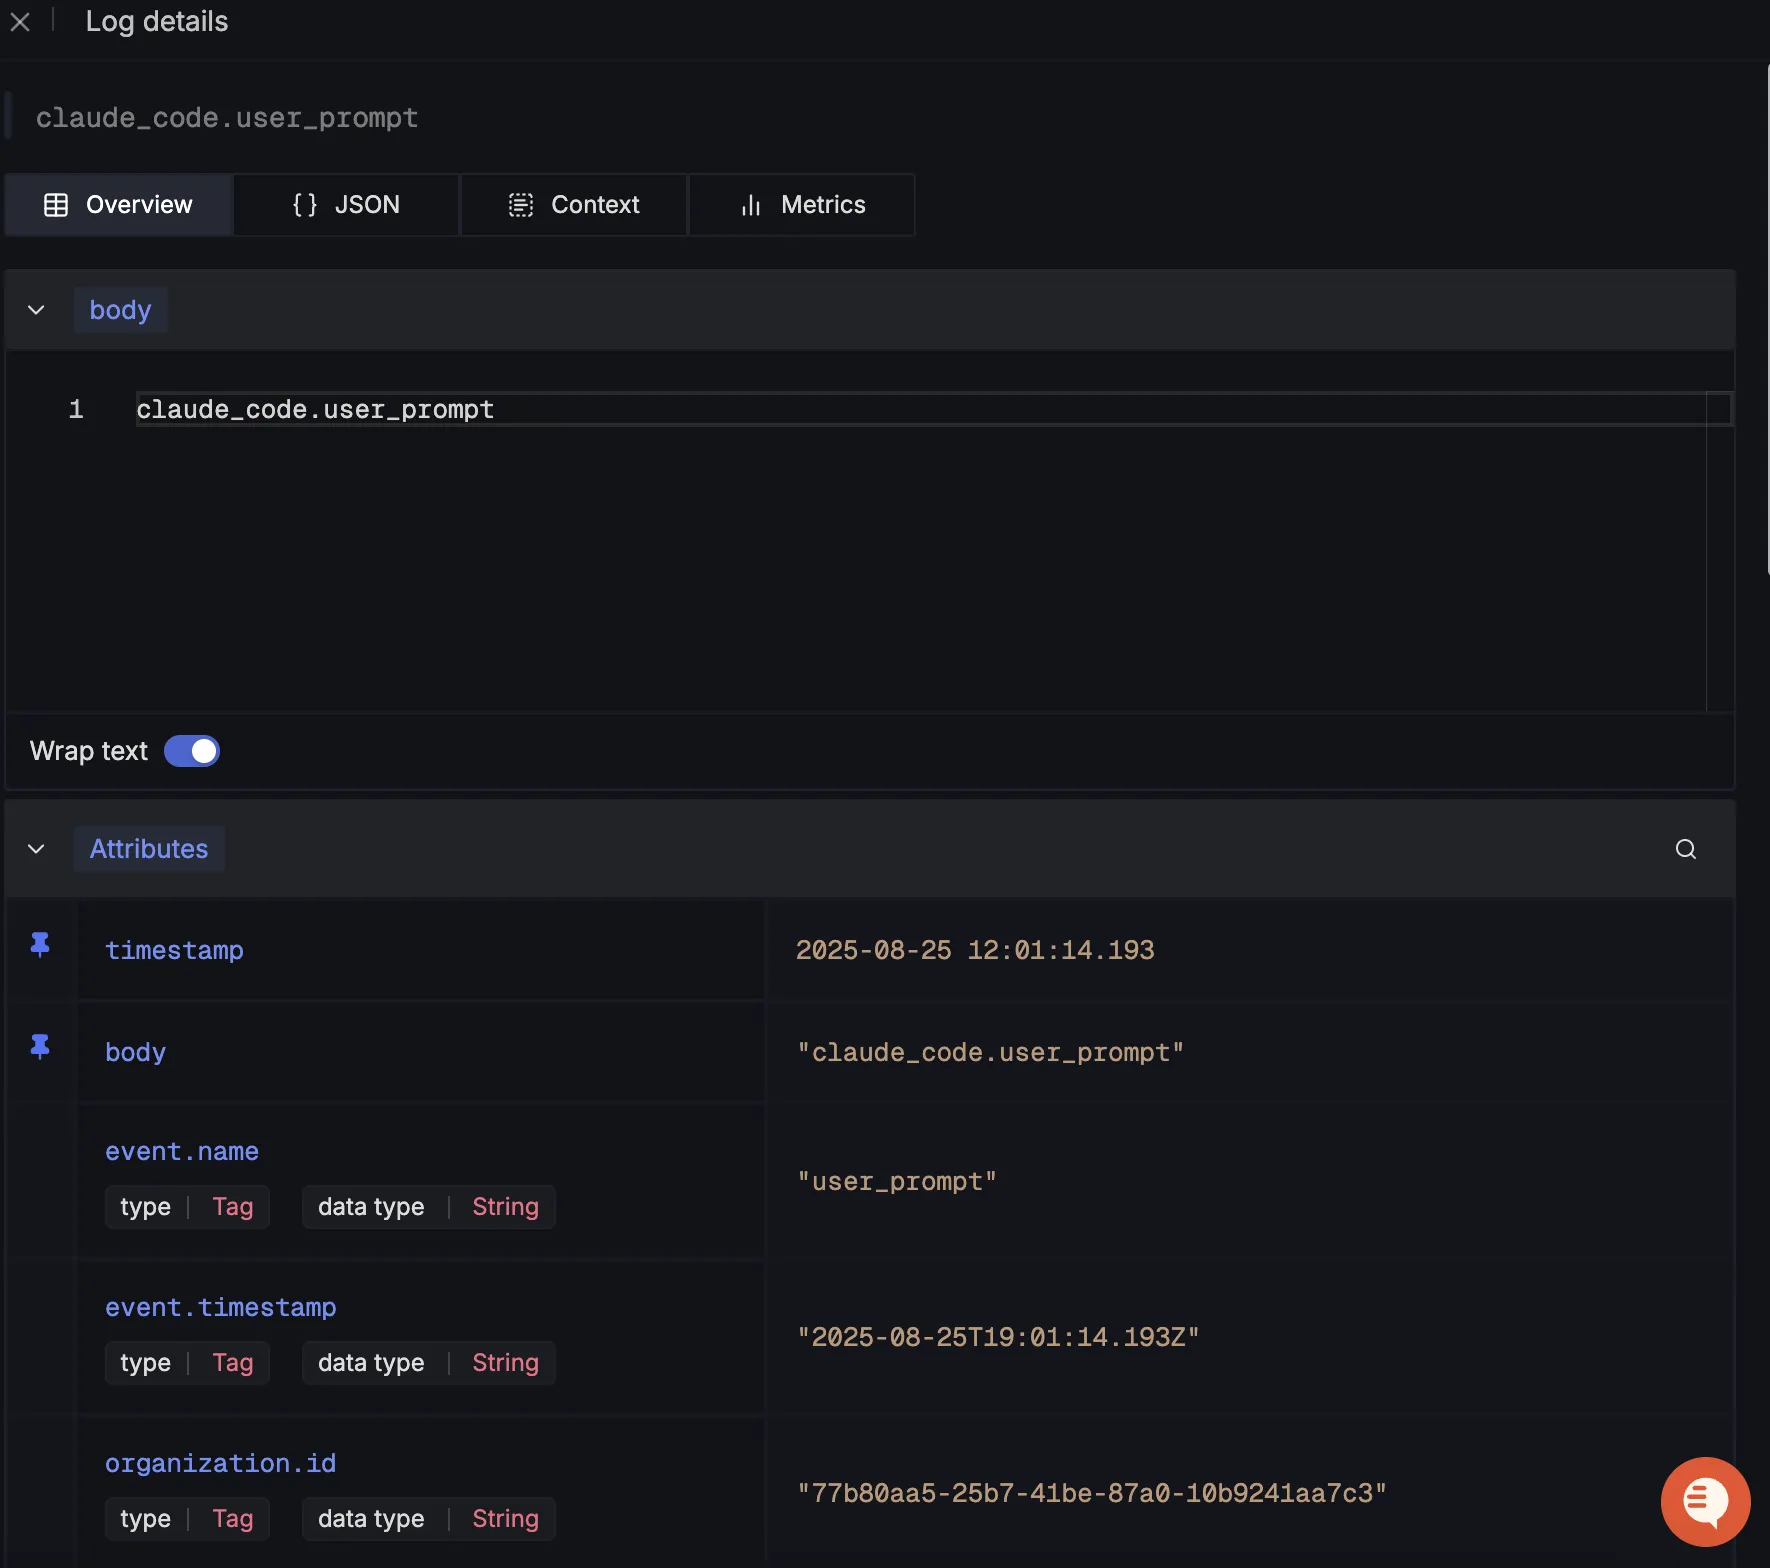
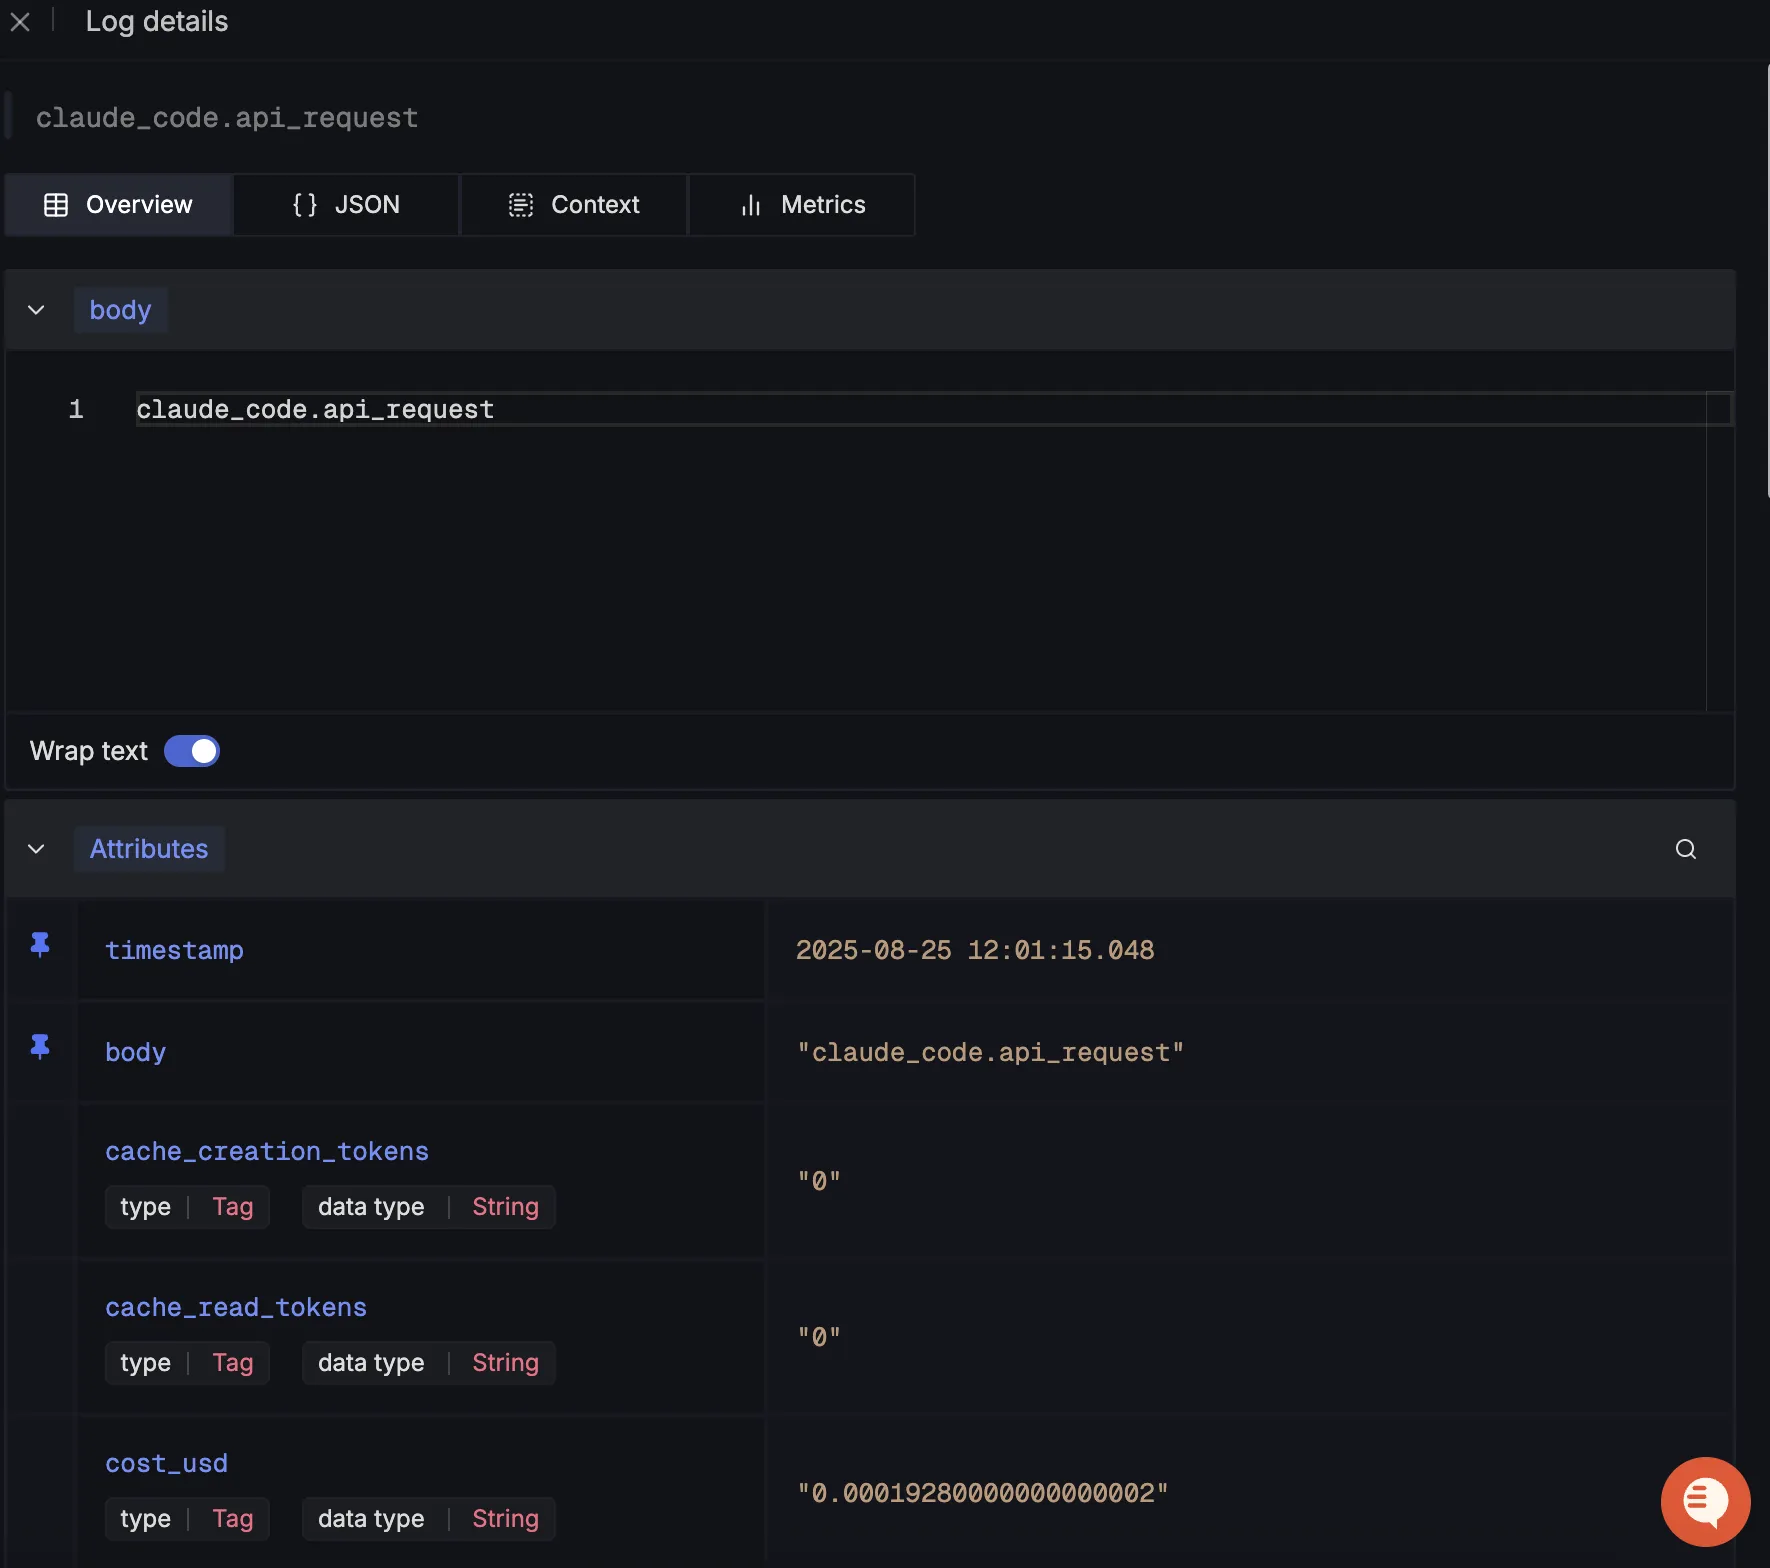
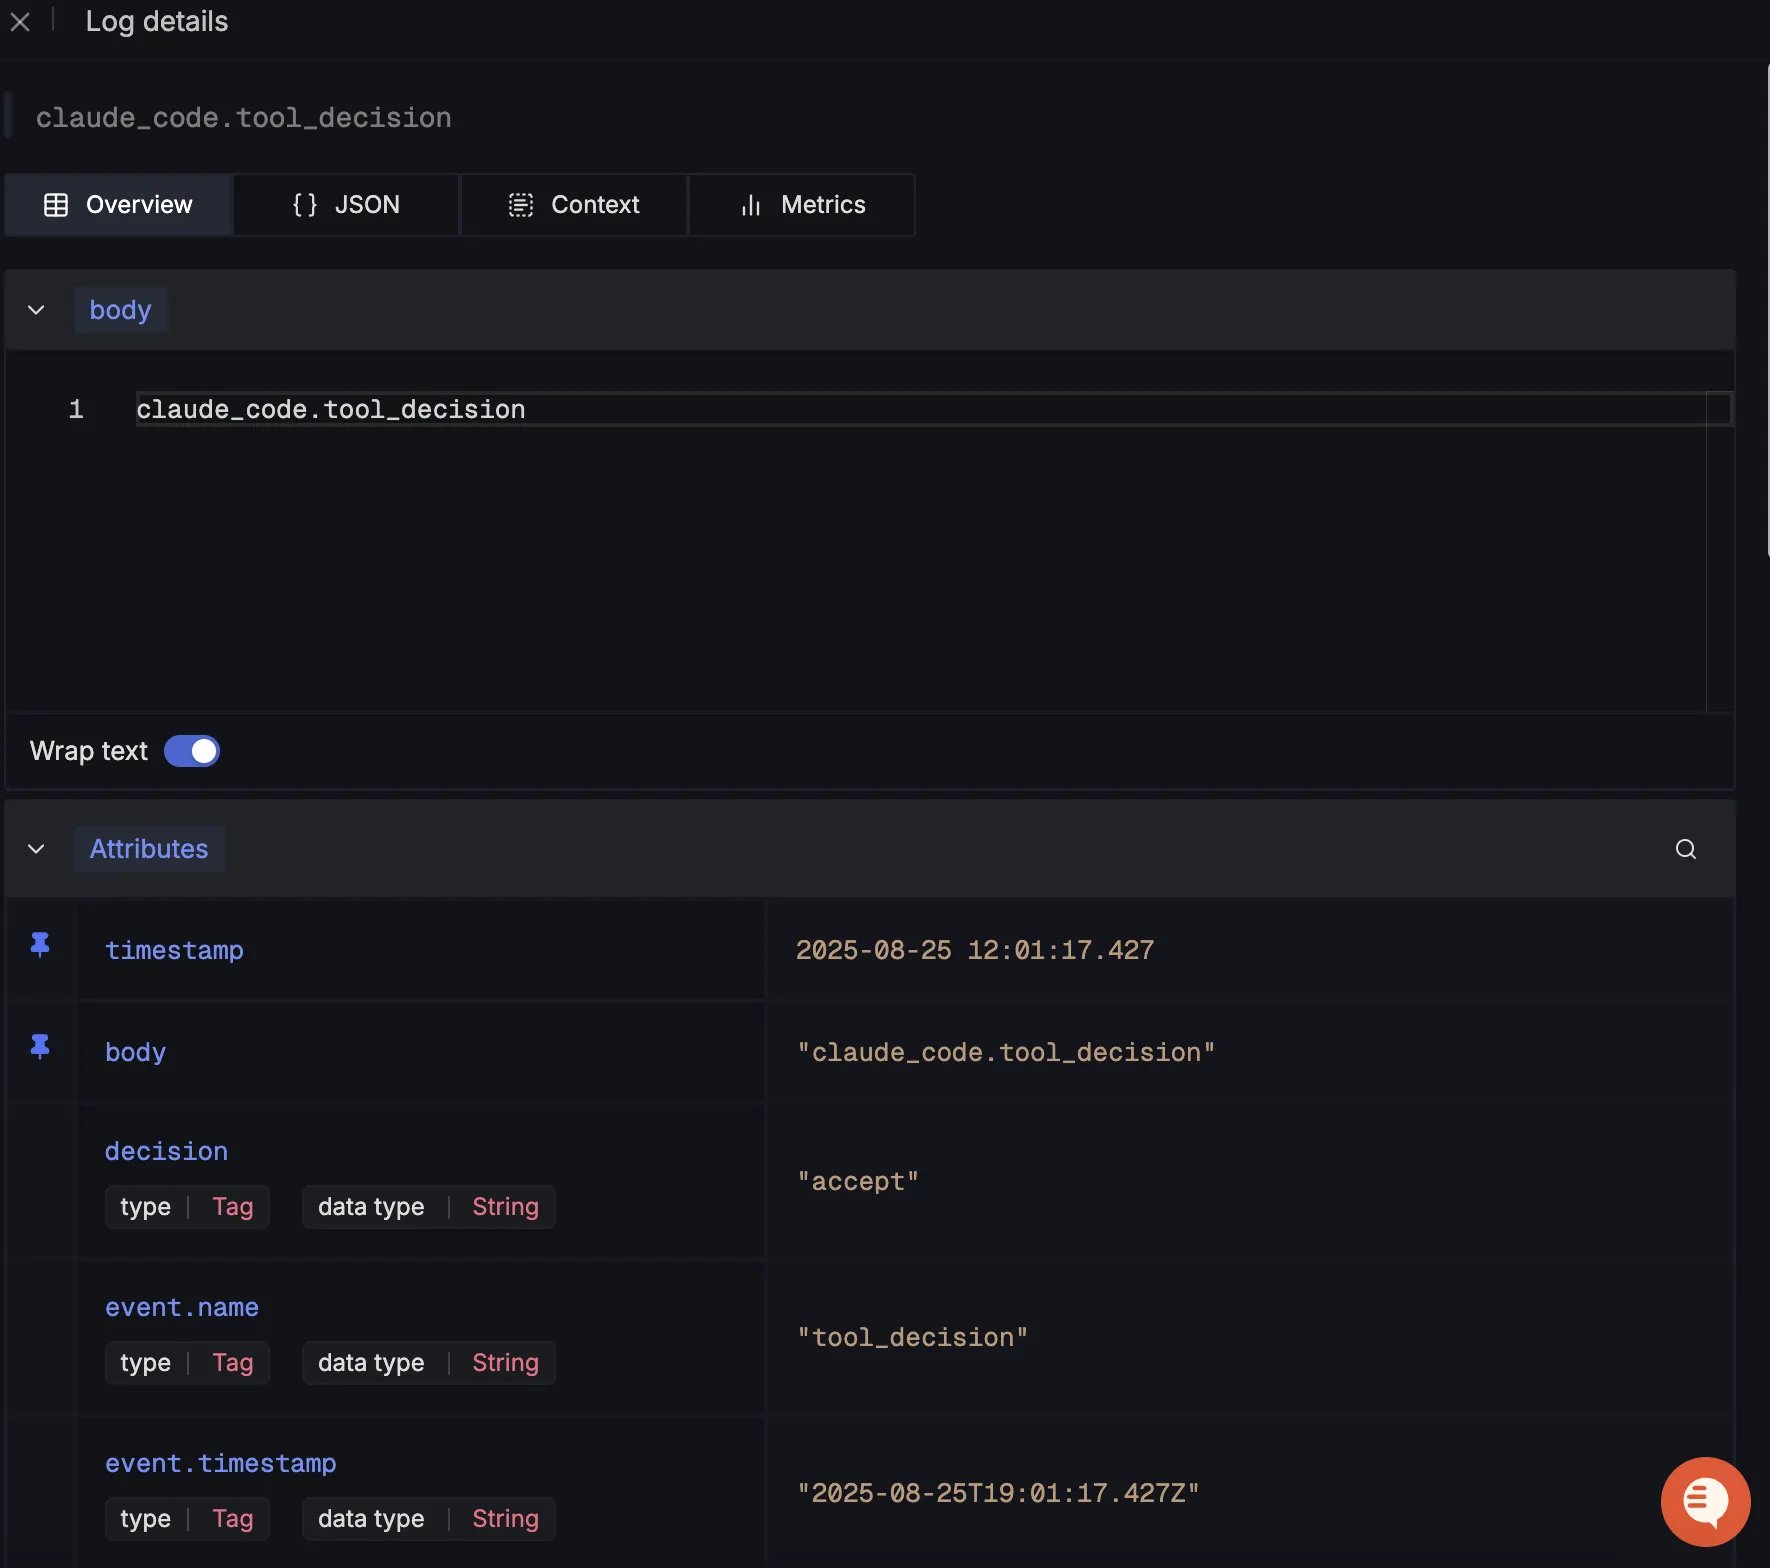

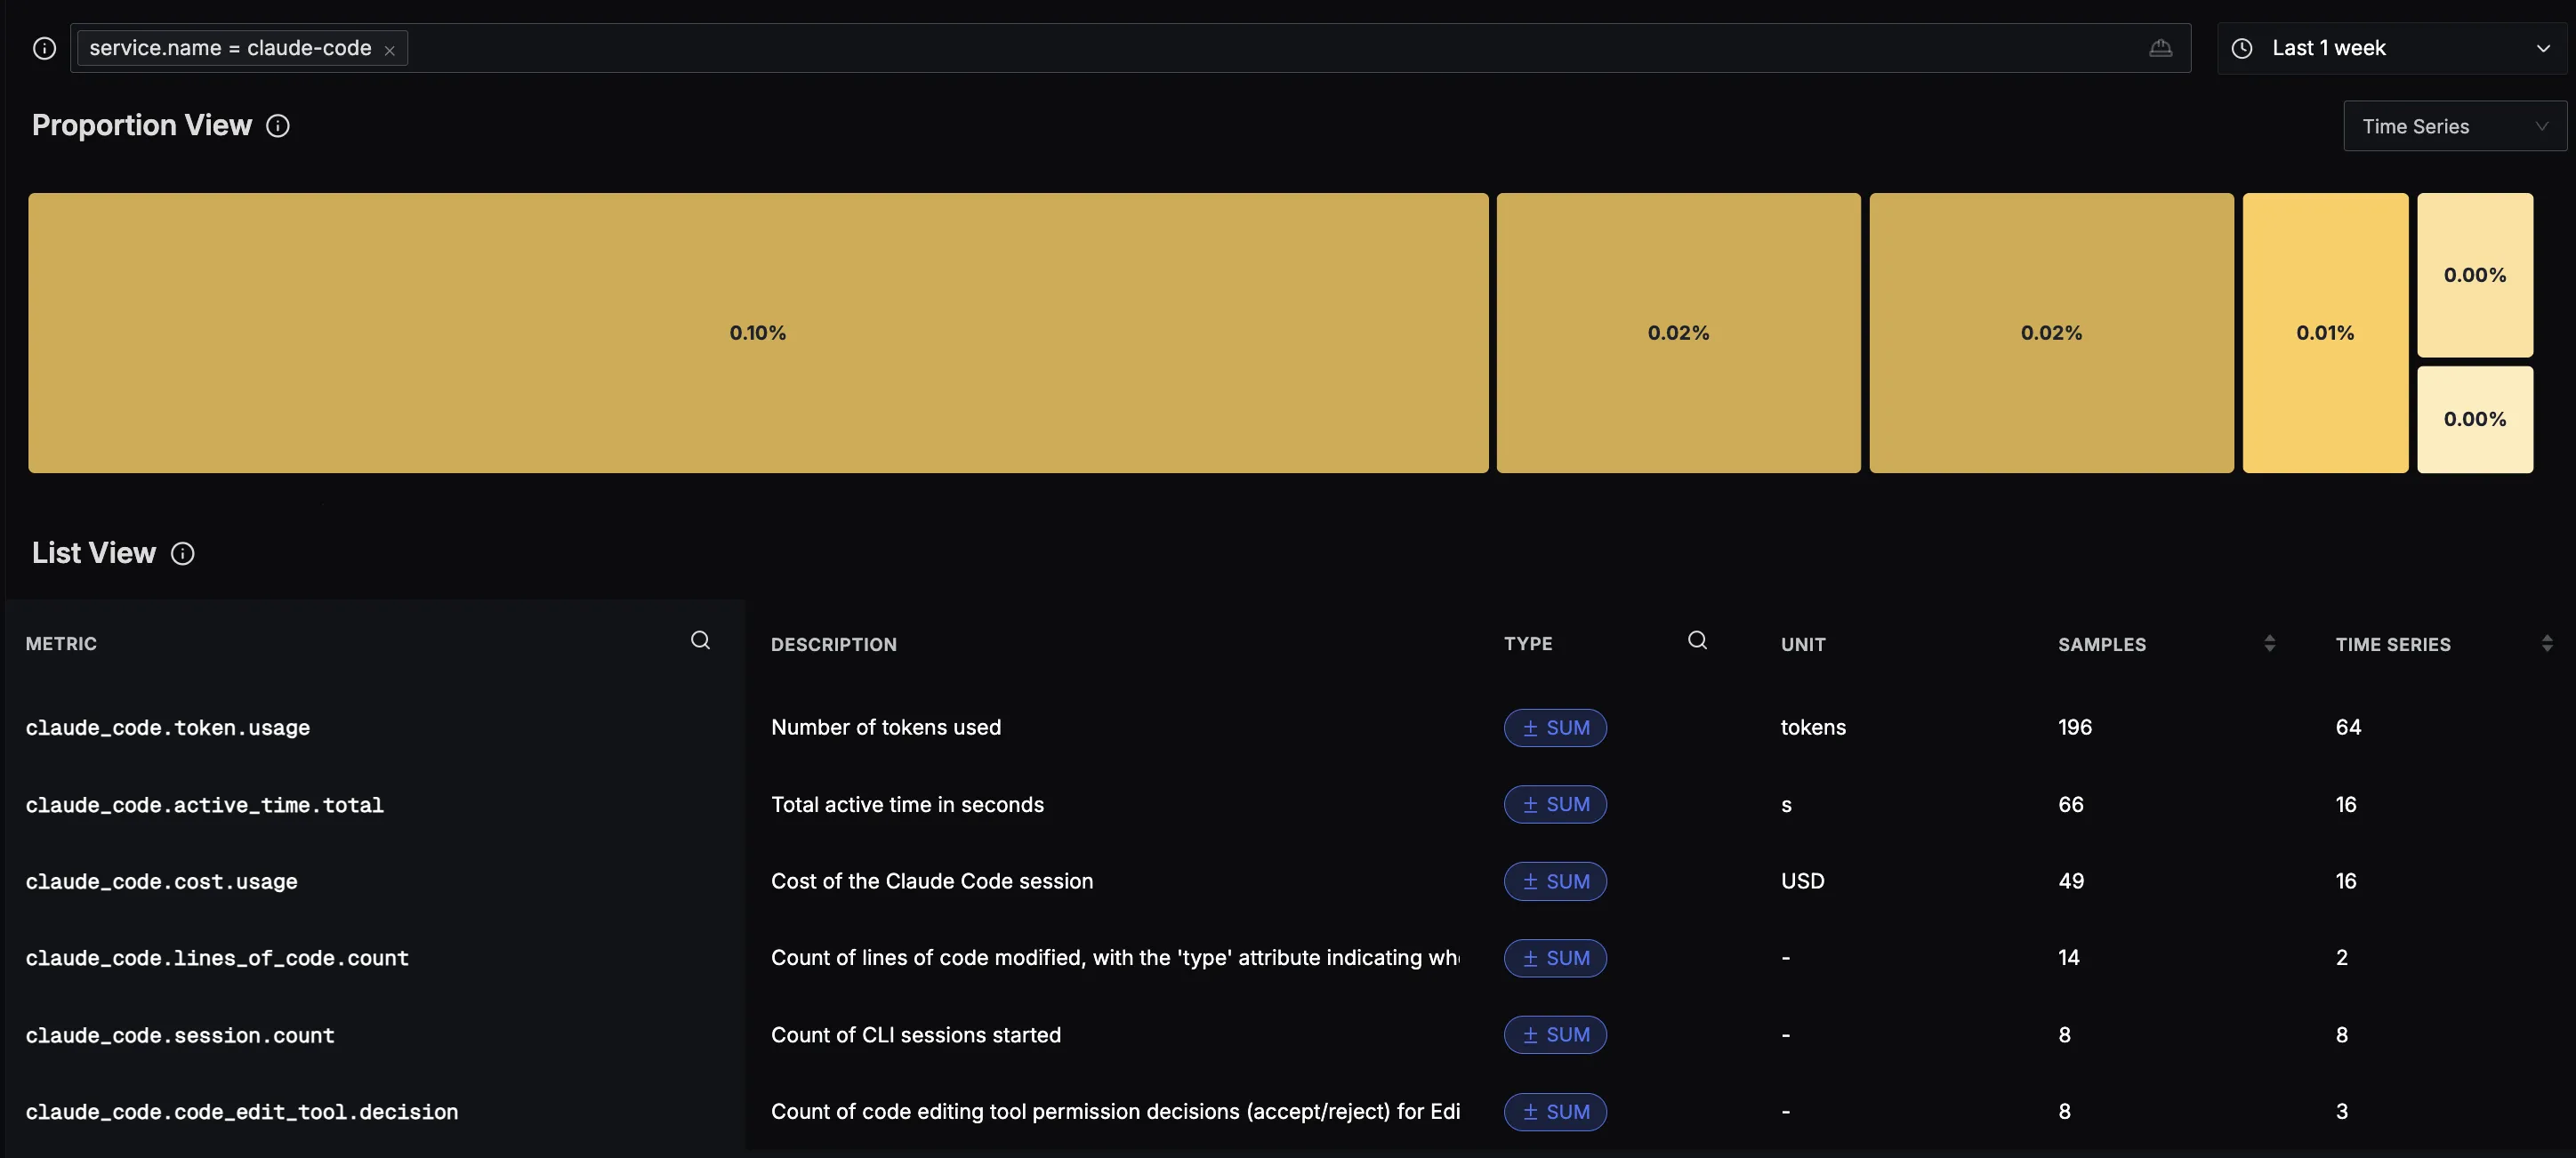
You should be able to see Claude Code related metrics in Signoz Cloud under the metrics tab:
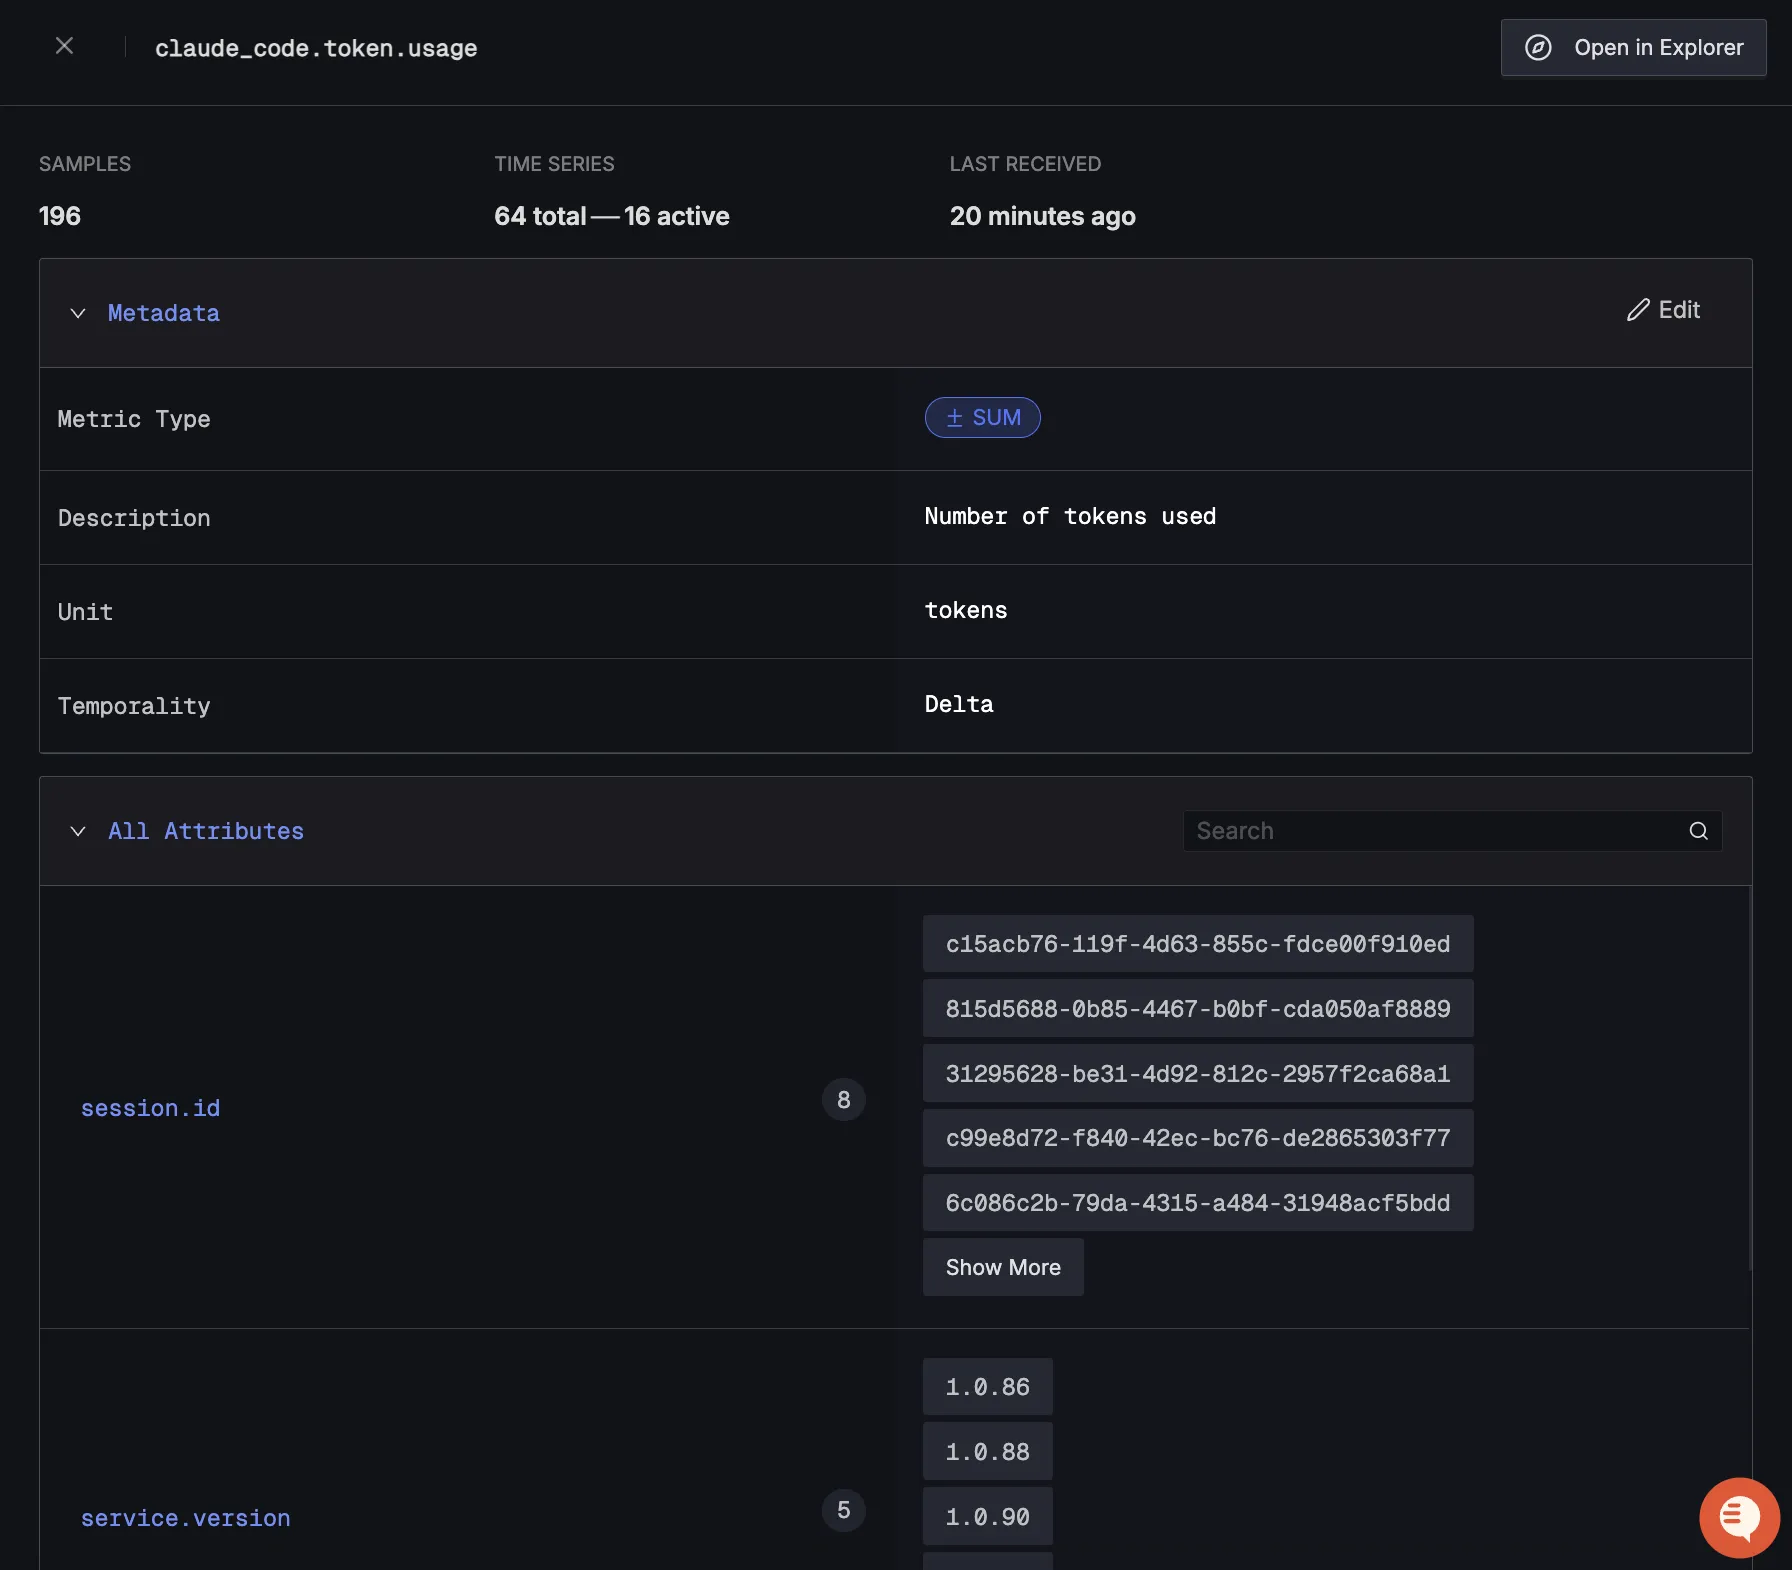
When you click on any of these metrics in SigNoz, you'll see a detailed view of the metric, including attributes:
Dashboard
You can also check out our custom Claude Code dashboard here which provides specialized visualizations for monitoring your Claude Code usage. The dashboard includes pre-built charts specifically tailored for LLM usage, along with import instructions to get started quickly.
