Overview
The Cost Meter is SigNoz's comprehensive solution for monitoring and controlling observability costs across all telemetry signals. By providing detailed insights into your data ingestion patterns, Cost Meter helps you understand cost drivers, optimize your observability spend, and make informed decisions about your monitoring strategy.
Use Cases:
Some of the use-cases you can achieve with Cost Meter include:
- Monitor costs across different telemetry signals
- Understand the cost breakdown and key contributors
- Optimize your observability spend
Key Benefits
- Cost Transparency: Clear visibility into your observability costs across all signals
- Signal-Level Breakdown: Detailed cost analysis for logs, traces, and metrics
- Real-Time Monitoring: Track costs as they occur with hourly aggregation
Pricing Model
SigNoz follows a predictable, usage-based pricing model where you are charged based on the telemetry data being ingested in the cloud. This transparent approach ensures you only pay for what you use, with no surprise costs. For detailed pricing information, visit our Pricing Page.
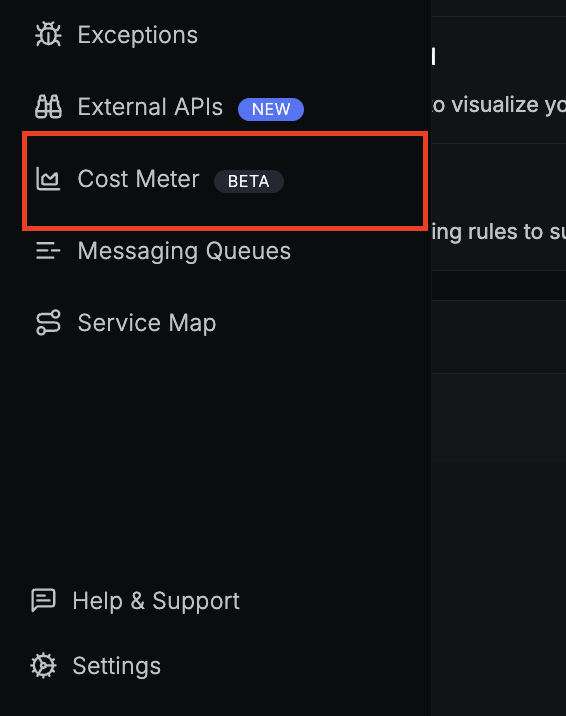
Accessing Cost Meter
You can access the Cost Meter module through the side navigation bar in your SigNoz interface.
Important: Meter data is aggregated over hourly intervals. Queries with time ranges under 1 hour will not return any data. For real-time analysis, use time ranges of 1 hour or greater.
Cost Meter Dashboard
The Cost Meter homepage is organized into four main sections, each providing specific insights into different aspects of your observability costs:
1. Total Overview
The Total section provides a comprehensive view of all cost contributors across your observability stack.
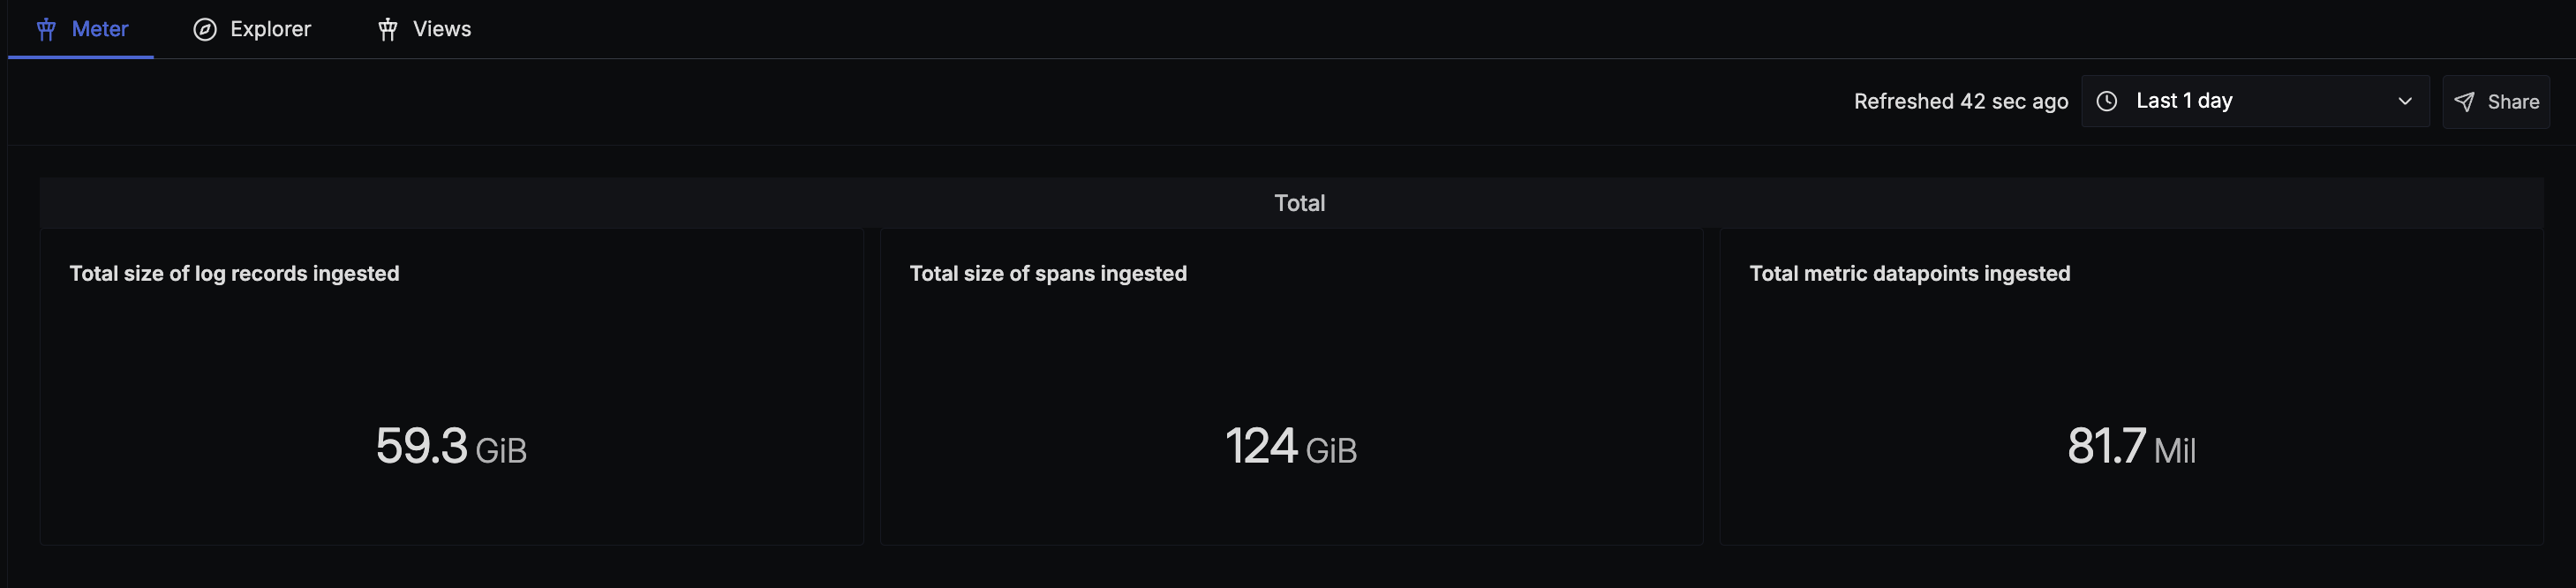
Key Metrics Displayed:
- Log Records Size: Total size of log records ingested
- Span Size: Total size of spans ingested
- Metric Datapoints: Total number of metric datapoints ingested
2. Logs Analysis
The Logs section provides detailed insights into your log telemetry costs and consumption patterns.
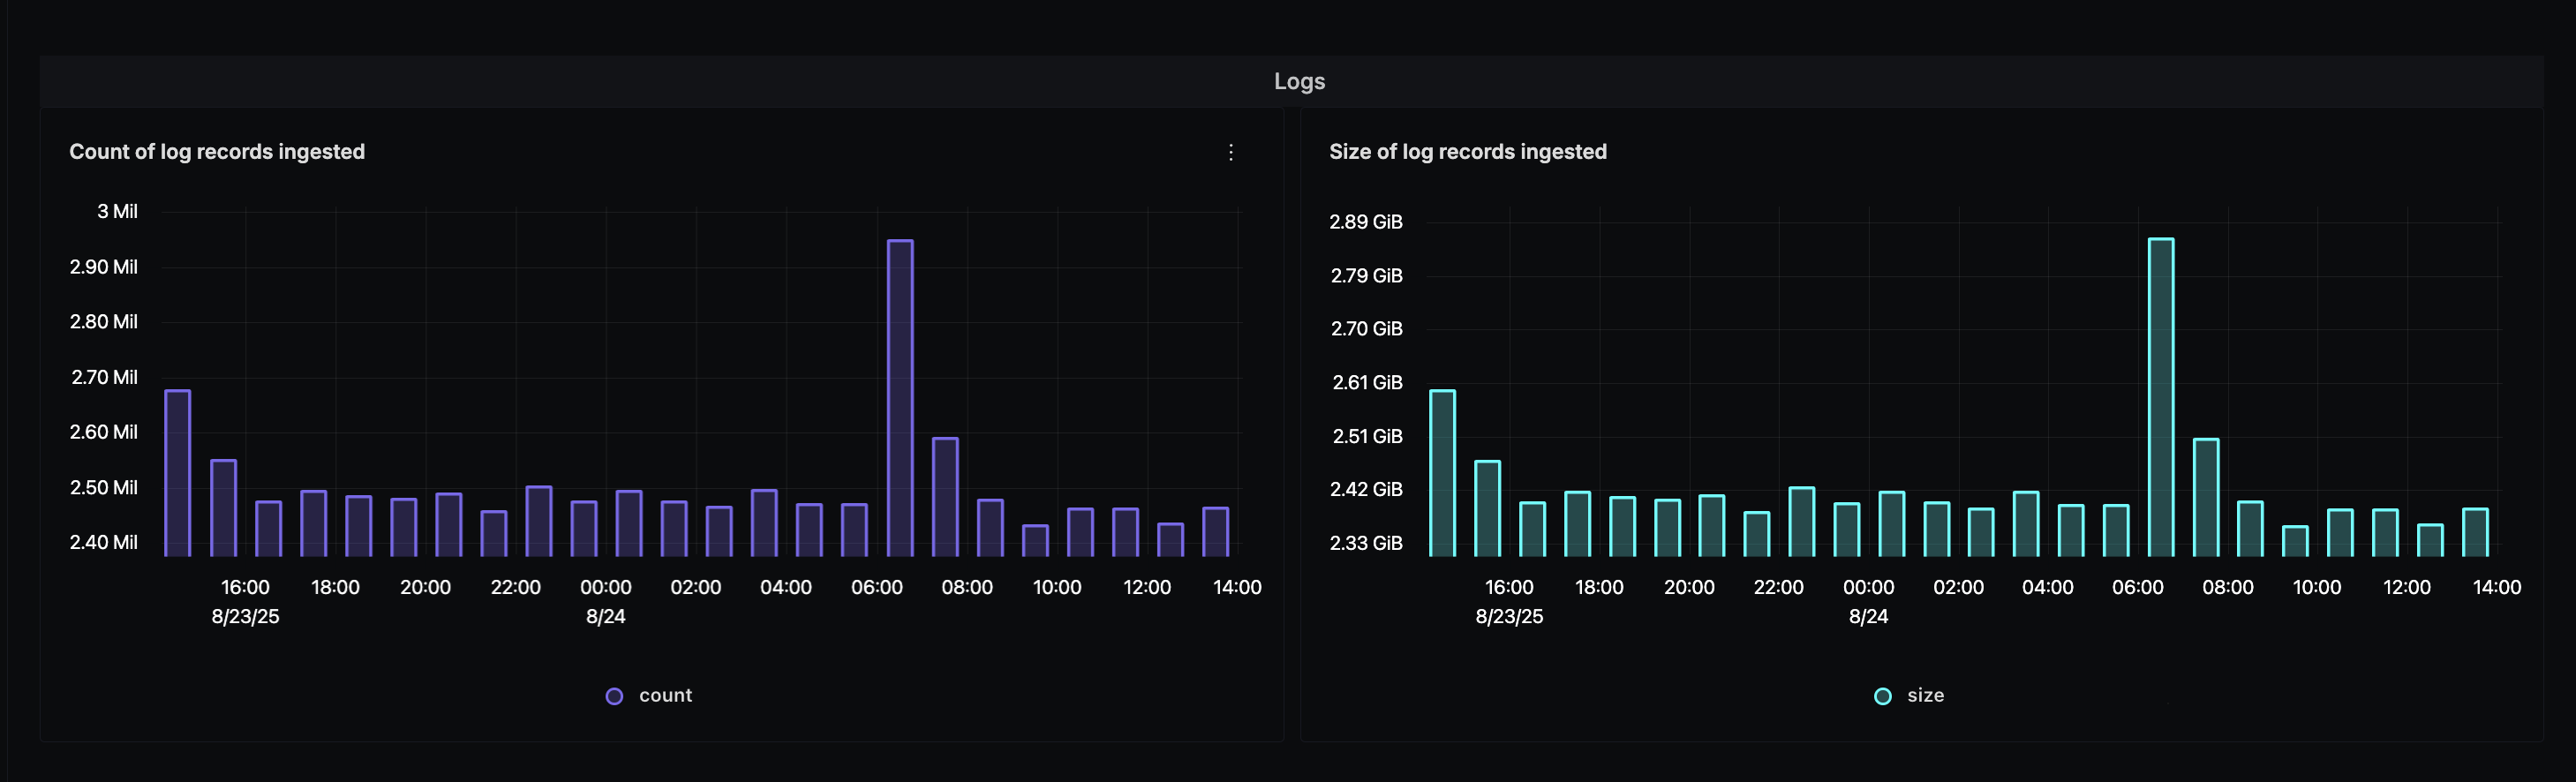
Logs Insights Include:
- Log Record Count: Number of log records ingested
- Log Size: Total size of log data in bytes
3. Traces Analysis
The Traces section delivers comprehensive insights into your distributed tracing costs and span ingestion patterns.
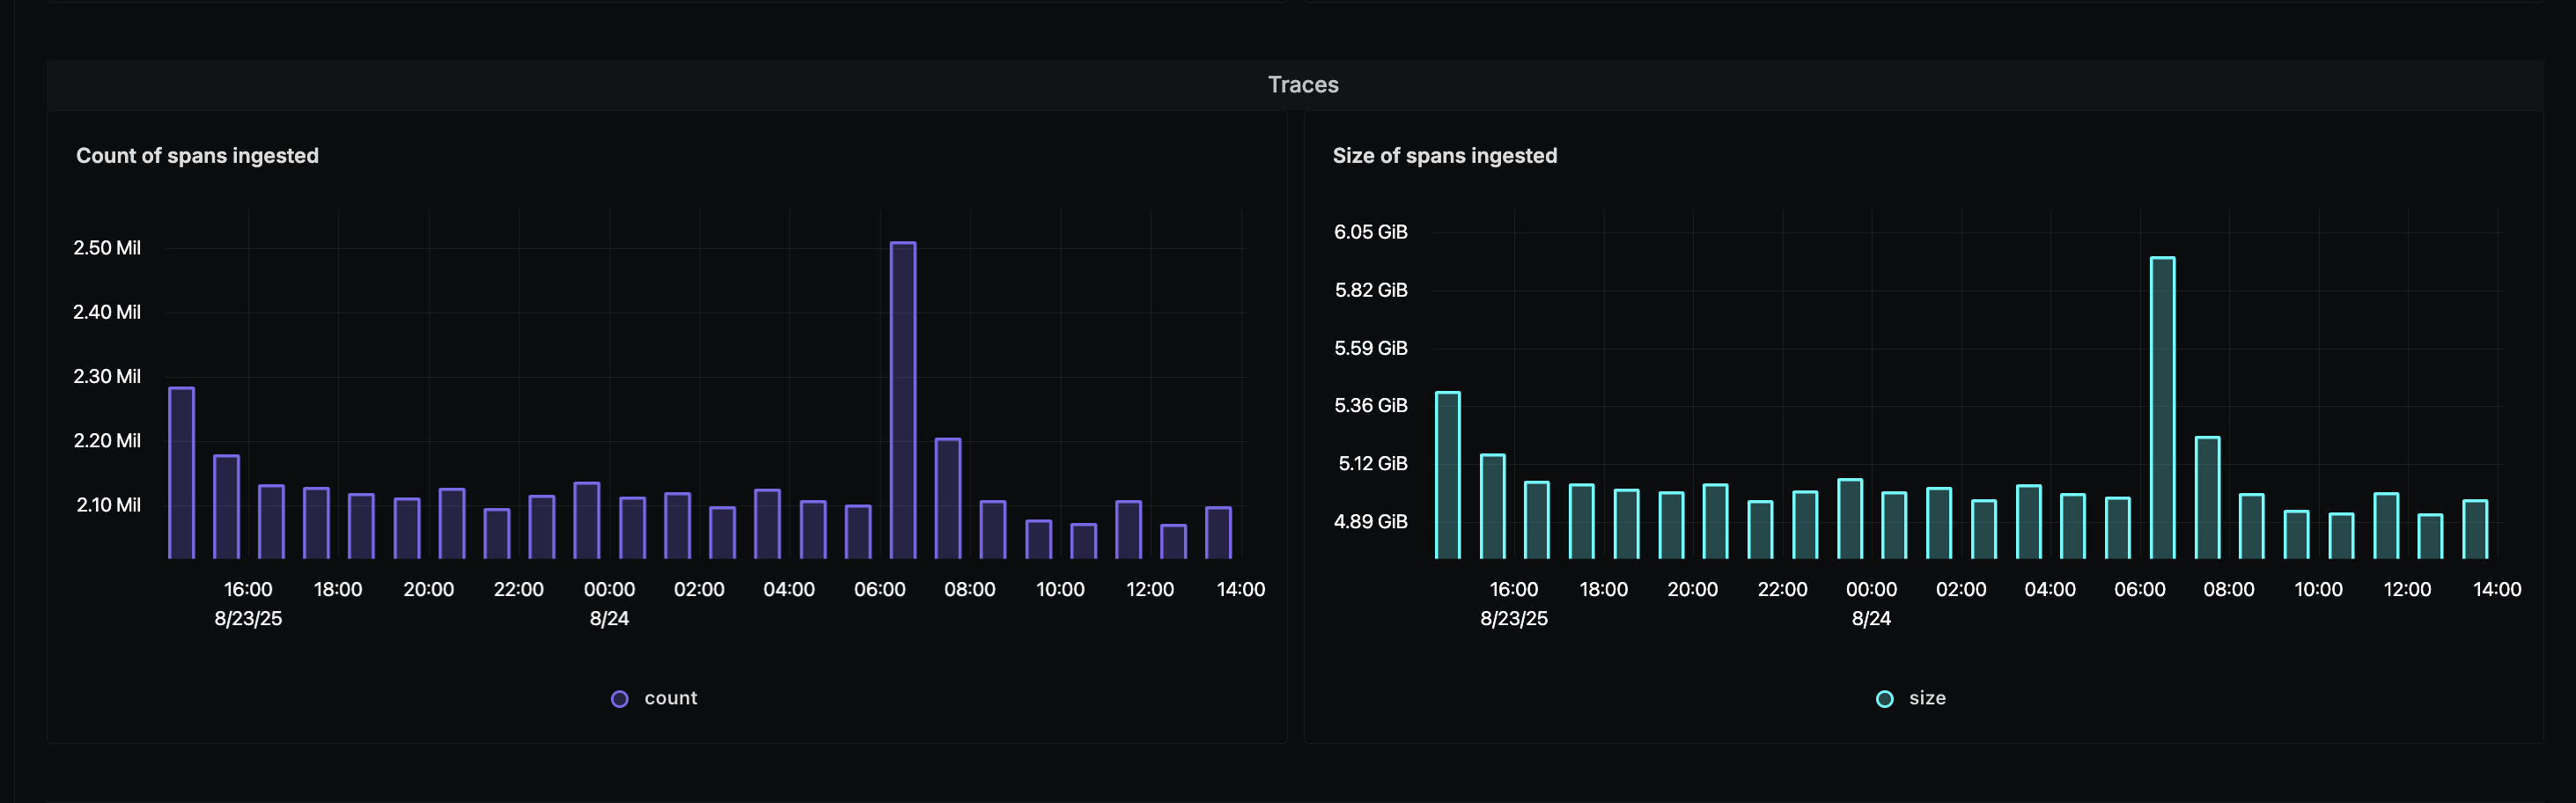
Traces Insights Include:
- Span Count: Number of spans ingested
- Span Size: Total size of span data in bytes
4. Metrics Analysis
The Metrics section provides detailed insights into your metric datapoint ingestion and associated costs.
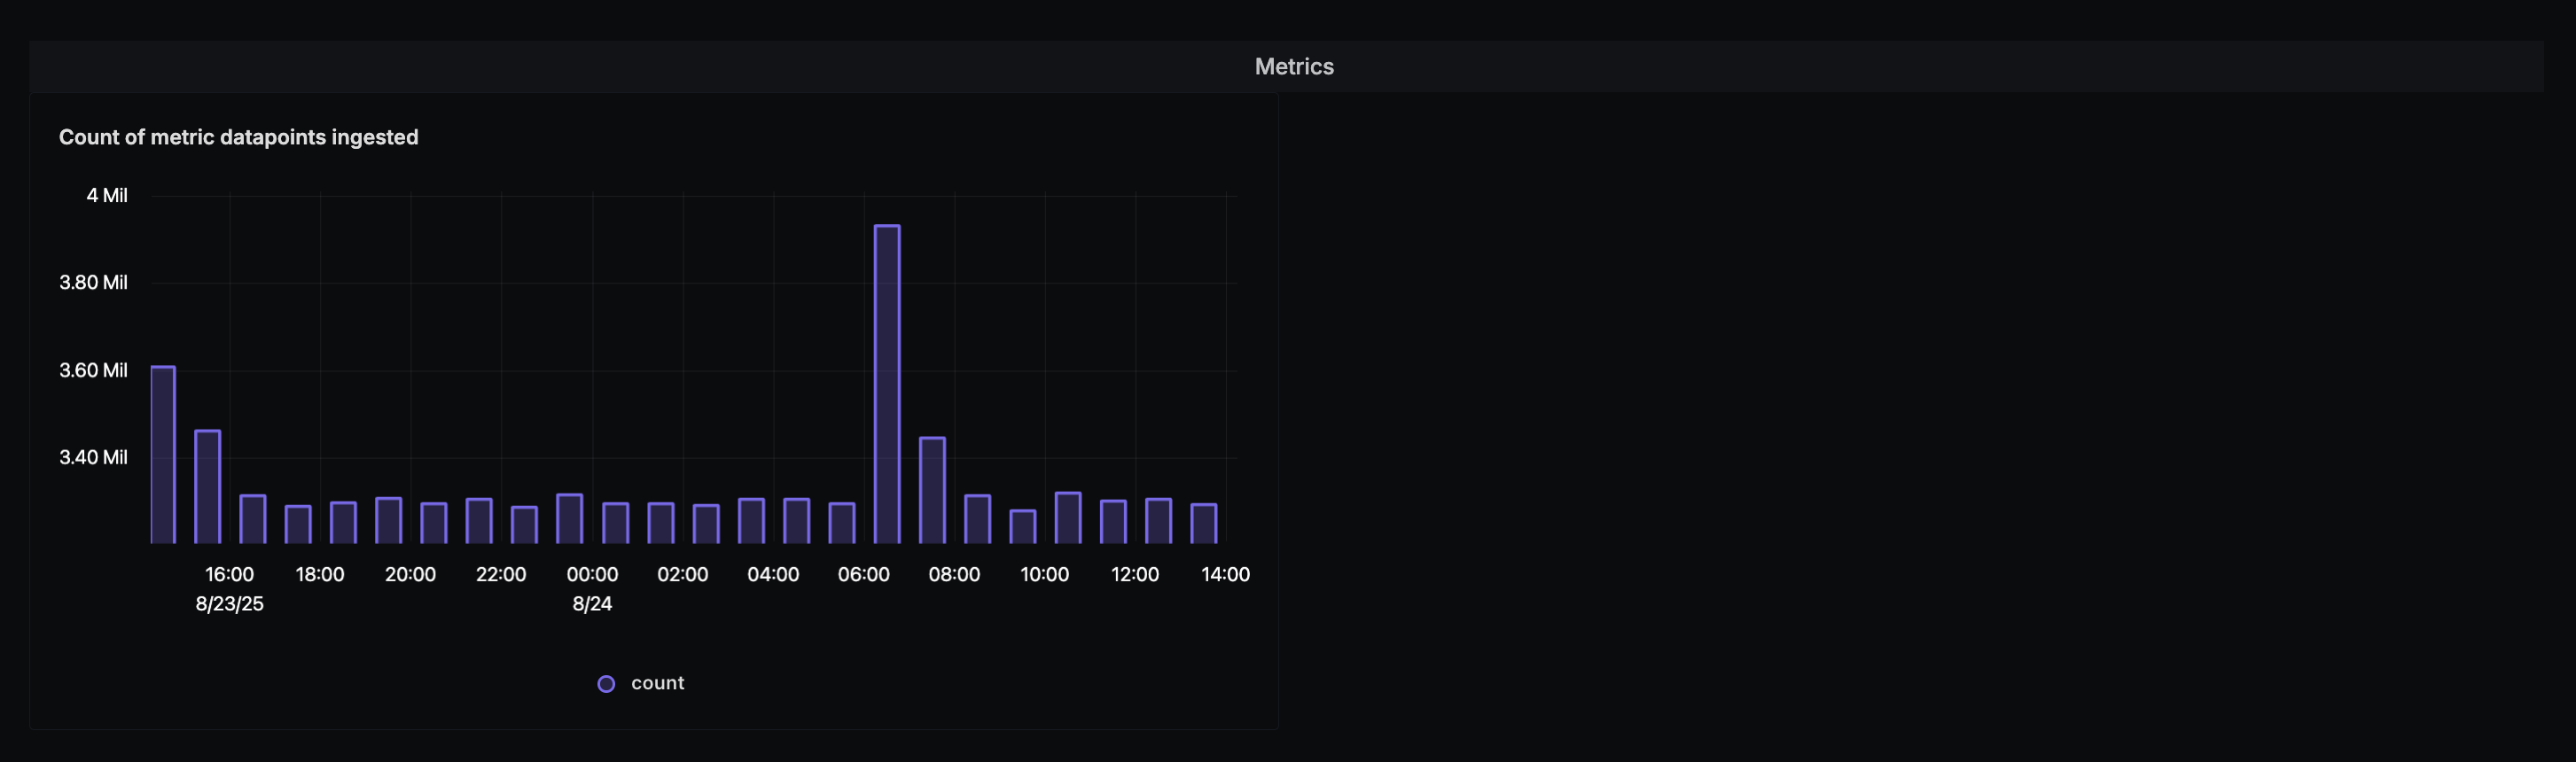
Metrics Insights Include:
- Datapoint Count: Number of metric datapoints ingested
Next Steps
Explore Meter Explorer to dive deeper into meter metrics with advanced querying.
Set up Meter Alerts to proactively monitor costs and receive notifications when you approach or exceed cost/ingestion limits.
Explore Reducing Costs to understand how cardinality affects your metrics billing and discover strategies to optimize costs.
For additional support and discussion, visit our Community Forum. For advanced topics and comprehensive guides, explore our Documentation.
