Overview
This guide walks you through setting up monitoring for Crew AI using OpenTelemetry and exporting logs, traces, and metrics to SigNoz. With this integration, you can observe agent, model, tool performance, and track system-level metrics in SigNoz, giving you real-time visibility into latency, error rates, and usage trends for your Crew AI applications.
Instrumenting Crew AI in your LLM applications with telemetry ensures full observability across your AI workflows, making it easier to debug issues, optimize performance, and understand user interactions. By leveraging SigNoz, you can analyze correlated traces, logs, and metrics in unified dashboards, configure alerts, and gain actionable insights to continuously improve reliability, responsiveness, and user experience.
Prerequisites
- A SigNoz Cloud account with an active ingestion key
- Internet access to send telemetry data to SigNoz Cloud
- Crew AI integrated into your app
- Basic understanding of AI Agents and tool calling workflow
- For Python:
pipinstalled for managing Python packages and (optional but recommended) a Python virtual environment to isolate dependencies
Monitoring Crew AI
Step 1: Install the necessary packages in your Python environment.
CrewAI supports a variety of LLM providers for agent workflows, including OpenAI, Anthropic, Google (Gemini/Vertex AI), Azure, AWS Bedrock, Mistral, Groq, Ollama, and more. See the full list of supported LLM providers.
Based on which LLM provider you're using with CrewAI, you'll need to install the corresponding OpenInference instrumentor to track LLM-related traces. See the OpenInference documentation for available instrumentors.
For this example using OpenAI:
pip install \
  opentelemetry-api \
  opentelemetry-sdk \
  opentelemetry-exporter-otlp \
  opentelemetry-instrumentation-httpx \
  opentelemetry-instrumentation-system-metrics \
  openinference-instrumentation-crewai \
  openinference-instrumentation-openai \
  crewai \
  crewai-tools
📌 Note: If you're using a different LLM provider (e.g., Anthropic, Bedrock, Mistral), replace
openinference-instrumentation-openaiwith the appropriate instrumentor package such asopeninference-instrumentation-anthropic,openinference-instrumentation-bedrock, etc.
Step 2: Import the necessary modules in your Python application
Traces:
from openinference.instrumentation.crewai import CrewAIInstrumentor
from openinference.instrumentation.openai import OpenAIInstrumentor
from opentelemetry import trace
from opentelemetry.sdk.resources import Resource
from opentelemetry.sdk.trace import TracerProvider
from opentelemetry.sdk.trace.export import BatchSpanProcessor
from opentelemetry.exporter.otlp.proto.http.trace_exporter import OTLPSpanExporter
Logs:
from opentelemetry.sdk._logs import LoggerProvider, LoggingHandler
from opentelemetry.sdk._logs.export import BatchLogRecordProcessor
from opentelemetry.exporter.otlp.proto.http._log_exporter import OTLPLogExporter
from opentelemetry._logs import set_logger_provider
import logging
Metrics:
from opentelemetry.sdk.metrics import MeterProvider
from opentelemetry.exporter.otlp.proto.http.metric_exporter import OTLPMetricExporter
from opentelemetry.sdk.metrics.export import PeriodicExportingMetricReader
from opentelemetry import metrics
from opentelemetry.instrumentation.system_metrics import SystemMetricsInstrumentor
from opentelemetry.instrumentation.httpx import HTTPXClientInstrumentor
Step 3: Set up the OpenTelemetry Tracer Provider to send traces directly to SigNoz Cloud
from opentelemetry.sdk.resources import Resource
from opentelemetry.sdk.trace import TracerProvider
from opentelemetry.sdk.trace.export import BatchSpanProcessor
from opentelemetry.exporter.otlp.proto.http.trace_exporter import OTLPSpanExporter
from opentelemetry import trace
import os

resource = Resource.create({"service.name": "<service_name>"})
provider = TracerProvider(resource=resource)
span_exporter = OTLPSpanExporter(
    endpoint= os.getenv("OTEL_EXPORTER_TRACES_ENDPOINT"),
    headers={"signoz-ingestion-key": os.getenv("SIGNOZ_INGESTION_KEY")},
)
processor = BatchSpanProcessor(span_exporter)
provider.add_span_processor(processor)
trace.set_tracer_provider(provider)
<service_name>is the name of your serviceOTEL_EXPORTER_TRACES_ENDPOINT→ SigNoz Cloud trace endpoint with appropriate region:https://ingest.<region>.signoz.cloud:443/v1/tracesSIGNOZ_INGESTION_KEY→ Your SigNoz ingestion key
Step 4: Instrument Crew AI and your LLM provider using their respective instrumentors with the configured Tracer Provider
from openinference.instrumentation.crewai import CrewAIInstrumentor
from openinference.instrumentation.openai import OpenAIInstrumentor

CrewAIInstrumentor().instrument(tracer_provider=provider)
OpenAIInstrumentor().instrument(tracer_provider=provider)
📌 Important: You must instrument both Crew AI and the LLM provider you're using with Crew AI. In this example, we're using OpenAI, so we instrument both
CrewAIInstrumentorandOpenAIInstrumentor. If you're using a different LLM provider (e.g., Anthropic, Bedrock, Mistral), replaceOpenAIInstrumentorwith the appropriate instrumentor for your provider.📌 Important: Place this code at the start of your application logic — before any Crew AI functions are called or used — to ensure telemetry is correctly captured.
Step 5: Setup Logs
import logging
from opentelemetry.sdk.resources import Resource
from opentelemetry._logs import set_logger_provider
from opentelemetry.sdk._logs import LoggerProvider, LoggingHandler
from opentelemetry.sdk._logs.export import BatchLogRecordProcessor
from opentelemetry.exporter.otlp.proto.http._log_exporter import OTLPLogExporter
import os

resource = Resource.create({"service.name": "<service_name>"})
logger_provider = LoggerProvider(resource=resource)
set_logger_provider(logger_provider)

otlp_log_exporter = OTLPLogExporter(
    endpoint= os.getenv("OTEL_EXPORTER_LOGS_ENDPOINT"),
    headers={"signoz-ingestion-key": os.getenv("SIGNOZ_INGESTION_KEY")},
)
logger_provider.add_log_record_processor(
    BatchLogRecordProcessor(otlp_log_exporter)
)
# Attach OTel logging handler to root logger
handler = LoggingHandler(level=logging.INFO, logger_provider=logger_provider)
logging.basicConfig(level=logging.INFO, handlers=[handler])

logger = logging.getLogger(__name__)
<service_name>is the name of your serviceOTEL_EXPORTER_LOGS_ENDPOINT→ SigNoz Cloud endpoint with appropriate region:https://ingest.<region>.signoz.cloud:443/v1/logsSIGNOZ_INGESTION_KEY→ Your SigNoz ingestion key
Step 6: Setup Metrics
from opentelemetry.sdk.resources import Resource
from opentelemetry.sdk.metrics import MeterProvider
from opentelemetry.exporter.otlp.proto.http.metric_exporter import OTLPMetricExporter
from opentelemetry.sdk.metrics.export import PeriodicExportingMetricReader
from opentelemetry import metrics
from opentelemetry.instrumentation.system_metrics import SystemMetricsInstrumentor
import os

resource = Resource.create({"service.name": "<service-name>"})
metric_exporter = OTLPMetricExporter(
    endpoint= os.getenv("OTEL_EXPORTER_METRICS_ENDPOINT"),
    headers={"signoz-ingestion-key": os.getenv("SIGNOZ_INGESTION_KEY")},
)
reader = PeriodicExportingMetricReader(metric_exporter)
metric_provider = MeterProvider(metric_readers=[reader], resource=resource)
metrics.set_meter_provider(metric_provider)

meter = metrics.get_meter(__name__)

# turn on out-of-the-box metrics
SystemMetricsInstrumentor().instrument()
HTTPXClientInstrumentor().instrument()
<service_name>is the name of your serviceOTEL_EXPORTER_METRICS_ENDPOINT→ SigNoz Cloud endpoint with appropriate region:https://ingest.<region>.signoz.cloud:443/v1/metricsSIGNOZ_INGESTION_KEY→ Your SigNoz ingestion key
📌 Note: SystemMetricsInstrumentor provides system metrics (CPU, memory, etc.), and HTTPXClientInstrumentor provides outbound HTTP request metrics such as request duration. These are not Crew AI-specific metrics. Crew AI does not expose metrics as part of their SDK. If you want to add custom metrics to your Crew AI application, see Python Custom Metrics.
Step 7: Run an example
import os
from crewai import Agent, Task, Crew, Process
from crewai_tools import SerperDevTool

search_tool = SerperDevTool()

# Define your agents with roles and goals
researcher = Agent(
  role='Senior Research Analyst',
  goal='Uncover cutting-edge developments in AI and data science',
  backstory="""You work at a leading tech think tank.
  Your expertise lies in identifying emerging trends.
  You have a knack for dissecting complex data and presenting actionable insights.""",
  verbose=True,
  allow_delegation=False,
  # You can pass an optional llm attribute specifying what model you wanna use.
  # llm=ChatOpenAI(model_name="gpt-3.5", temperature=0.7),
  tools=[search_tool]
)
writer = Agent(
  role='Tech Content Strategist',
  goal='Craft compelling content on tech advancements',
  backstory="""You are a renowned Content Strategist, known for your insightful and engaging articles.
  You transform complex concepts into compelling narratives.""",
  verbose=True,
  allow_delegation=True
)

# Create tasks for your agents
task1 = Task(
  description="""Conduct a comprehensive analysis of the latest advancements in AI in 2024.
  Identify key trends, breakthrough technologies, and potential industry impacts.""",
  expected_output="Full analysis report in bullet points",
  agent=researcher
)

task2 = Task(
  description="""Using the insights provided, develop an engaging blog
  post that highlights the most significant AI advancements.
  Your post should be informative yet accessible, catering to a tech-savvy audience.
  Make it sound cool, avoid complex words so it doesn't sound like AI.""",
  expected_output="Full blog post of at least 4 paragraphs",
  agent=writer
)

# Instantiate your crew with a sequential process
crew = Crew(
  agents=[researcher, writer],
  tasks=[task1, task2],
  verbose=True,
  process=Process.sequential
)

# Get your crew to work!
result = crew.kickoff()

print("######################")
print(result)
📌 Note: Before running this code, ensure that the API key of the specific LLM you are choosing is set as an env variable. In this example, since OpenAI is being used, set
OPENAI_API_KEYwith your working API key. Additionally, for this specific example, you need to create a Serper account, generate an API key, and set it as the environment variableSERPER_API_KEY.
View Traces, Logs, and Metrics in SigNoz
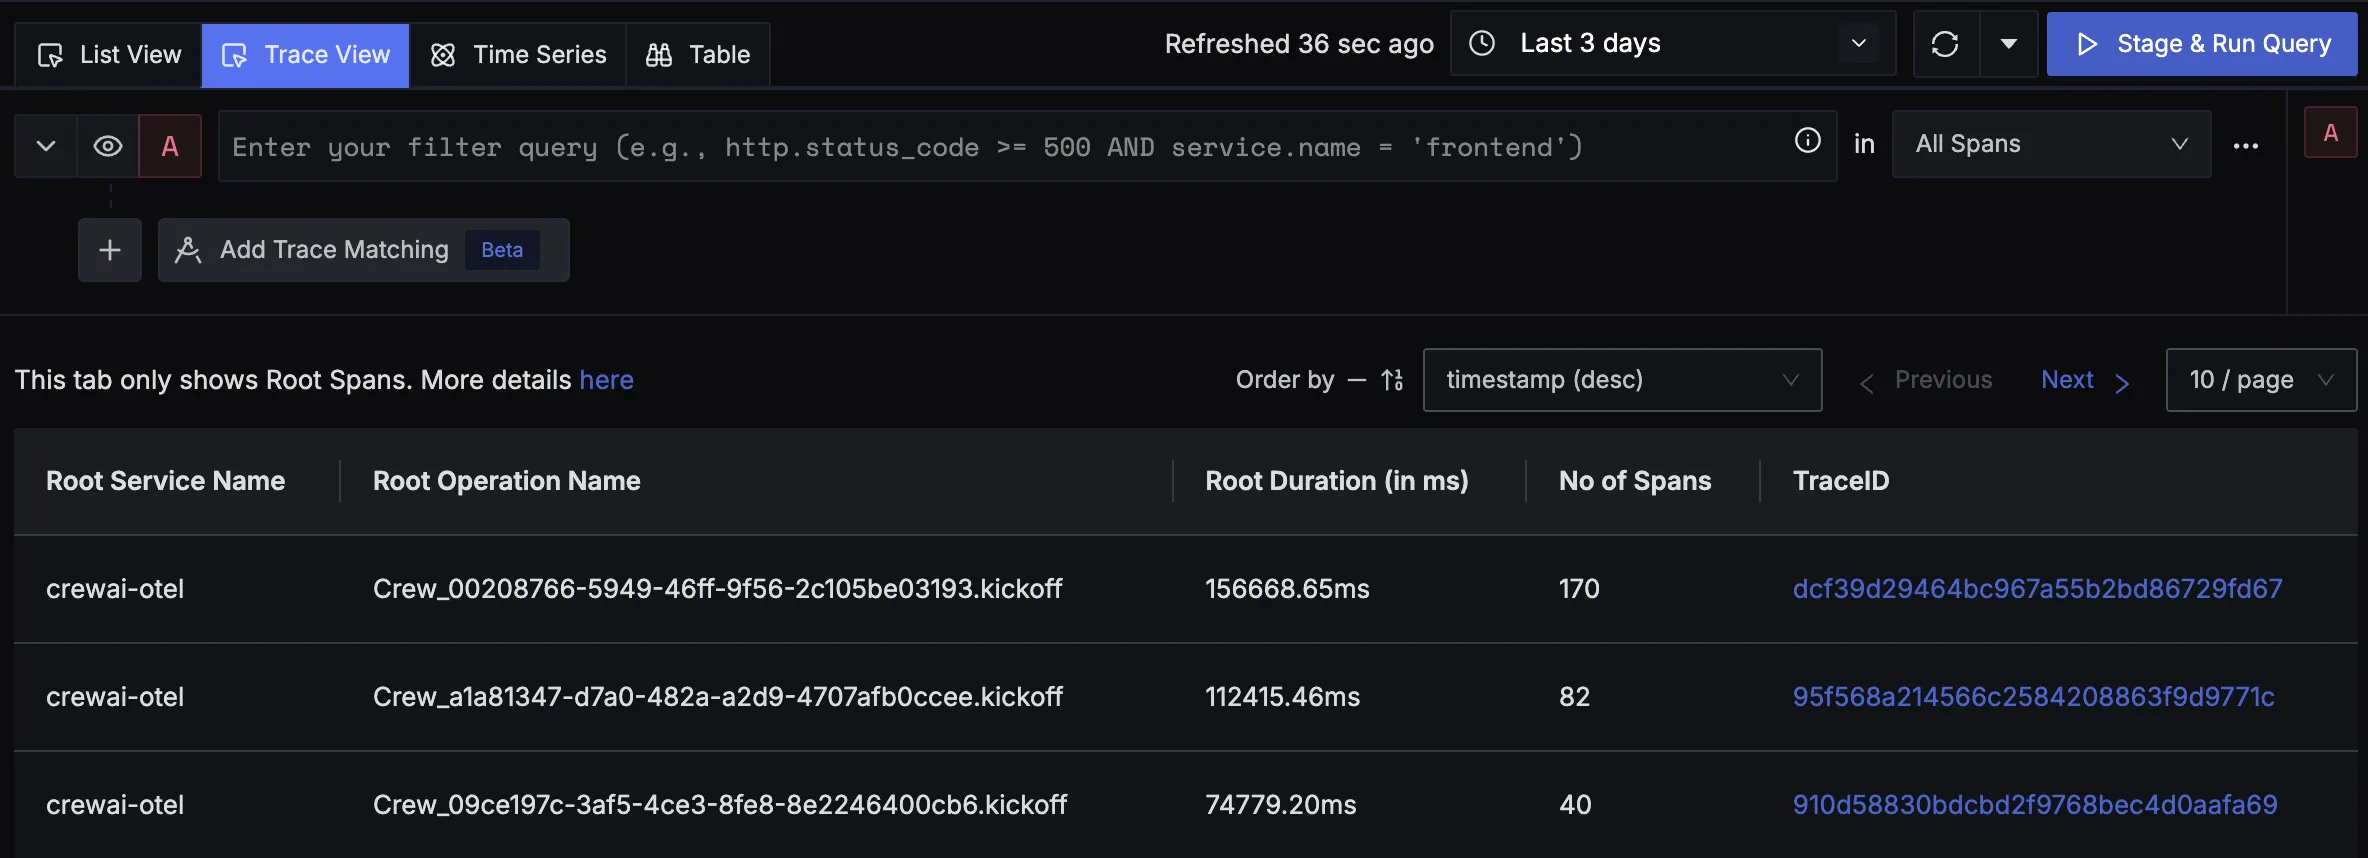
Your Crew AI commands should now automatically emit traces, logs, and metrics.
You should be able to view traces in Signoz Cloud under the traces tab:
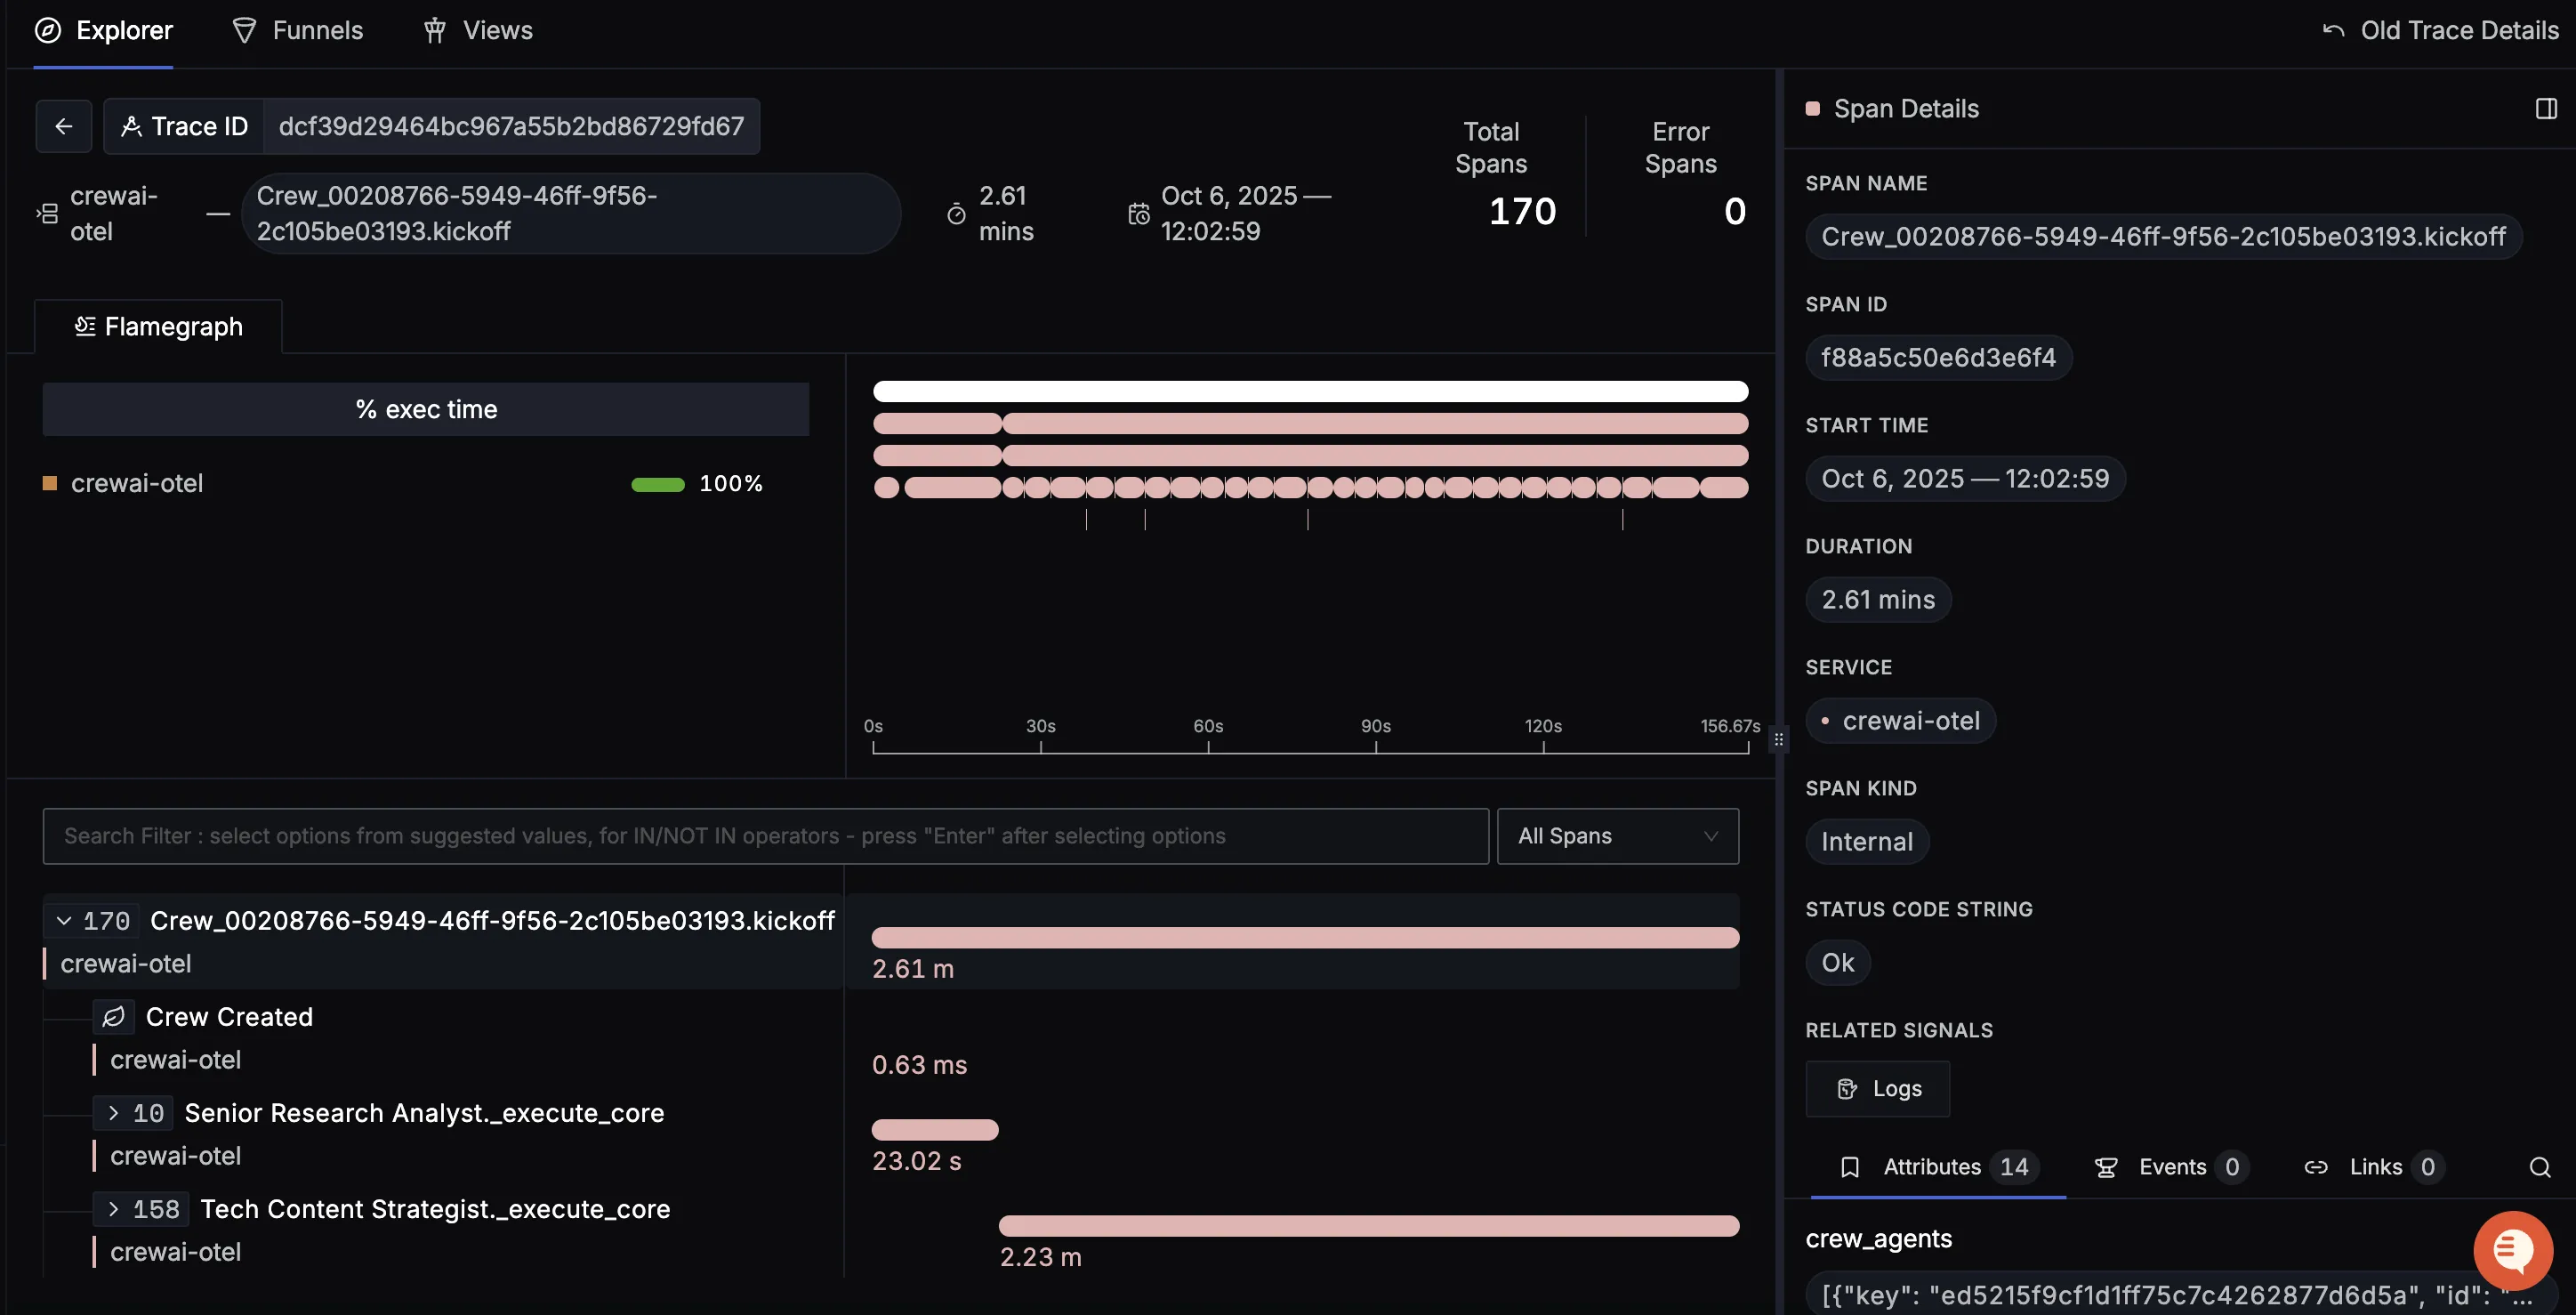
When you click on a trace in SigNoz, you'll see a detailed view of the trace, including all associated spans, along with their events and attributes.
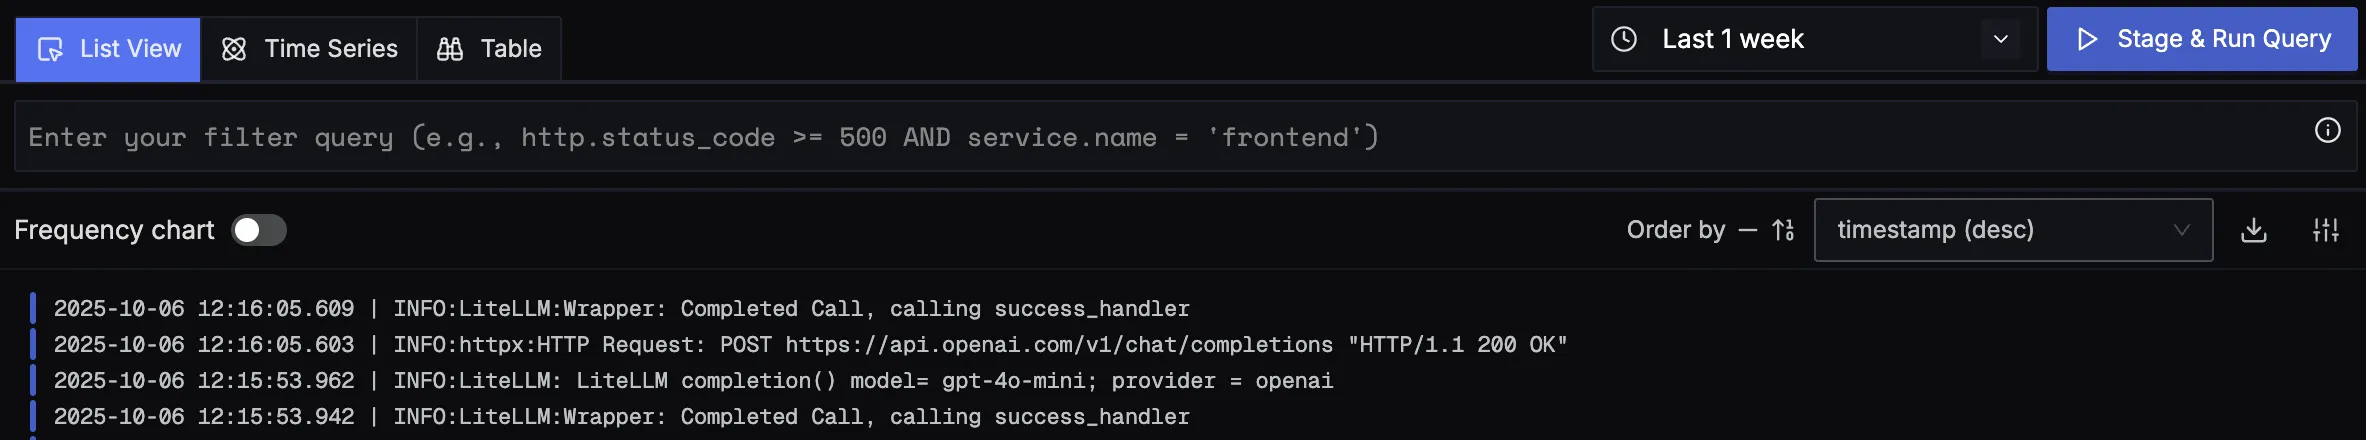
You should be able to view logs in Signoz Cloud under the logs tab. You can also view logs by clicking on the “Related Logs” button in the trace view to see correlated logs:
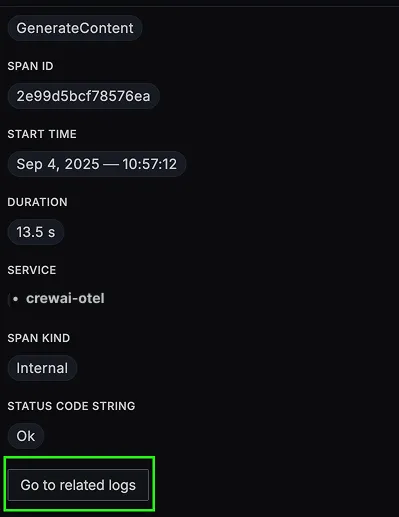
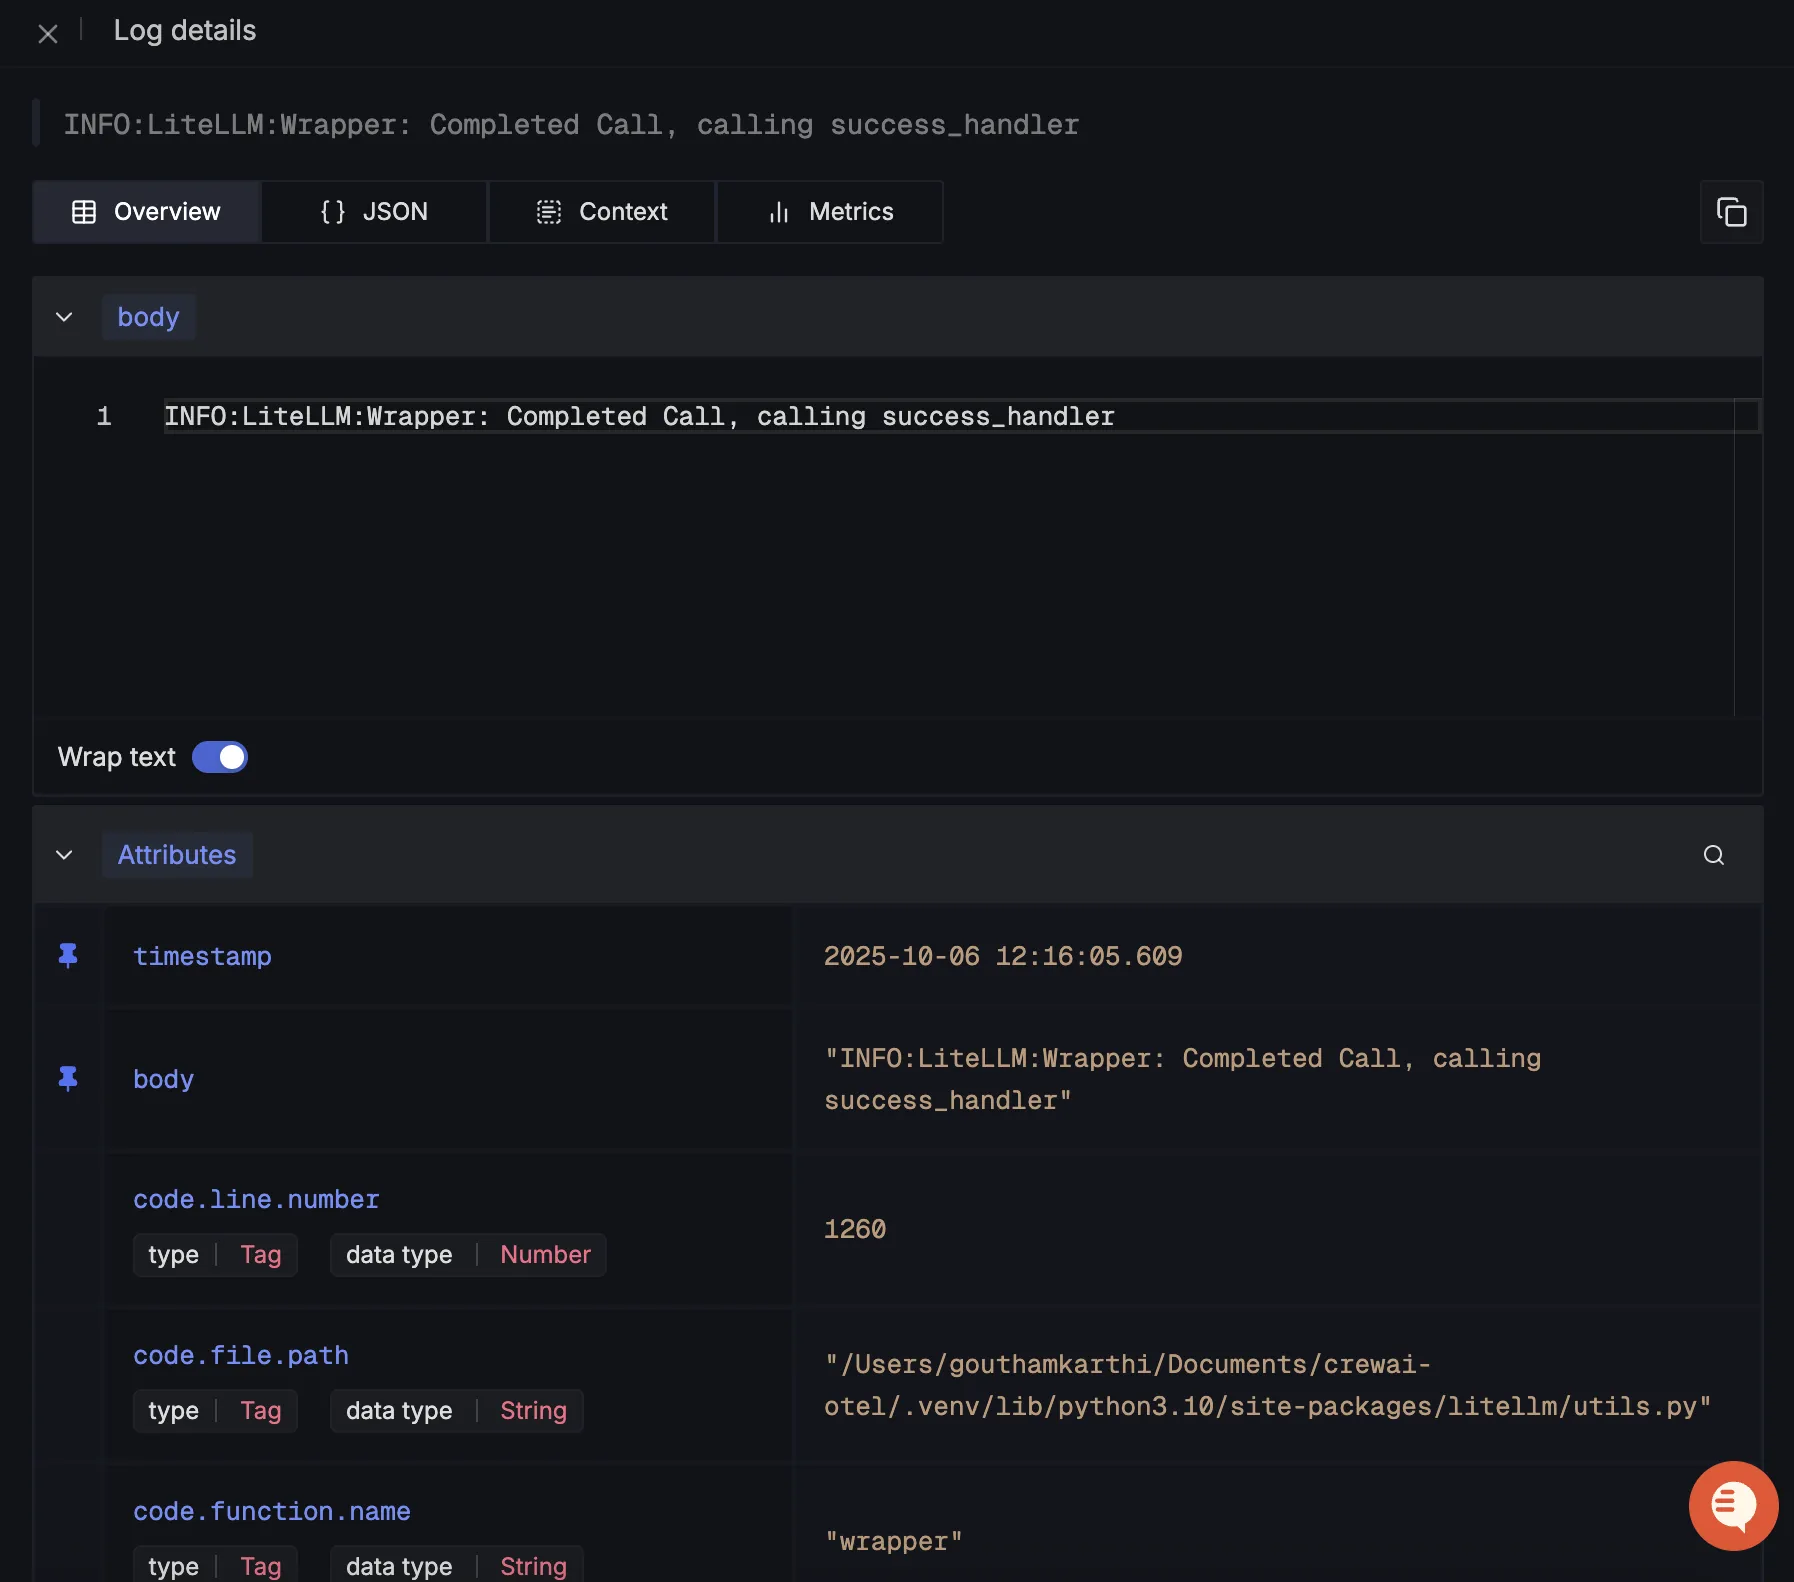
When you click on any of these logs in SigNoz, you'll see a detailed view of the log, including attributes:
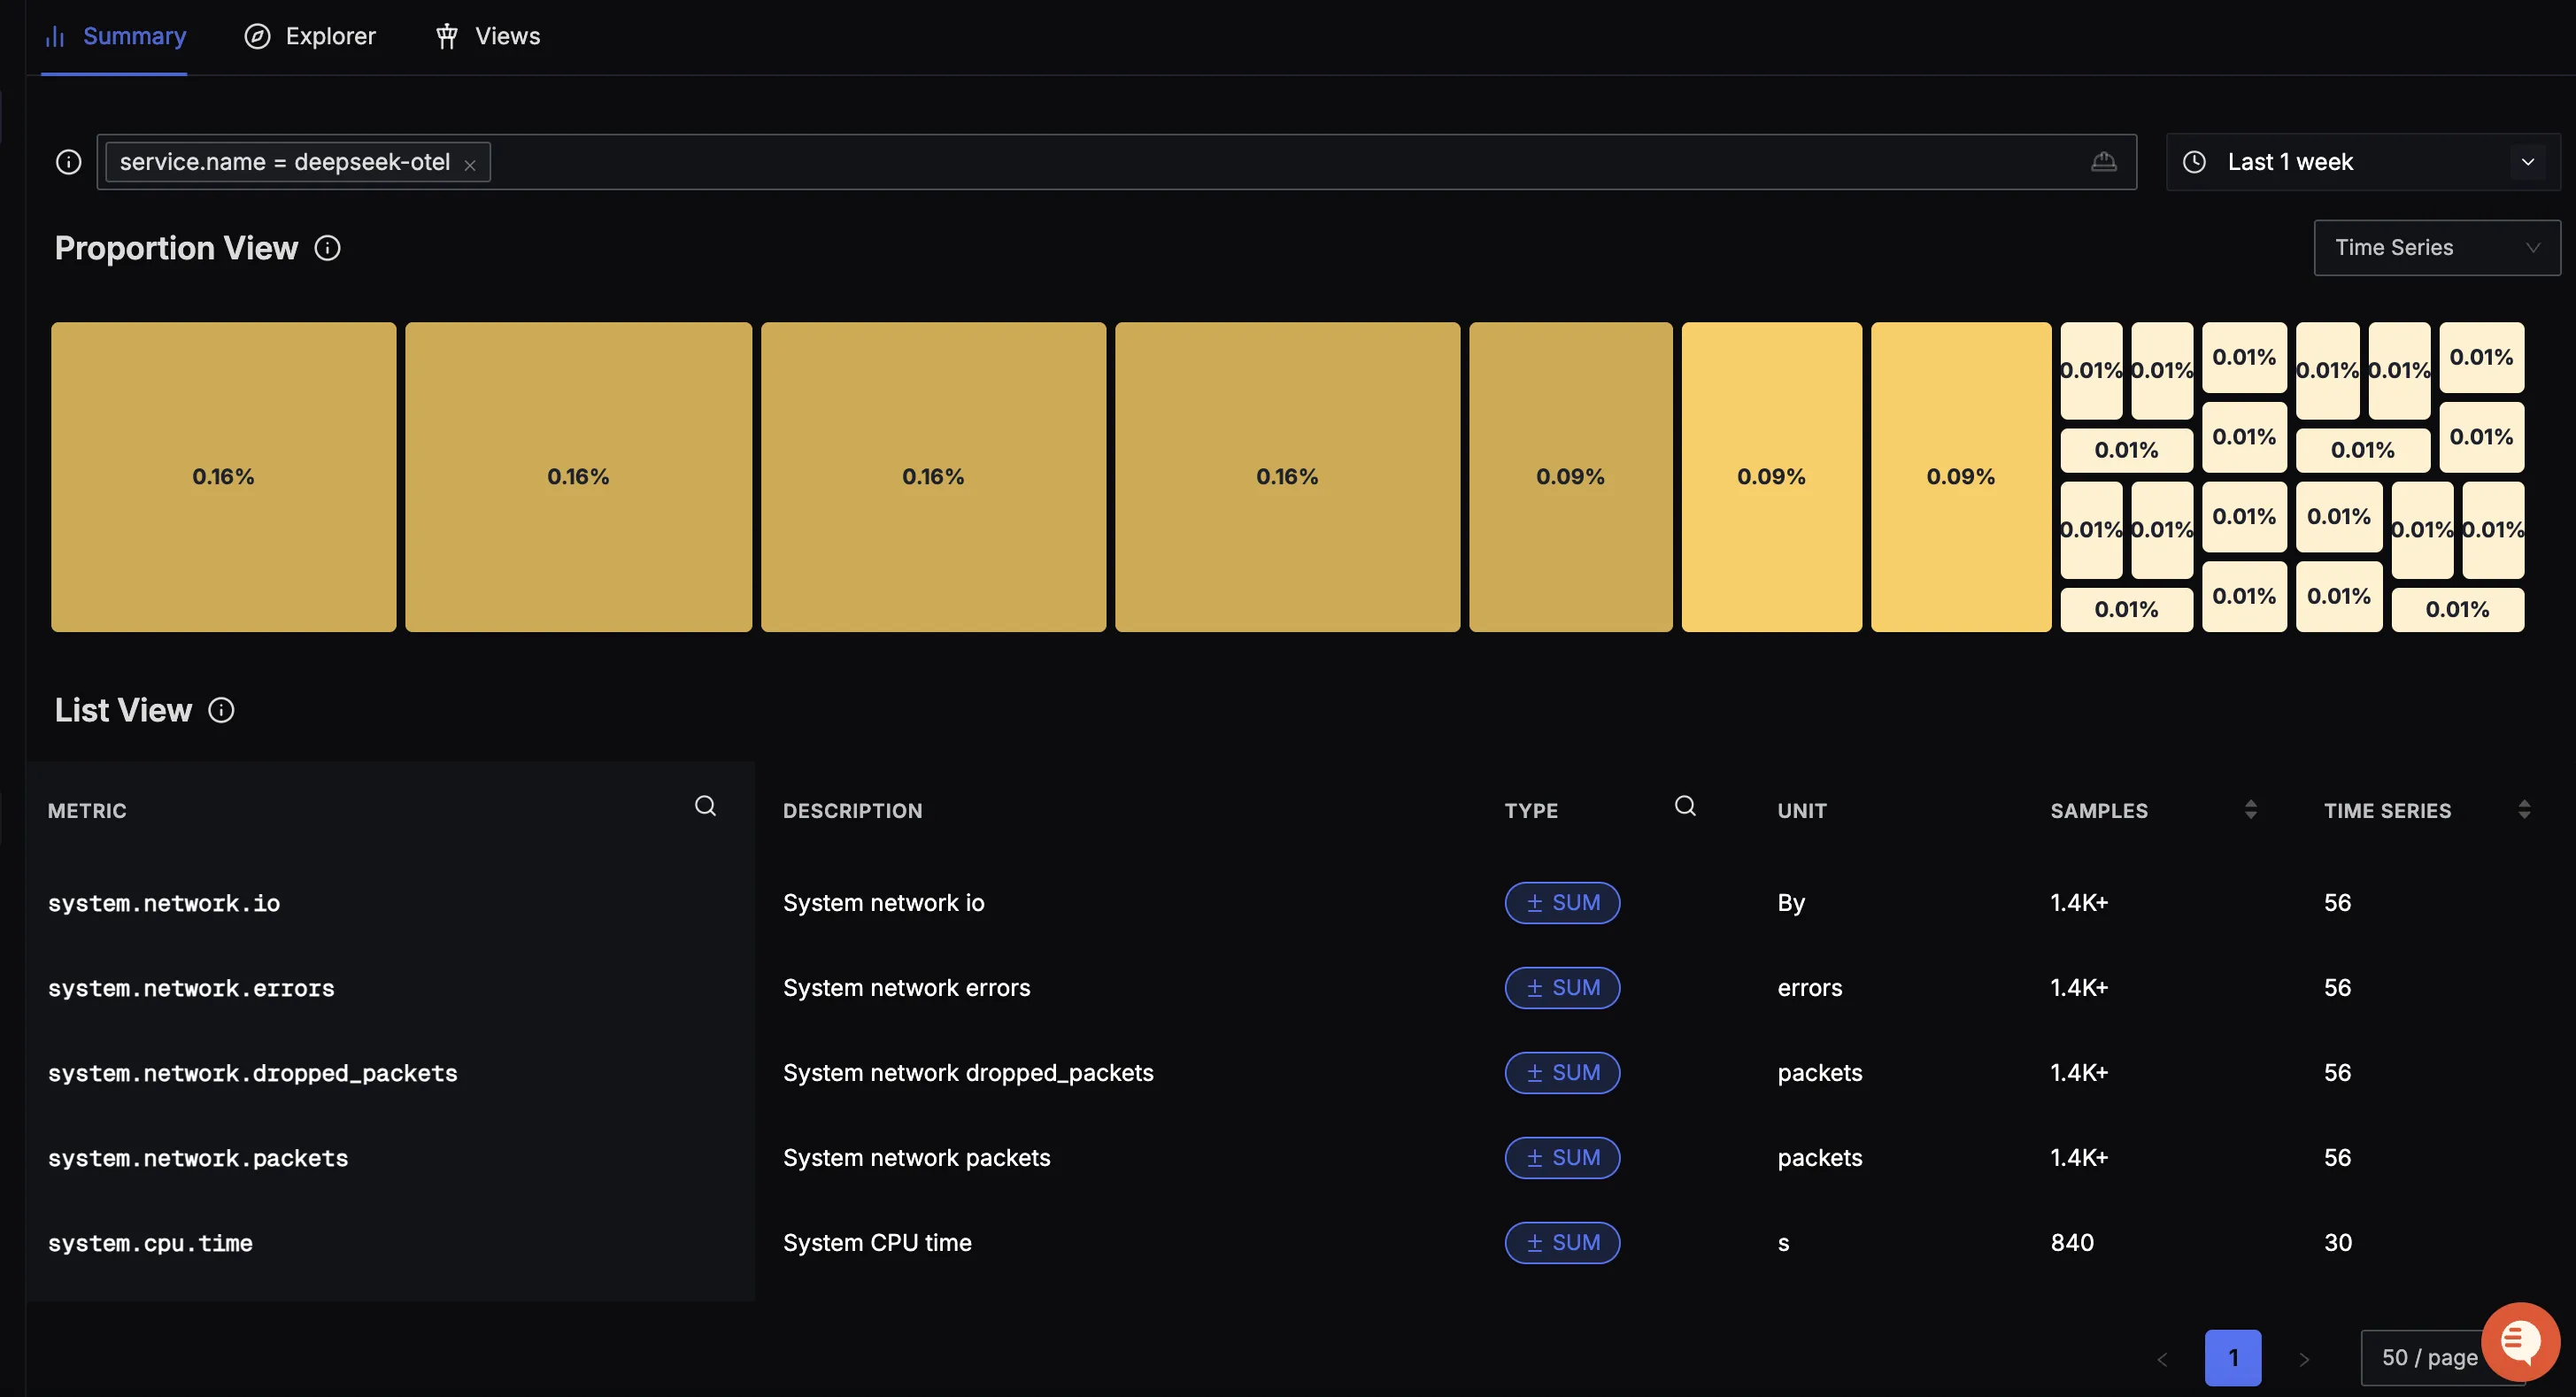
You should be able to see Crew AI related metrics in Signoz Cloud under the metrics tab:
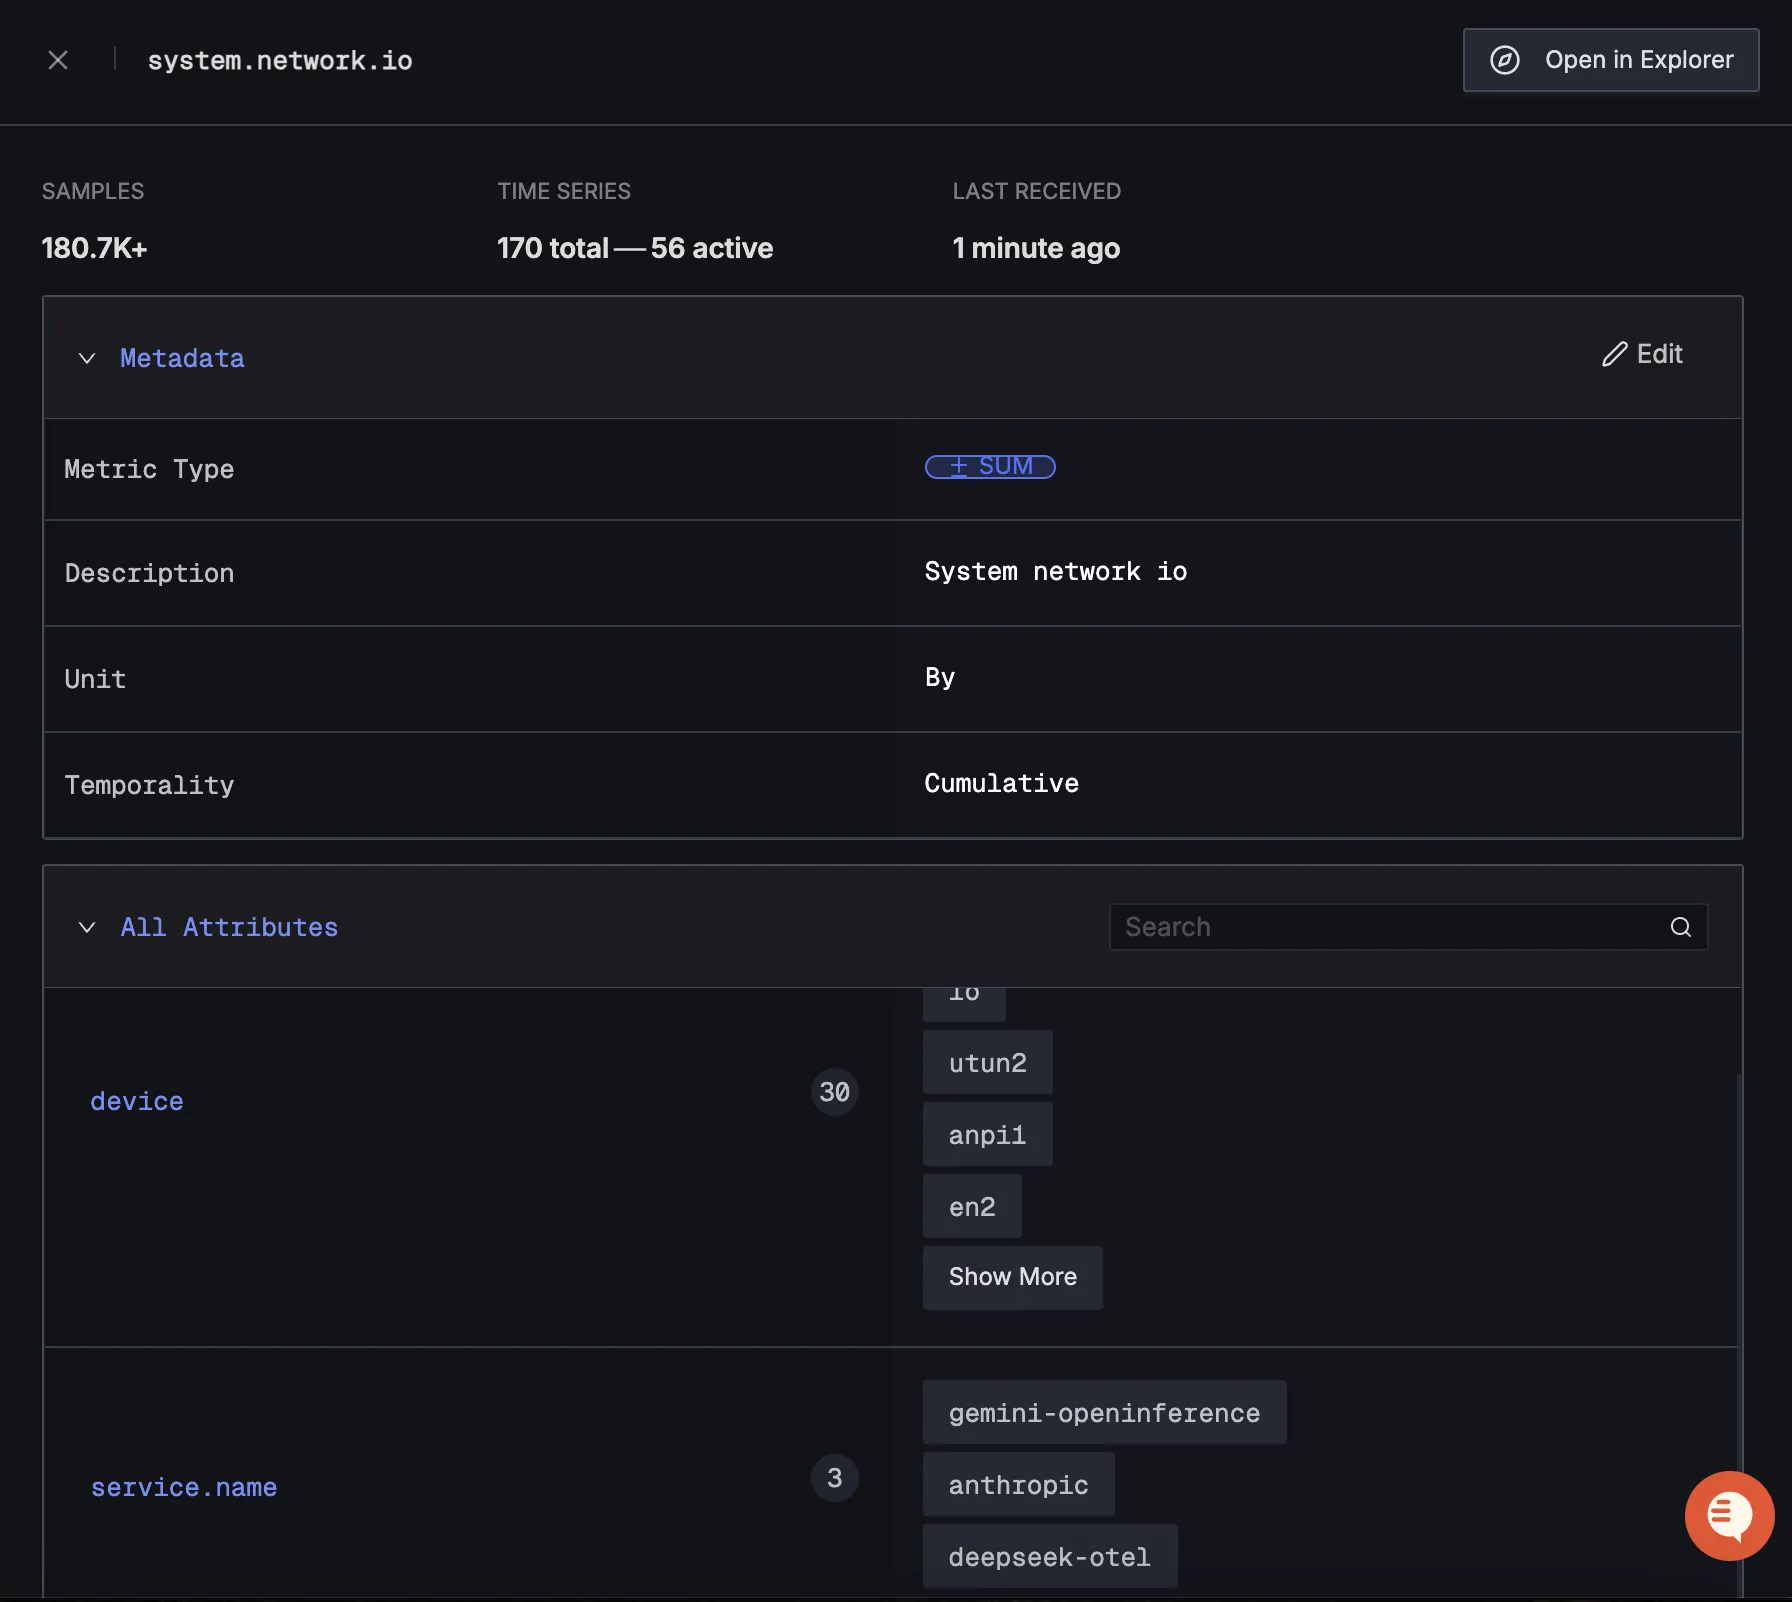
When you click on any of these metrics in SigNoz, you'll see a detailed view of the metric, including attributes:
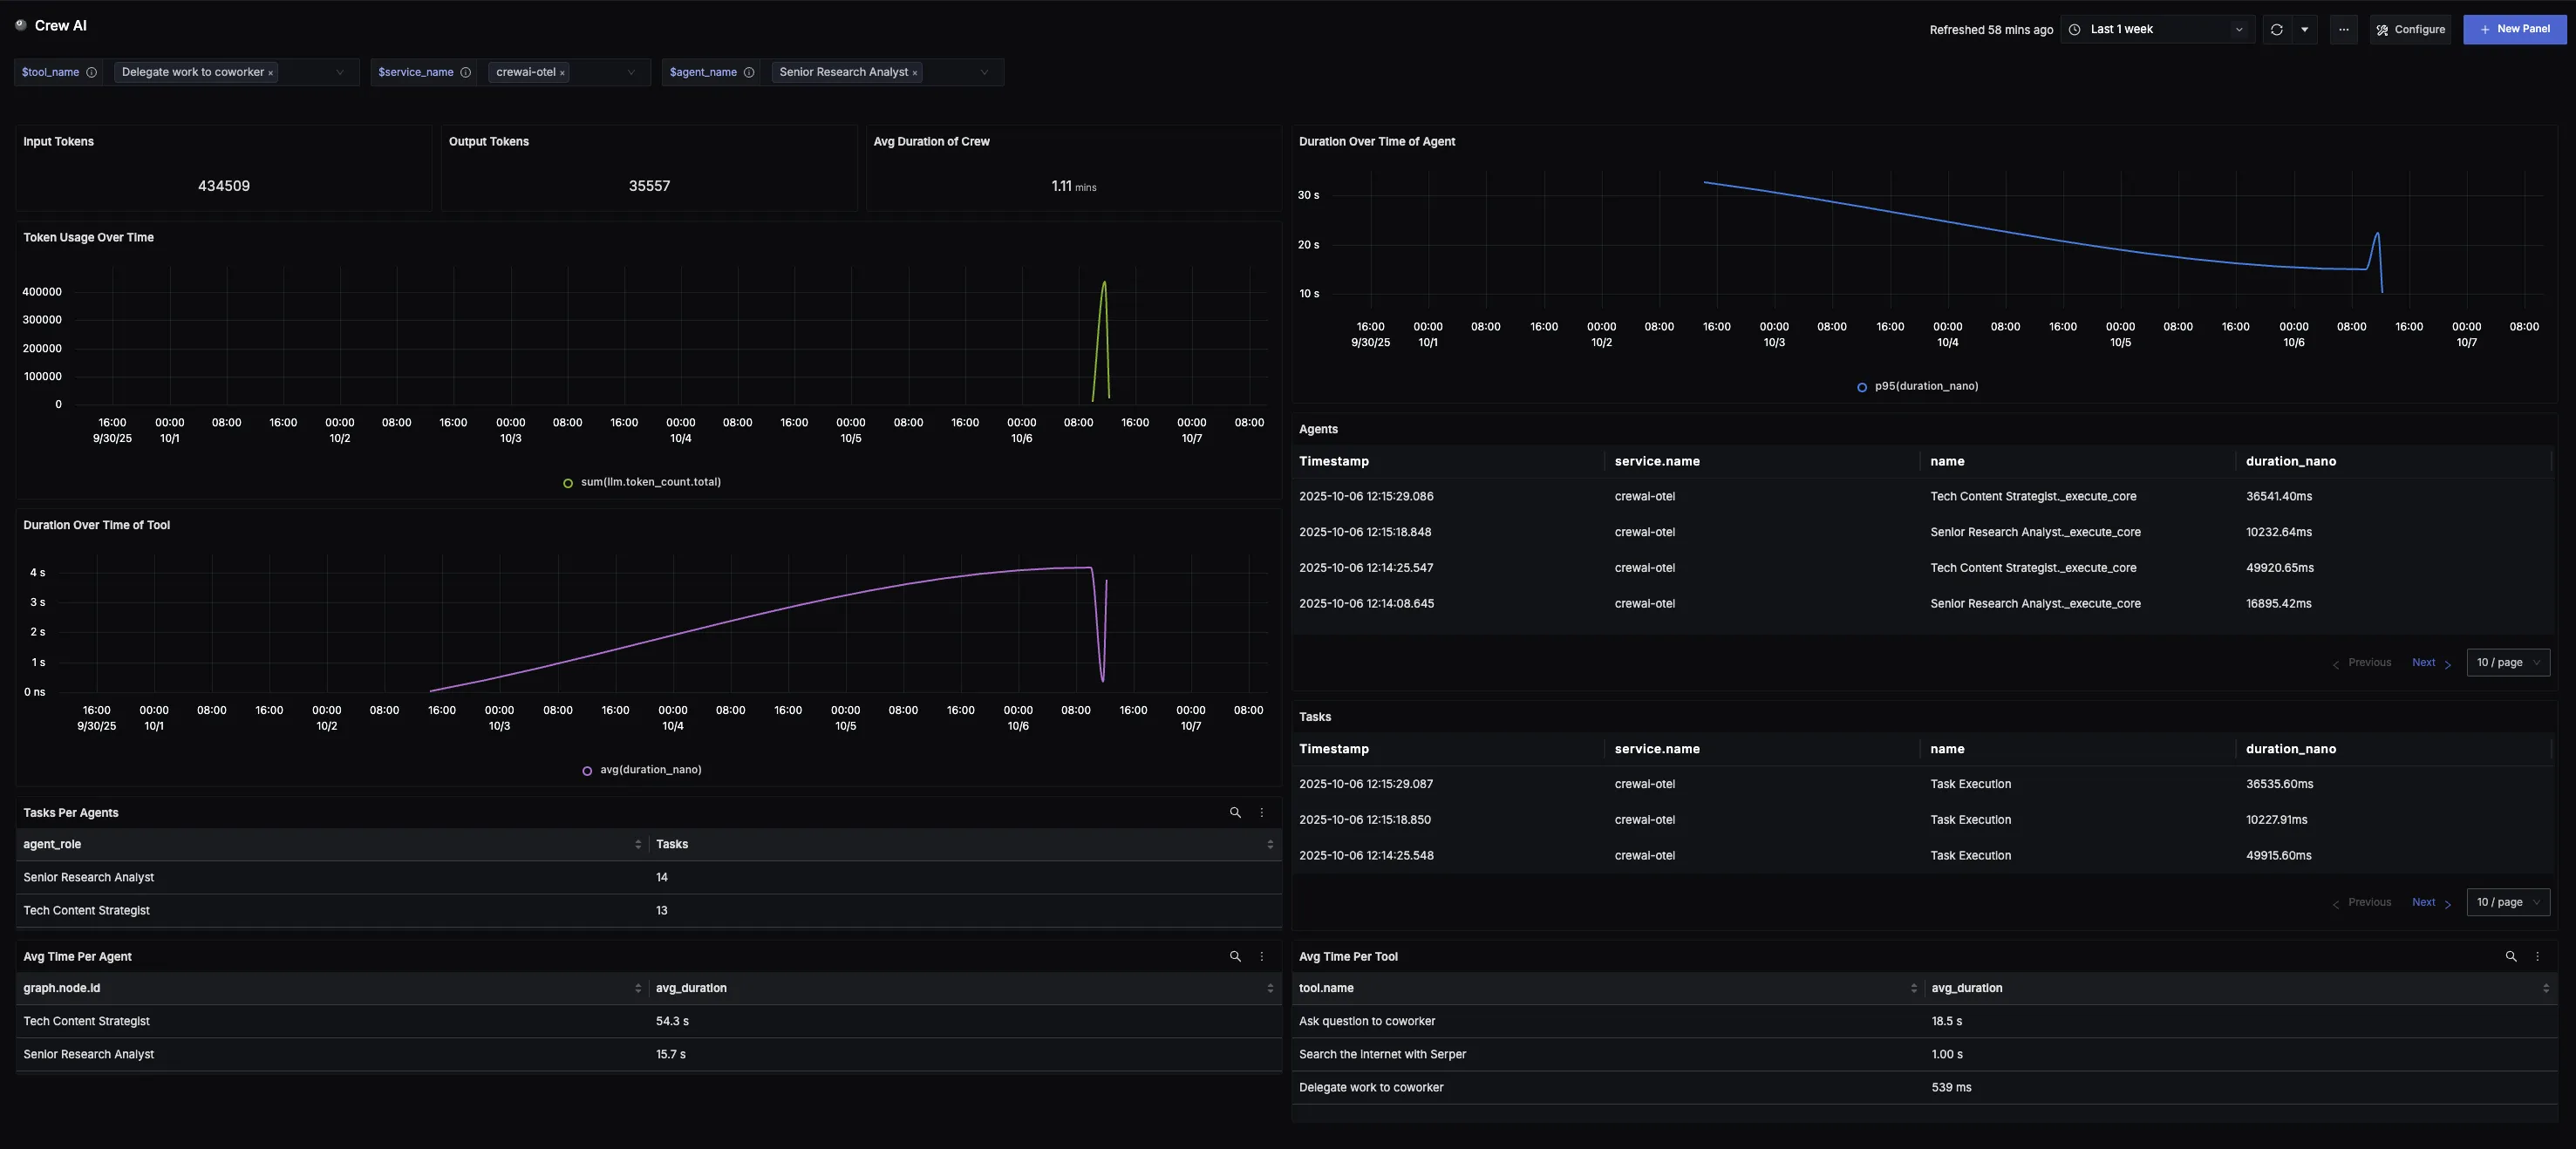
Dashboard
You can also check out our custom Crew AI dashboard here which provides specialized visualizations for monitoring your Crew AI usage in applications. The dashboard includes pre-built charts specifically tailored for Crew AI usage, along with import instructions to get started quickly.