This dashboard provides comprehensive monitoring of Apache HTTP Server performance and resource utilization, offering detailed visibility into request processing, CPU load, worker thread management, traffic patterns, and overall server health for optimal web server performance.
📝 Note
To use this dashboard, you need to configure the apache receiver. Follow the OpenTelemetry Receivers guide to get started.
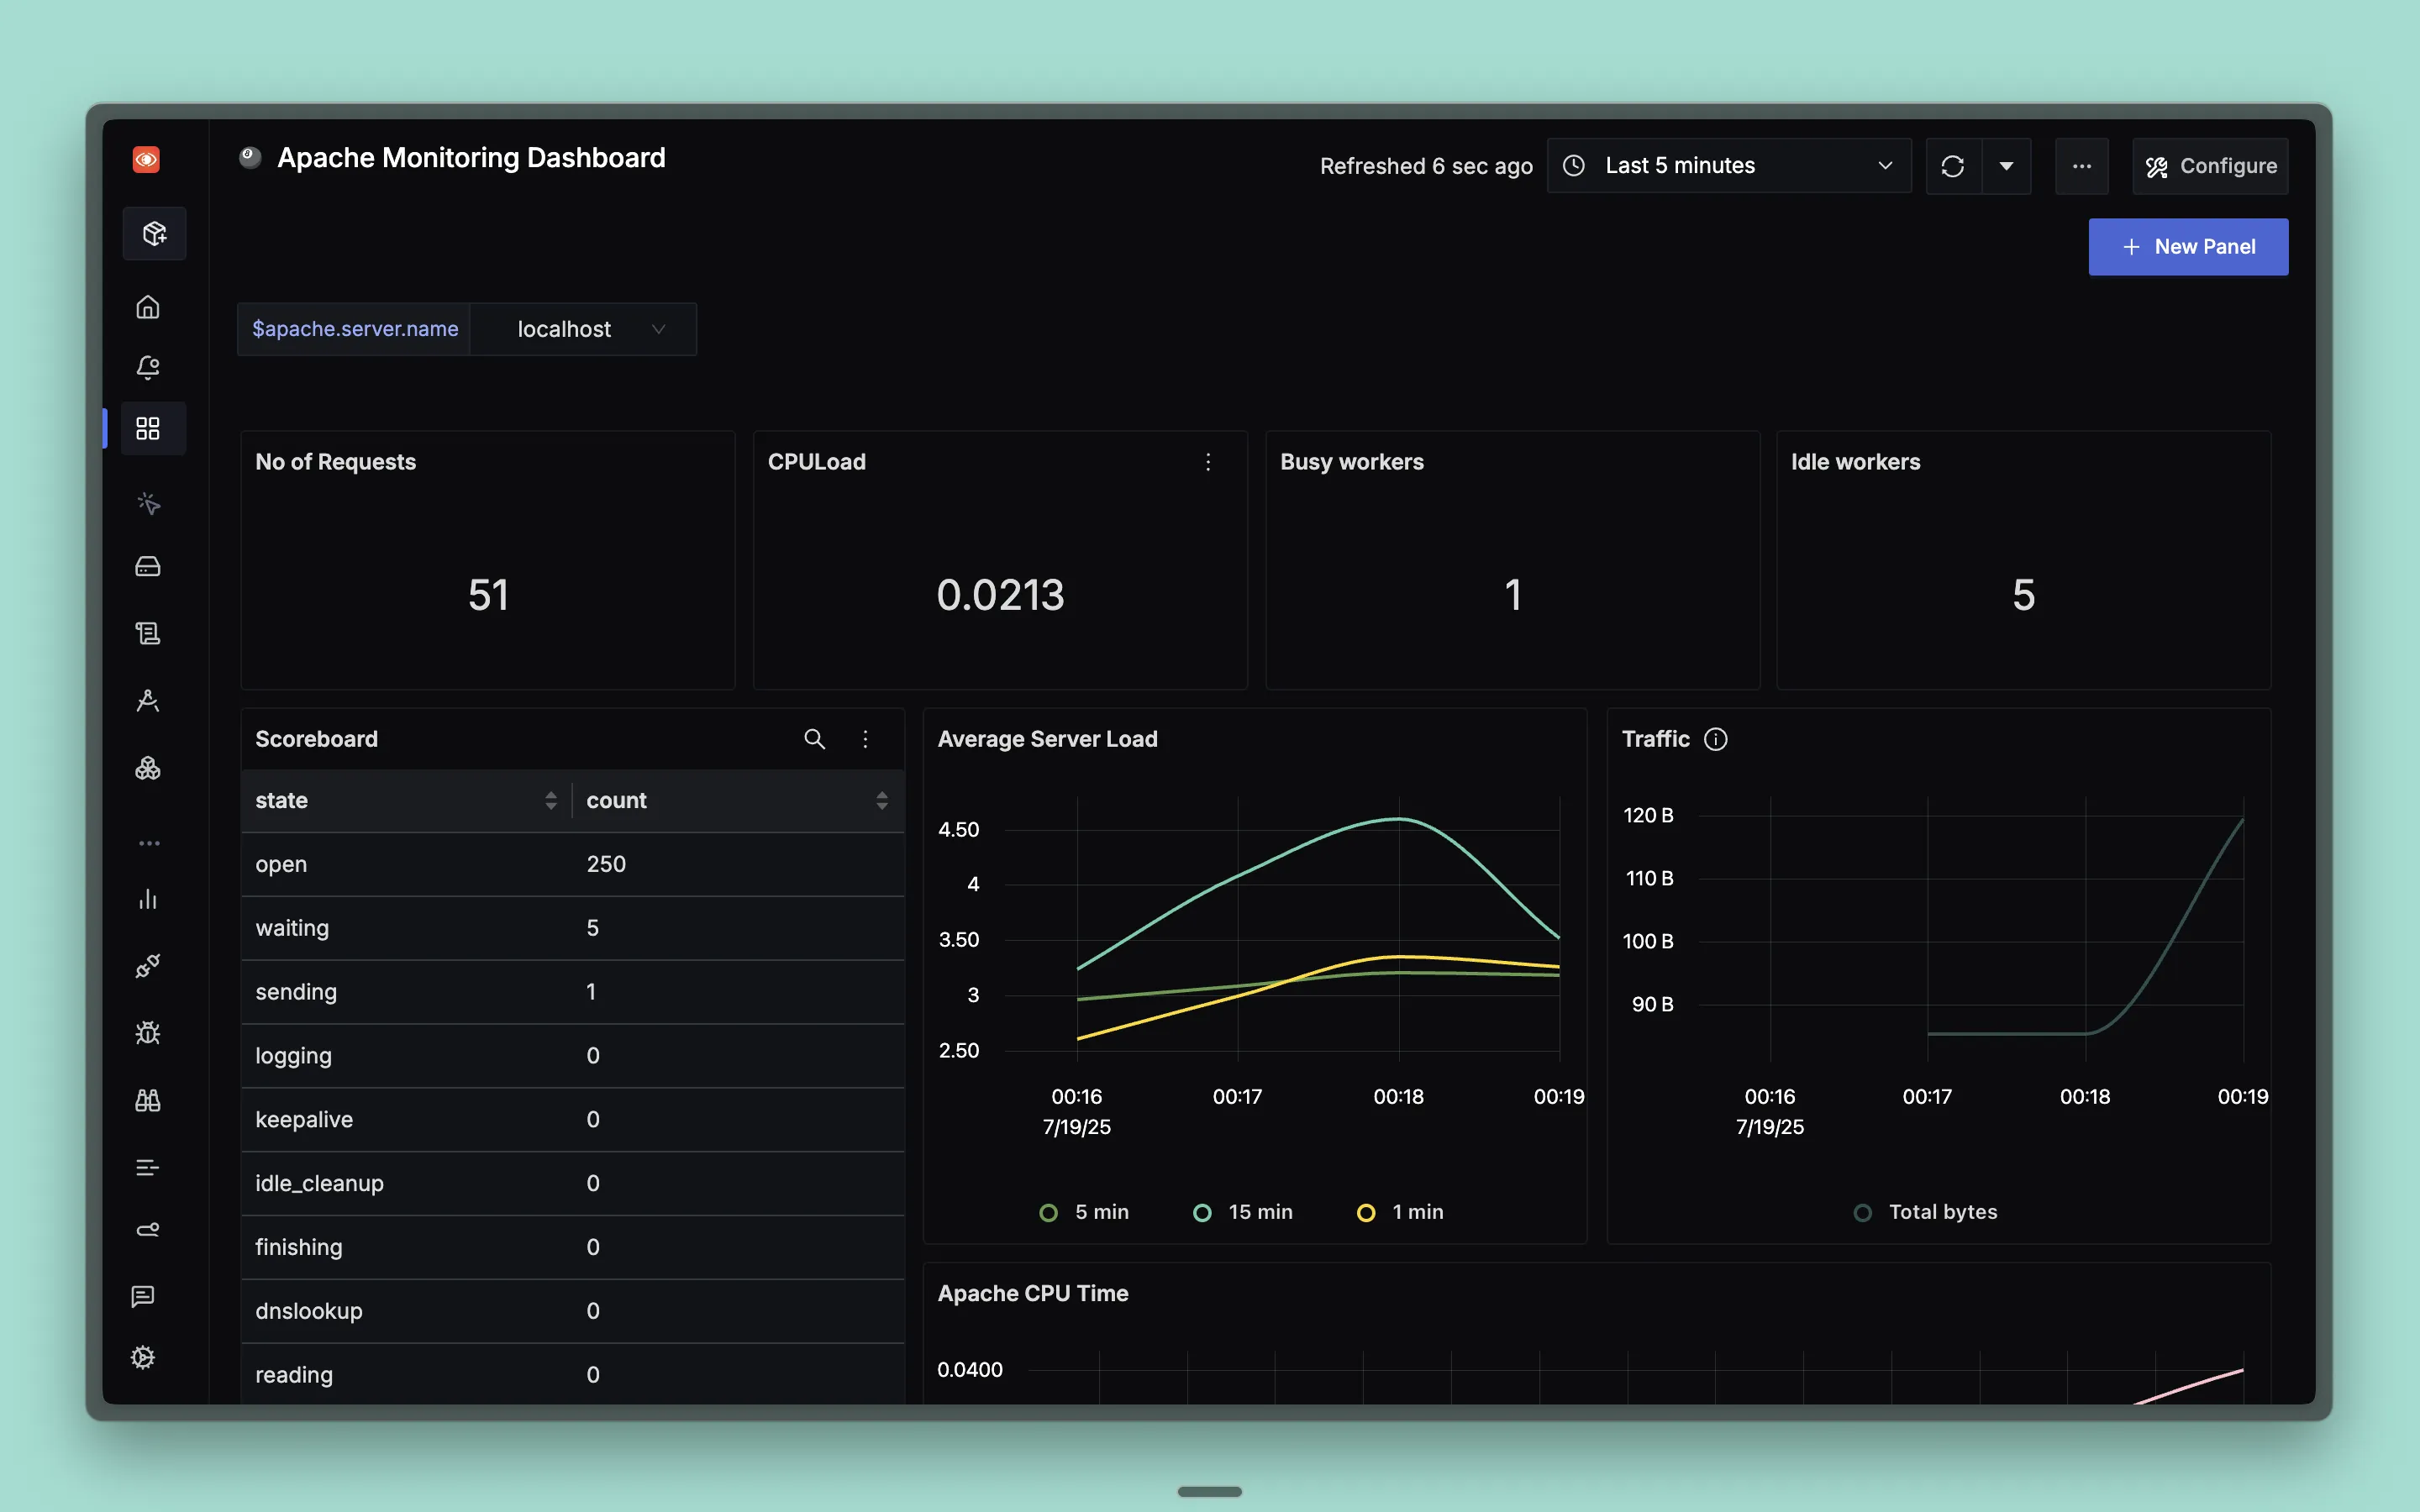
Dashboard Preview
Dashboards → + New dashboard → Import JSON
What This Dashboard Monitors
This dashboard tracks essential Apache HTTP Server metrics to help you:
- Monitor Request Handling: Track request volume and processing patterns
- Analyze CPU Performance: Monitor CPU load and processing time
- Track Worker Processes: Monitor busy and idle worker states
- Analyze Traffic Patterns: Monitor data transfer and bandwidth usage
- Server Load Monitoring: Track system load averages over different time periods
- Performance Optimization: Identify bottlenecks and optimize server configuration
- Resource Management: Monitor worker thread utilization and efficiency
Metrics Included
Overview Metrics
- No of Requests: Shows total number of requests processed
- CPULoad: Shows current CPU load percentage
- Busy workers: Shows number of busy worker processes
- Idle workers: Shows number of idle worker processes
Performance Metrics
- Apache CPU Load: Shows minimum and maximum CPU load over time
- Apache CPU Time: Shows CPU time consumption grouped by mode and level
- Average Server Load: Shows system load averages for 1, 5, and 15-minute intervals
Traffic Metrics
- Traffic: Shows total HTTP server traffic in bytes over time
- Concurrency Efficiency: Average Workers vs. Requests: Shows relationship between worker processes and request volume
Worker State Metrics
- Scoreboard: Shows detailed breakdown of worker process states including:
- open: Available slots
- waiting: Waiting for connection
- sending: Sending reply
- starting: Starting up
- keepalive: Keep-alive connections
- finishing: Gracefully finishing
- reading: Reading request
- dnslookup: DNS lookup
- idle_cleanup: Idle cleanup
- logging: Logging
Dashboard Variables
This dashboard includes pre-configured variables for filtering:
- apache.server.name: Filter by specific Apache server name (default: localhost)
