
This dashboard provides comprehensive monitoring of CouchDB database performance and resource utilization, offering detailed visibility into HTTP request patterns, response times, database operations, and system resource usage for optimal NoSQL database management.
To use this dashboard, you need to configure the couchdb receiver. Follow the OpenTelemetry Receivers guide to get started.
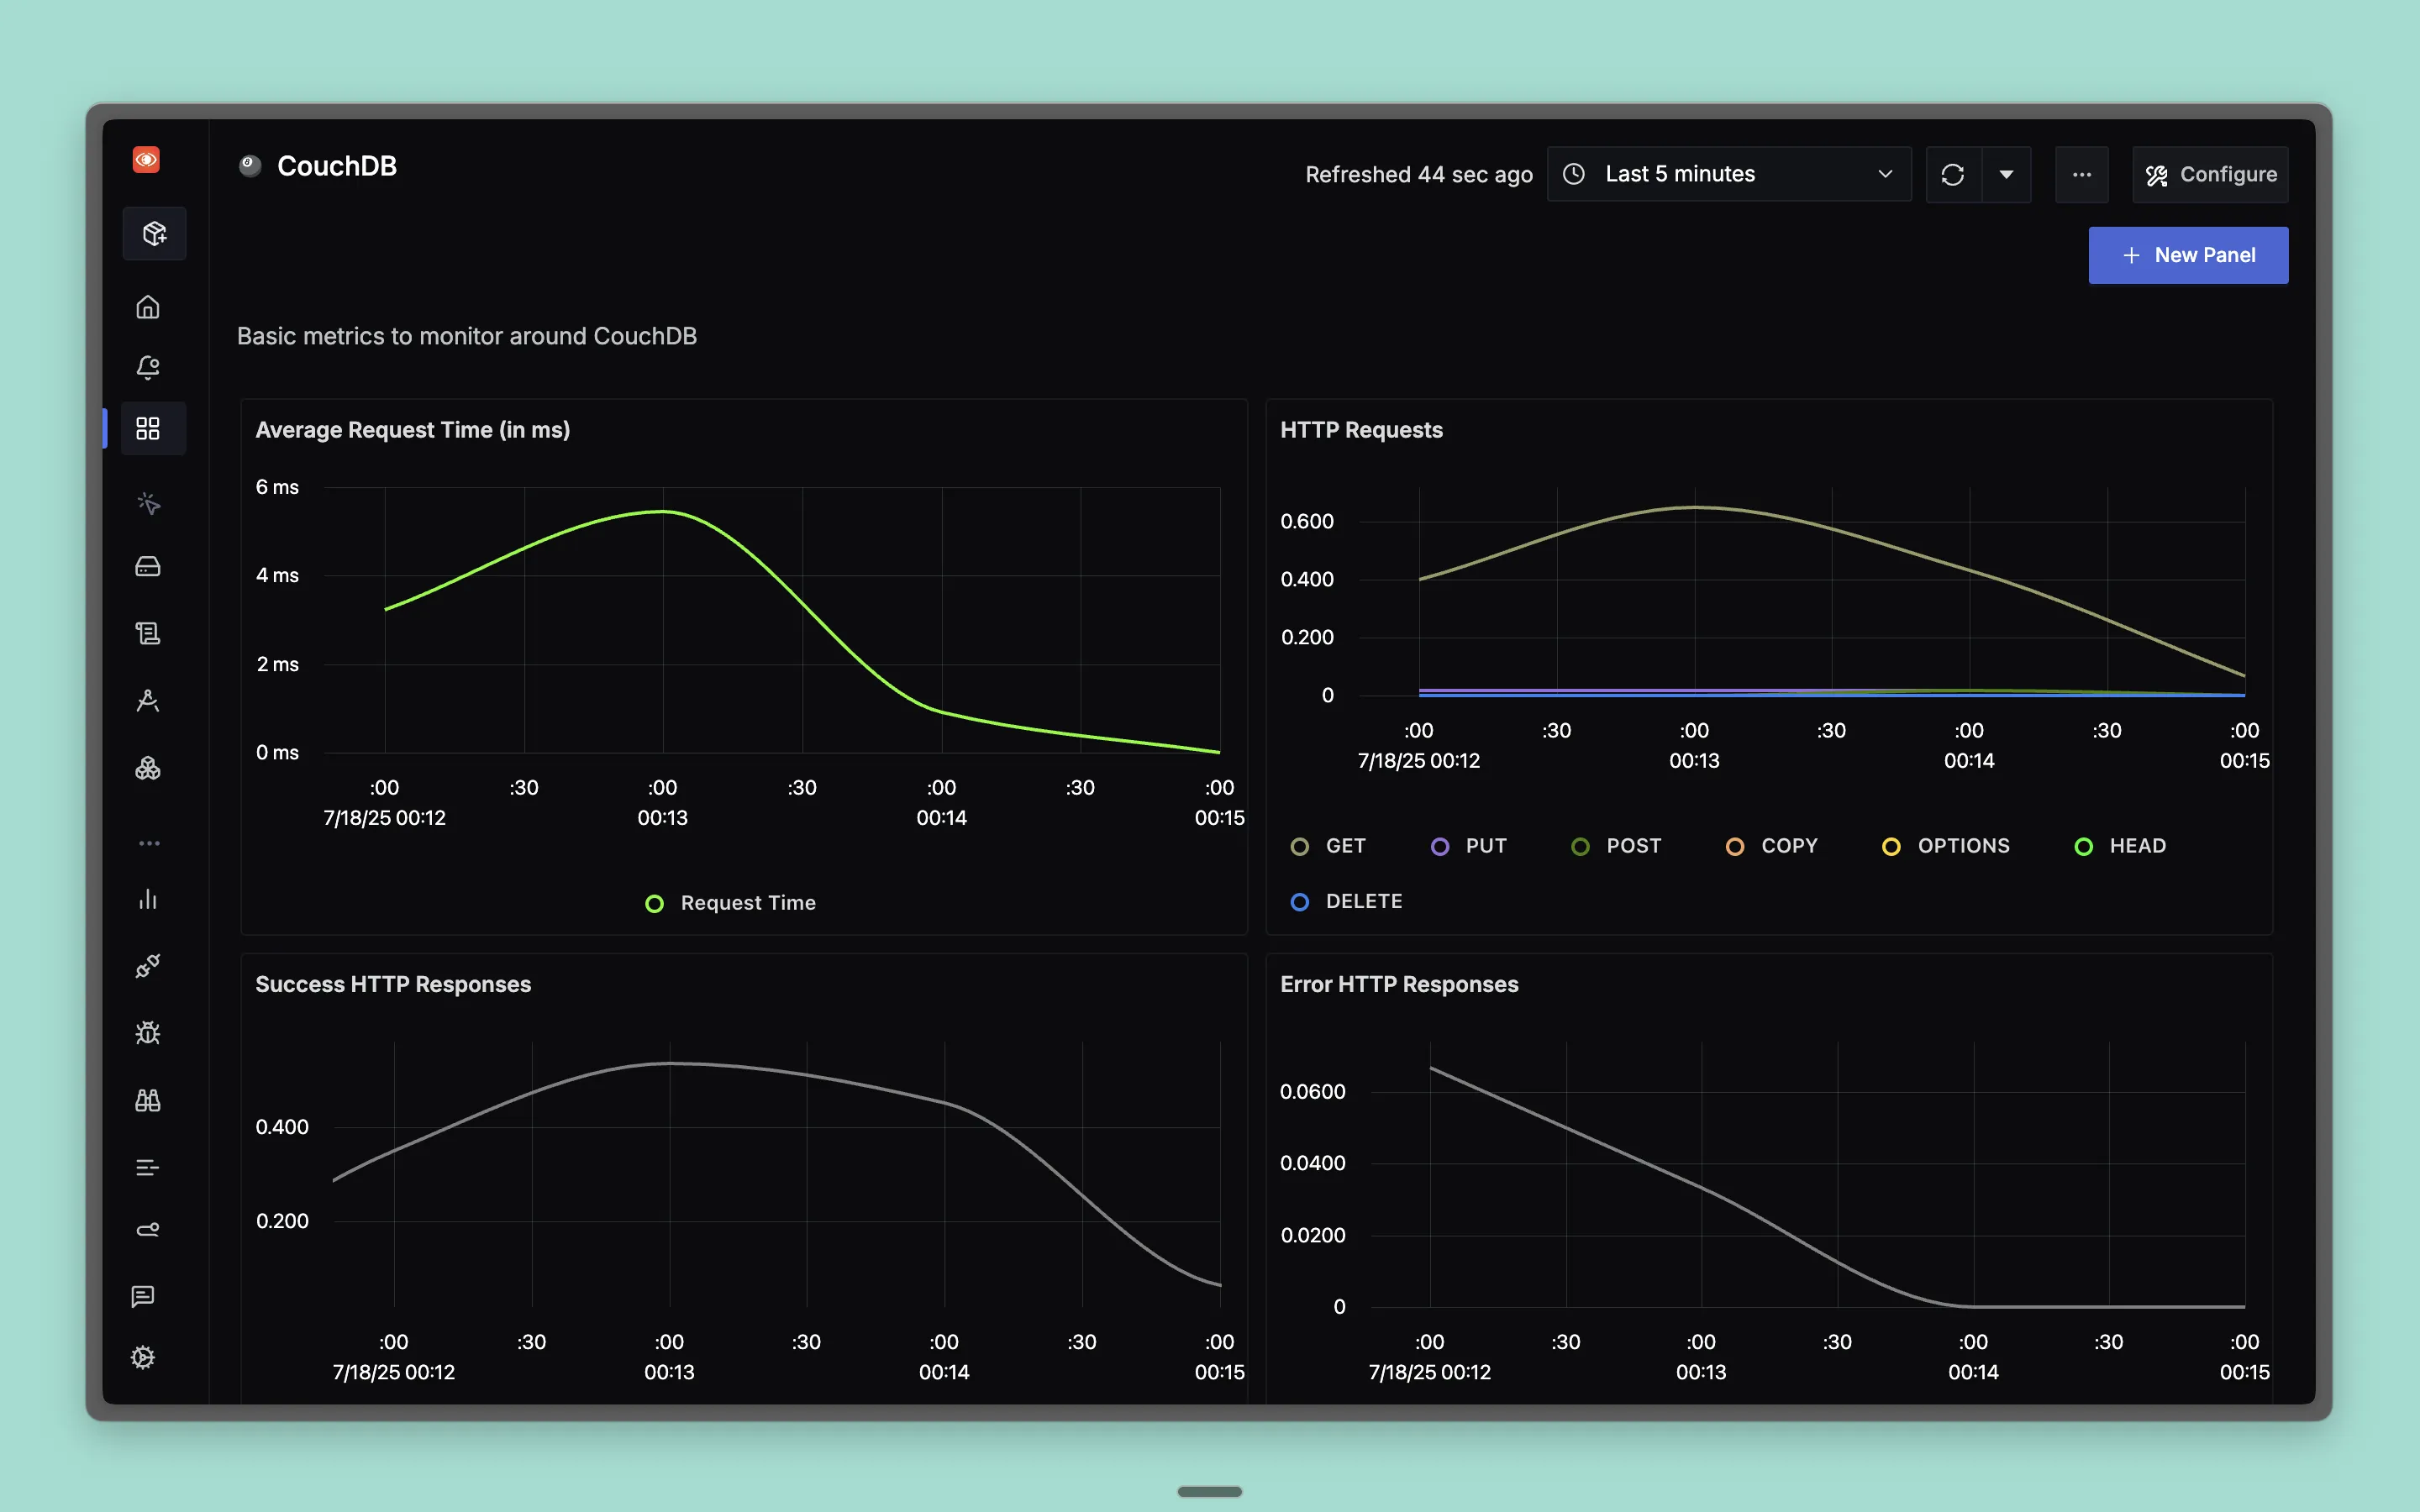
Dashboard Preview
Dashboards → + New dashboard → Import JSON
What This Dashboard Monitors
This dashboard tracks essential CouchDB metrics to help you:
- Monitor Request Performance: Track HTTP request patterns and response times
- Analyze HTTP Traffic: Monitor different HTTP methods and their usage patterns
- Track Response Status: Analyze success and error response rates
- Monitor Database Operations: Track read and write operations performance
- Resource Utilization: Monitor open databases and file descriptors
- Performance Optimization: Identify bottlenecks and optimize database operations
Metrics Included
Performance Metrics
- Average Request Time: Shows average HTTP request response time in milliseconds over time
HTTP Traffic Metrics
- HTTP Requests: Shows HTTP request rate grouped by HTTP method (GET, PUT, POST, HEAD, DELETE, COPY, OPTIONS) over time
- Success HTTP Responses: Shows successful HTTP response rate (2xx status codes) grouped by HTTP method over time
- Error HTTP Responses: Shows error HTTP response rate (non-2xx status codes) grouped by HTTP method over time
Database Operation Metrics
- Operations (Reads/Writes): Shows database operation rates grouped by operation type (reads, writes) over time
Resource Metrics
- Open Databases: Shows current number of open databases
- Opened File Descriptors: Shows current number of opened file descriptors