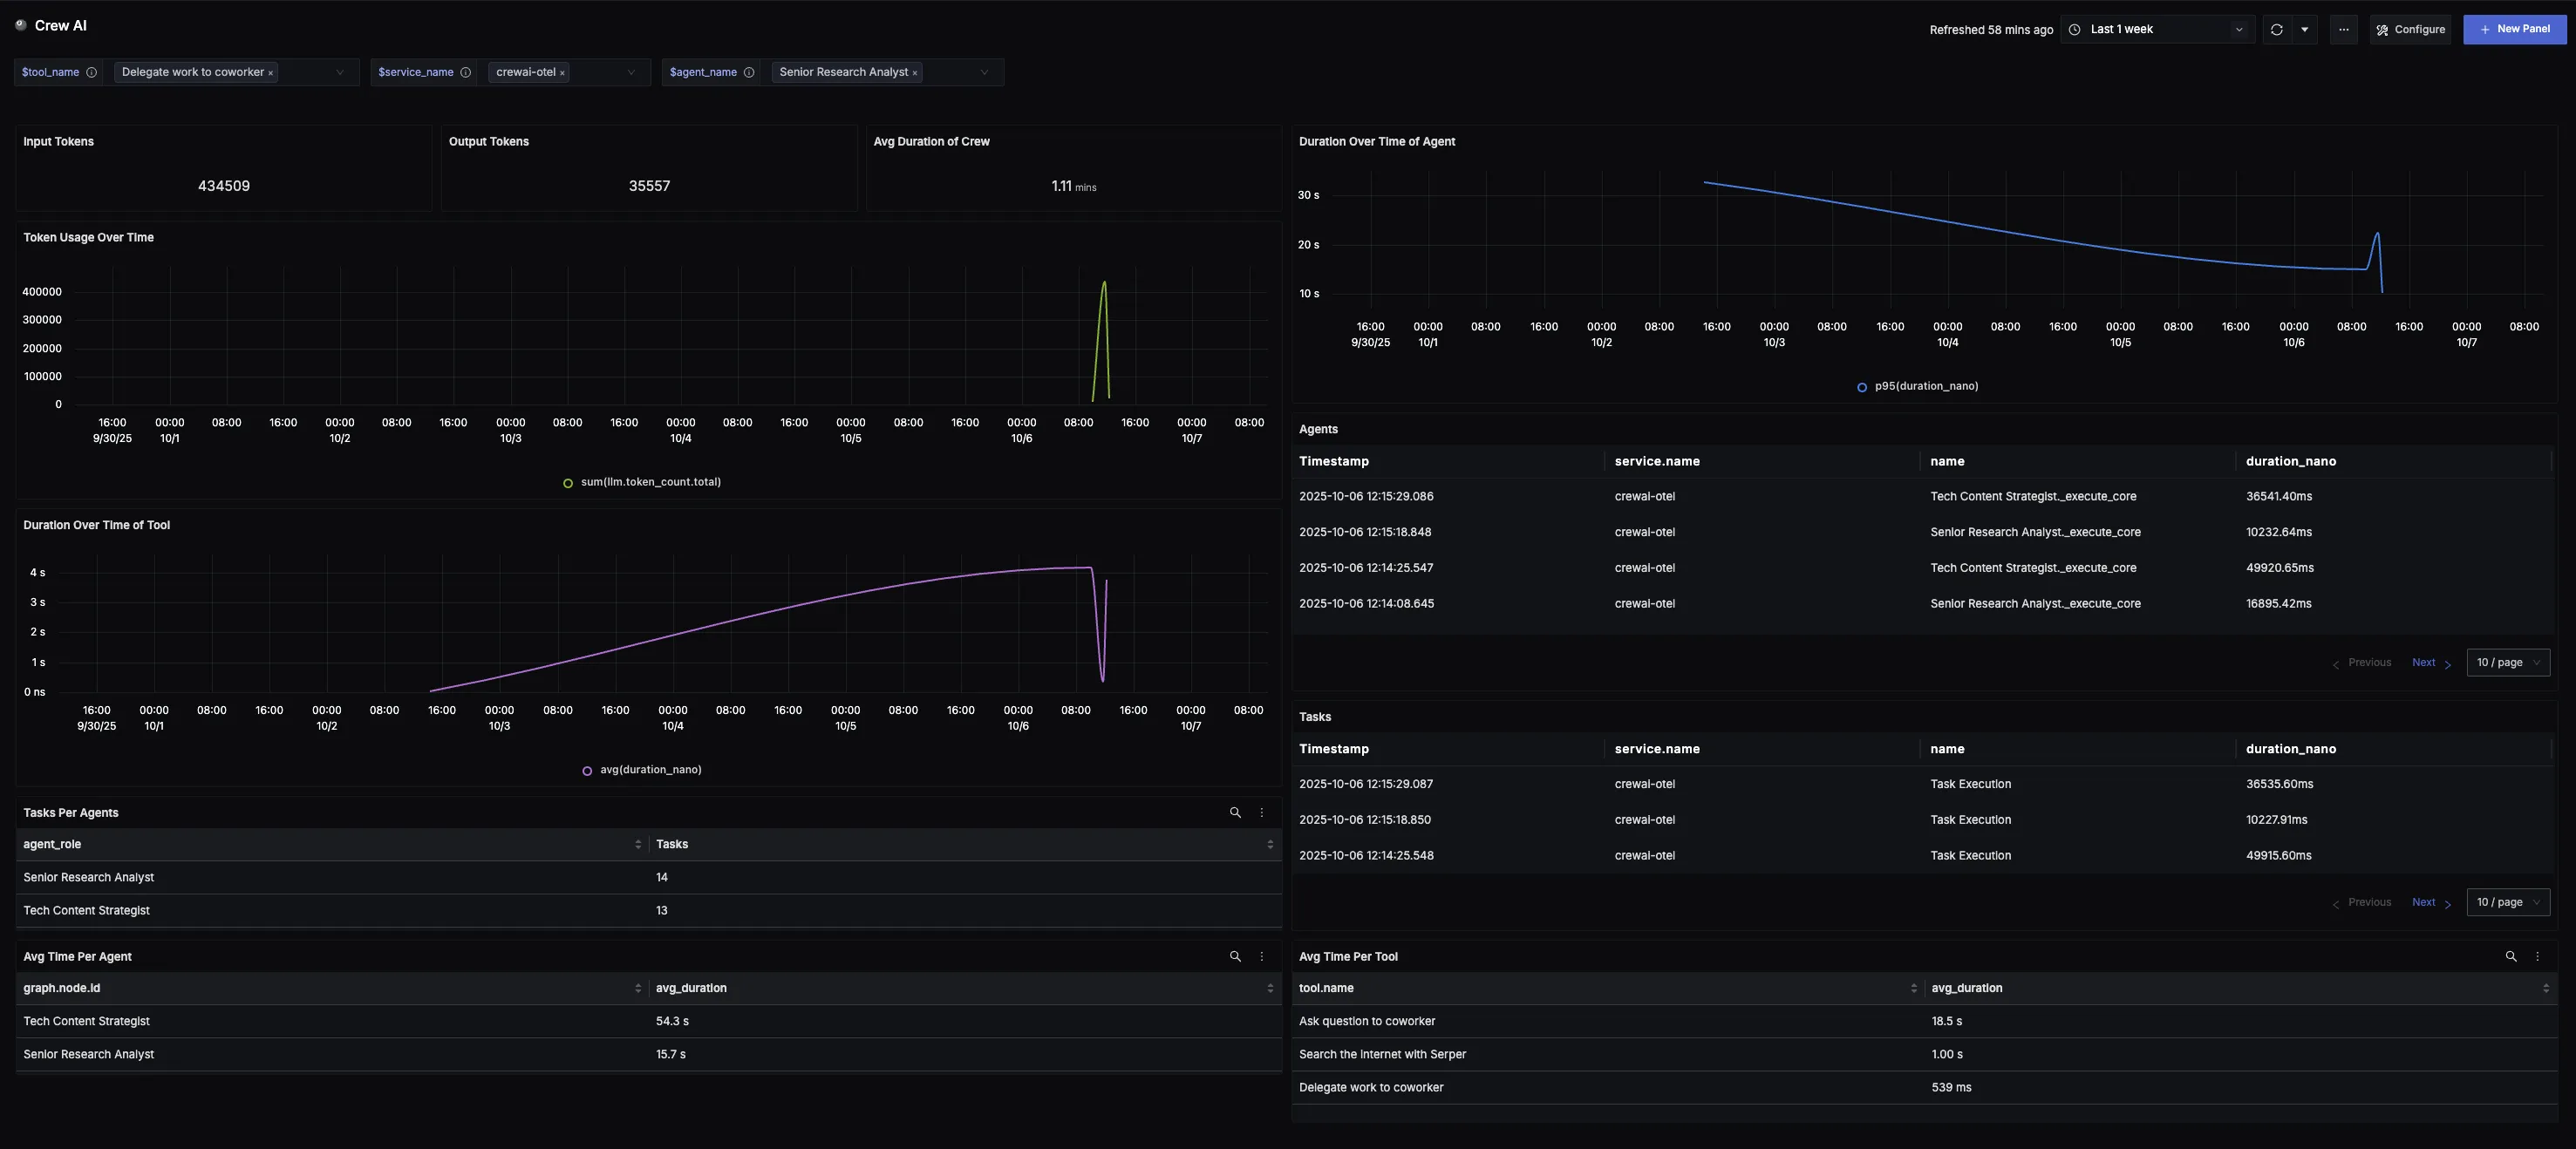
This dashboard offers a clear view into Crew AI workflows and performance. It highlights key metrics such as token consumption, crew and agent execution times, task distribution, and per-tool performance trends. Teams can monitor which agents and tasks are most active, track latency patterns, and identify optimization opportunities to improve reliability and efficiency across their Crew AI deployments.
📝 Note
To use this dashboard, you need to set up the data source and send telemetry to SigNoz. Follow the CrewAI Observability guide to get started.
Dashboard Preview

Dashboards → + New dashboard → Import JSON
What This Dashboard Monitors
This dashboard tracks critical performance metrics for your Crew AI workflows using OpenTelemetry to help you:
- Monitor Token Consumption: Track input tokens (user prompts) and output tokens (model responses) to monitor system workload, efficiency trends, and consumption across different Crew AI workflows.
- Track Crew Performance: Monitor the average total execution time for each Crew run to understand workflow duration, spot inefficiencies, and evaluate the impact of optimizations.
- Analyze Agent Performance: Track execution time and task distribution per agent to identify performance trends, workload imbalances, and optimization opportunities.
- Monitor Tool Efficiency: Observe execution time for each tool to reveal performance patterns, inefficiencies, or changes in tool responsiveness.
- Monitor Usage Patterns: Observe token consumption trends over time to spot adoption curves, peak cycles, and unusual spikes in Crew AI activity.
- Understand Workflow Structure: View all Agent and Task spans within Crew executions, with direct links to trace spans for detailed inspection of execution flow.
Metrics Included
Token Usage Metrics
- Total Token Usage (Input & Output): Displays the split between input tokens (user prompts) and output tokens (model responses), showing exactly how much work the system is doing over time.
- Token Usage Over Time: Time series visualization showing token consumption trends to identify adoption patterns, peak cycles, and baseline activity.
Performance & Reliability
- Average Duration of Crew: Displays the average total execution time for each Crew run from start to completion, helping teams understand workflow duration and identify inefficiencies.
- Duration Over Time (Per Agent): Shows how execution time of specific agents changes over time, revealing performance trends, slowdowns, or improvements.
- Duration Over Time (Per Tool): Tracks execution time of specific tools over time to identify performance patterns and inefficiencies in tool responsiveness.
- Average Time Per Agent: Displays average task execution time for each agent to compare efficiency and identify where performance improvements may be needed.
- Average Time Per Tool: Shows average execution time for each tool to highlight efficiency and identify tools that may need optimization.
Usage Analysis
- Agents and Tasks: Lists all Agent and Task spans within Crew executions, with each entry linking directly to its corresponding trace span for quick navigation and detailed inspection.
- Tasks Per Agent: Shows the number of tasks executed by each agent, providing a clear view of workload distribution and helping identify which agents handle the most activity.
- Token Usage Over Time: Time series visualization showing token consumption trends to identify adoption patterns, peak cycles, and baseline activity across Crew AI workflows.
