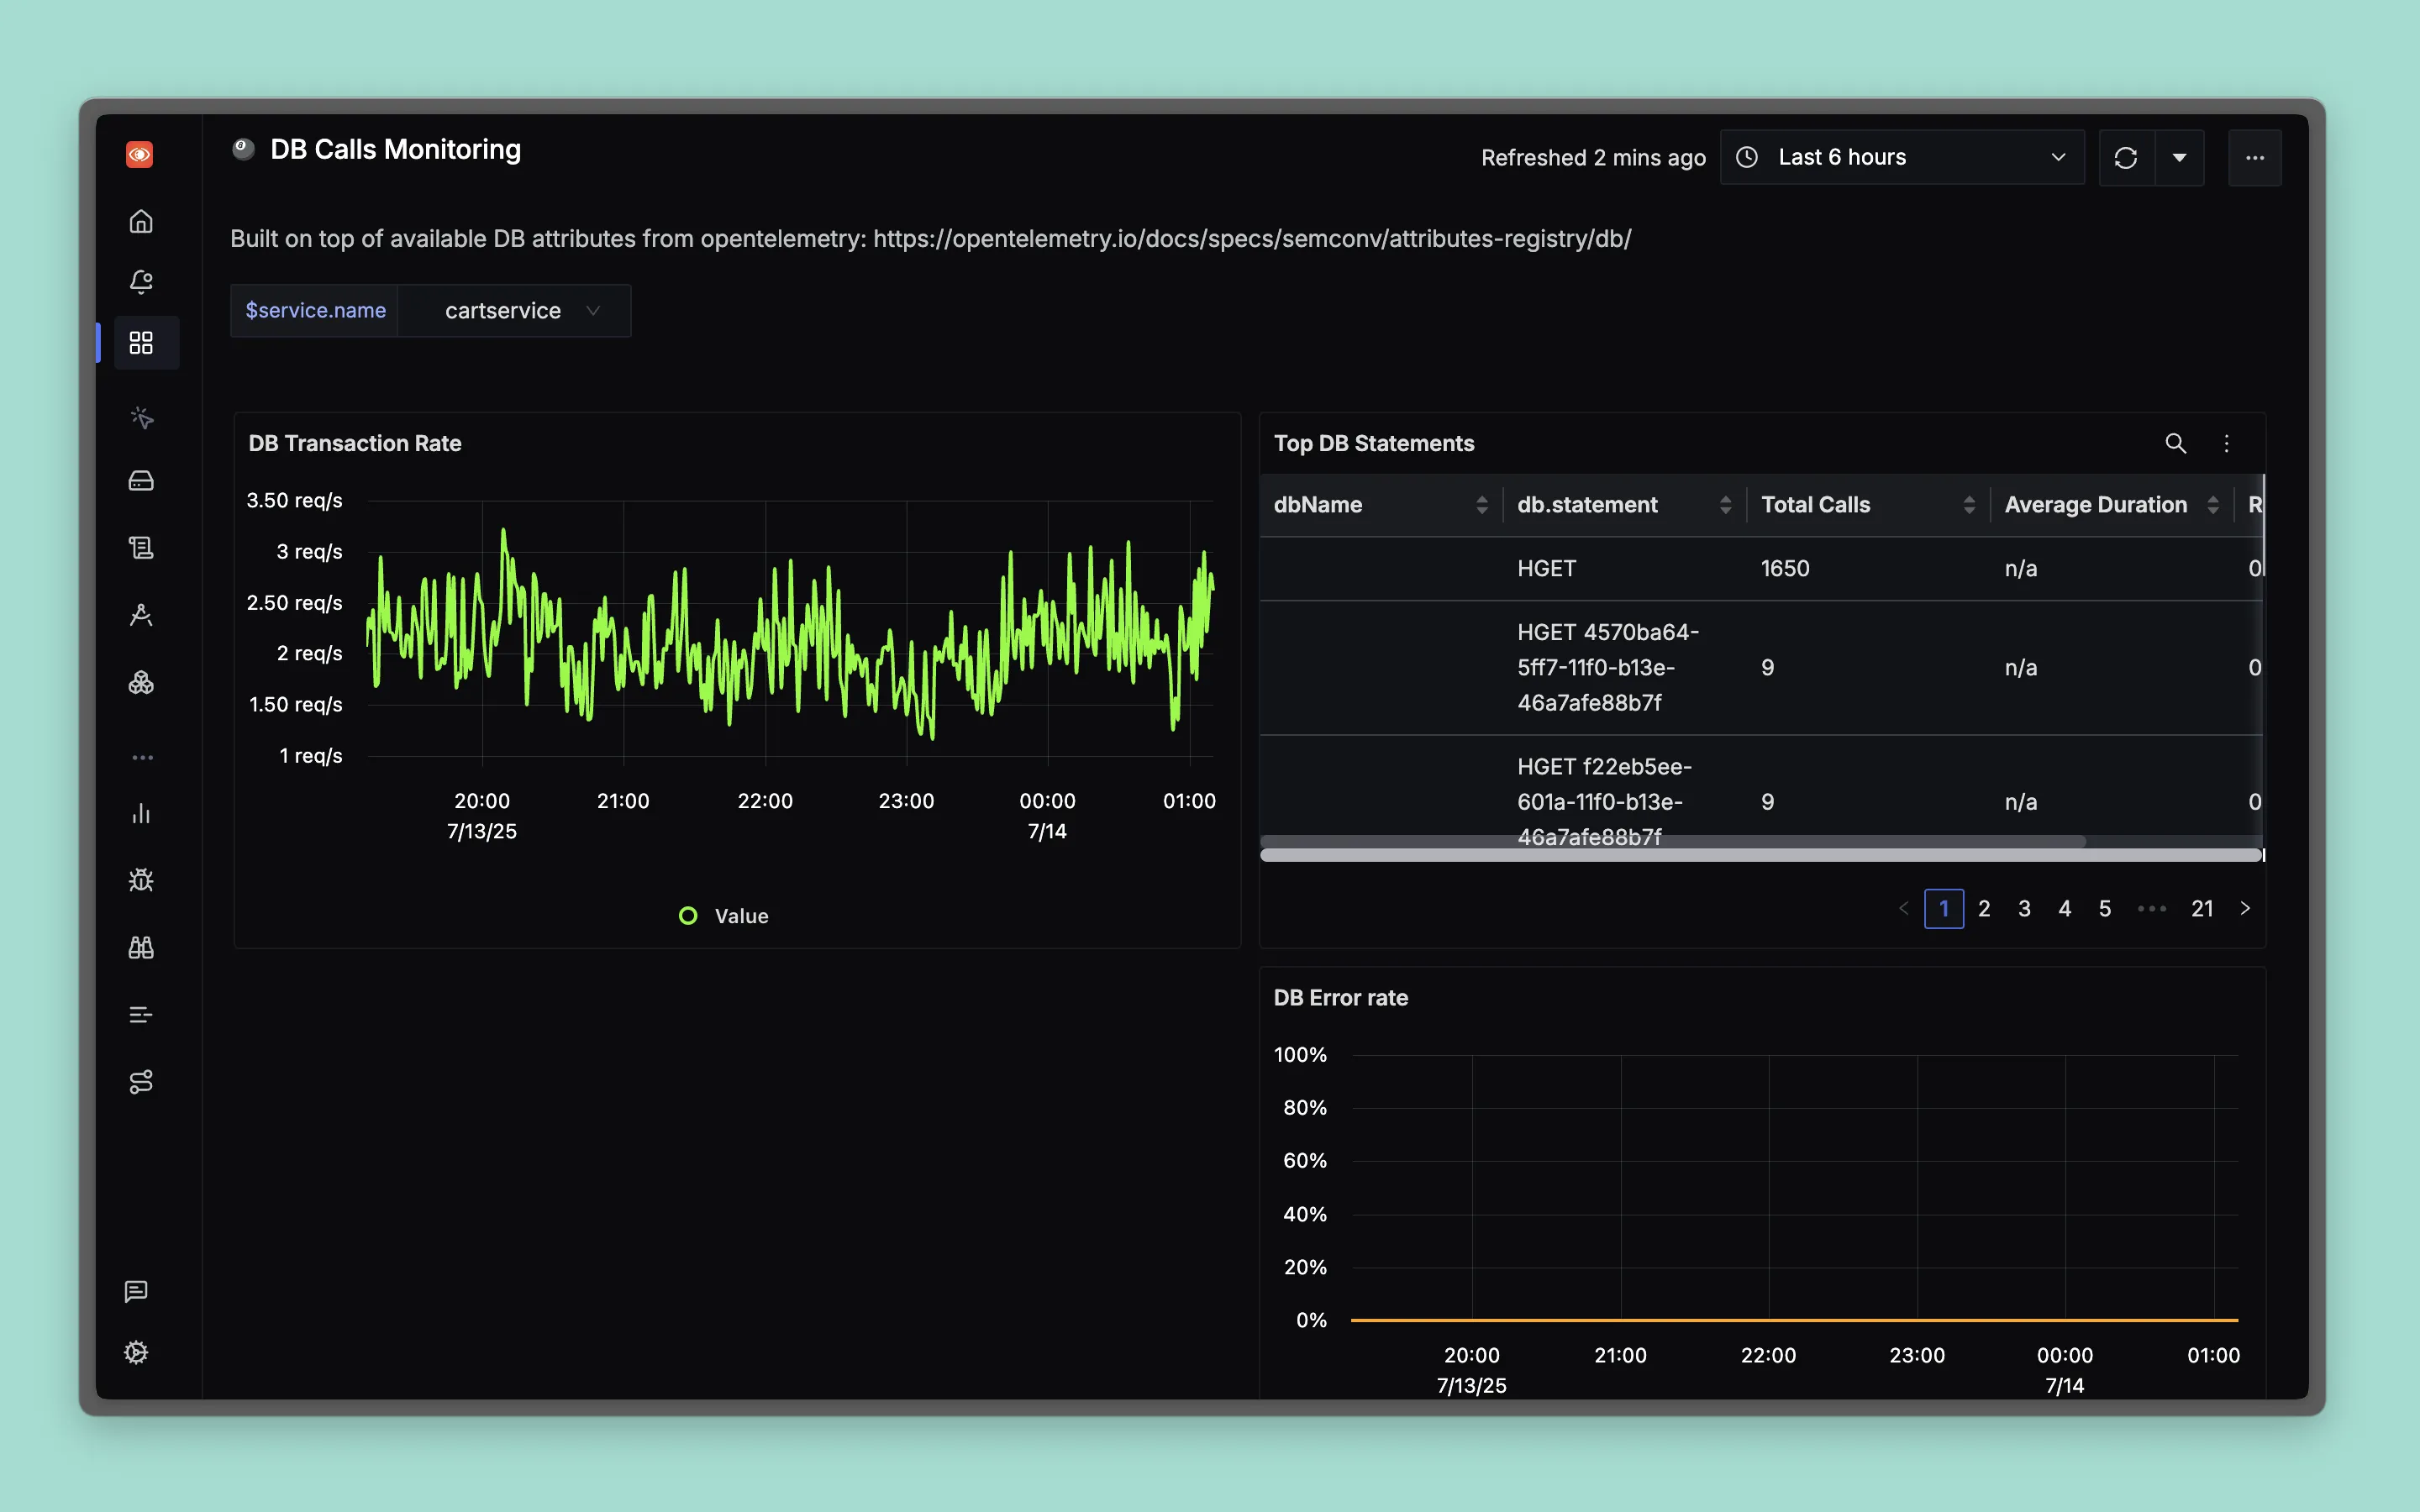
This dashboard provides comprehensive monitoring of database operations and calls, offering detailed visibility into database transaction rates, top database statements, error rates, and slowest database calls. Built on top of available DB attributes from OpenTelemetry.
Dashboard Preview
Dashboard JSON
Recommended. Uses the V2 dashboard schema and needs SigNoz v0.135.0 or newer.
Import it in SigNoz with Dashboards → + New dashboard → Import JSON. Import guide
What This Dashboard Monitors
This dashboard tracks essential database metrics to help you:
- Monitor Database Performance: Track database transaction rates and response times
- Identify Top Database Operations: Analyze the most frequently executed database statements
- Track Database Errors: Monitor database error rates and identify problematic queries
- Optimize Slow Queries: Identify and analyze the slowest database calls for optimization
- Database Health Monitoring: Keep track of overall database system health and performance
Metrics Included
Transaction Rate Metrics
- DB Transaction Rate: Shows database transaction rate over time (req/s)
Error Metrics
- DB Error Rate: Shows database error percentage over time
Top Operations
- Top DB Statements Table: Shows database statements with
db_name,db.statement, total calls, average duration, and rate
Slowest DB Calls
- Slowest DB Calls Table: Shows slowest database operations with timestamp,
service.name, name,duration_nano,db.statement, anddb_operation
Dashboard Variables
This dashboard includes pre-configured variables for filtering:
- service.name: Filter by specific service names making database calls


