This dashboard provides comprehensive monitoring of HAProxy load balancer operations, offering detailed visibility into network traffic, request and response metrics, connection statistics, session data, and error rates.
📝 Note
To use this dashboard, you need to configure the haproxy receiver. Follow the OpenTelemetry Receivers guide to get started.
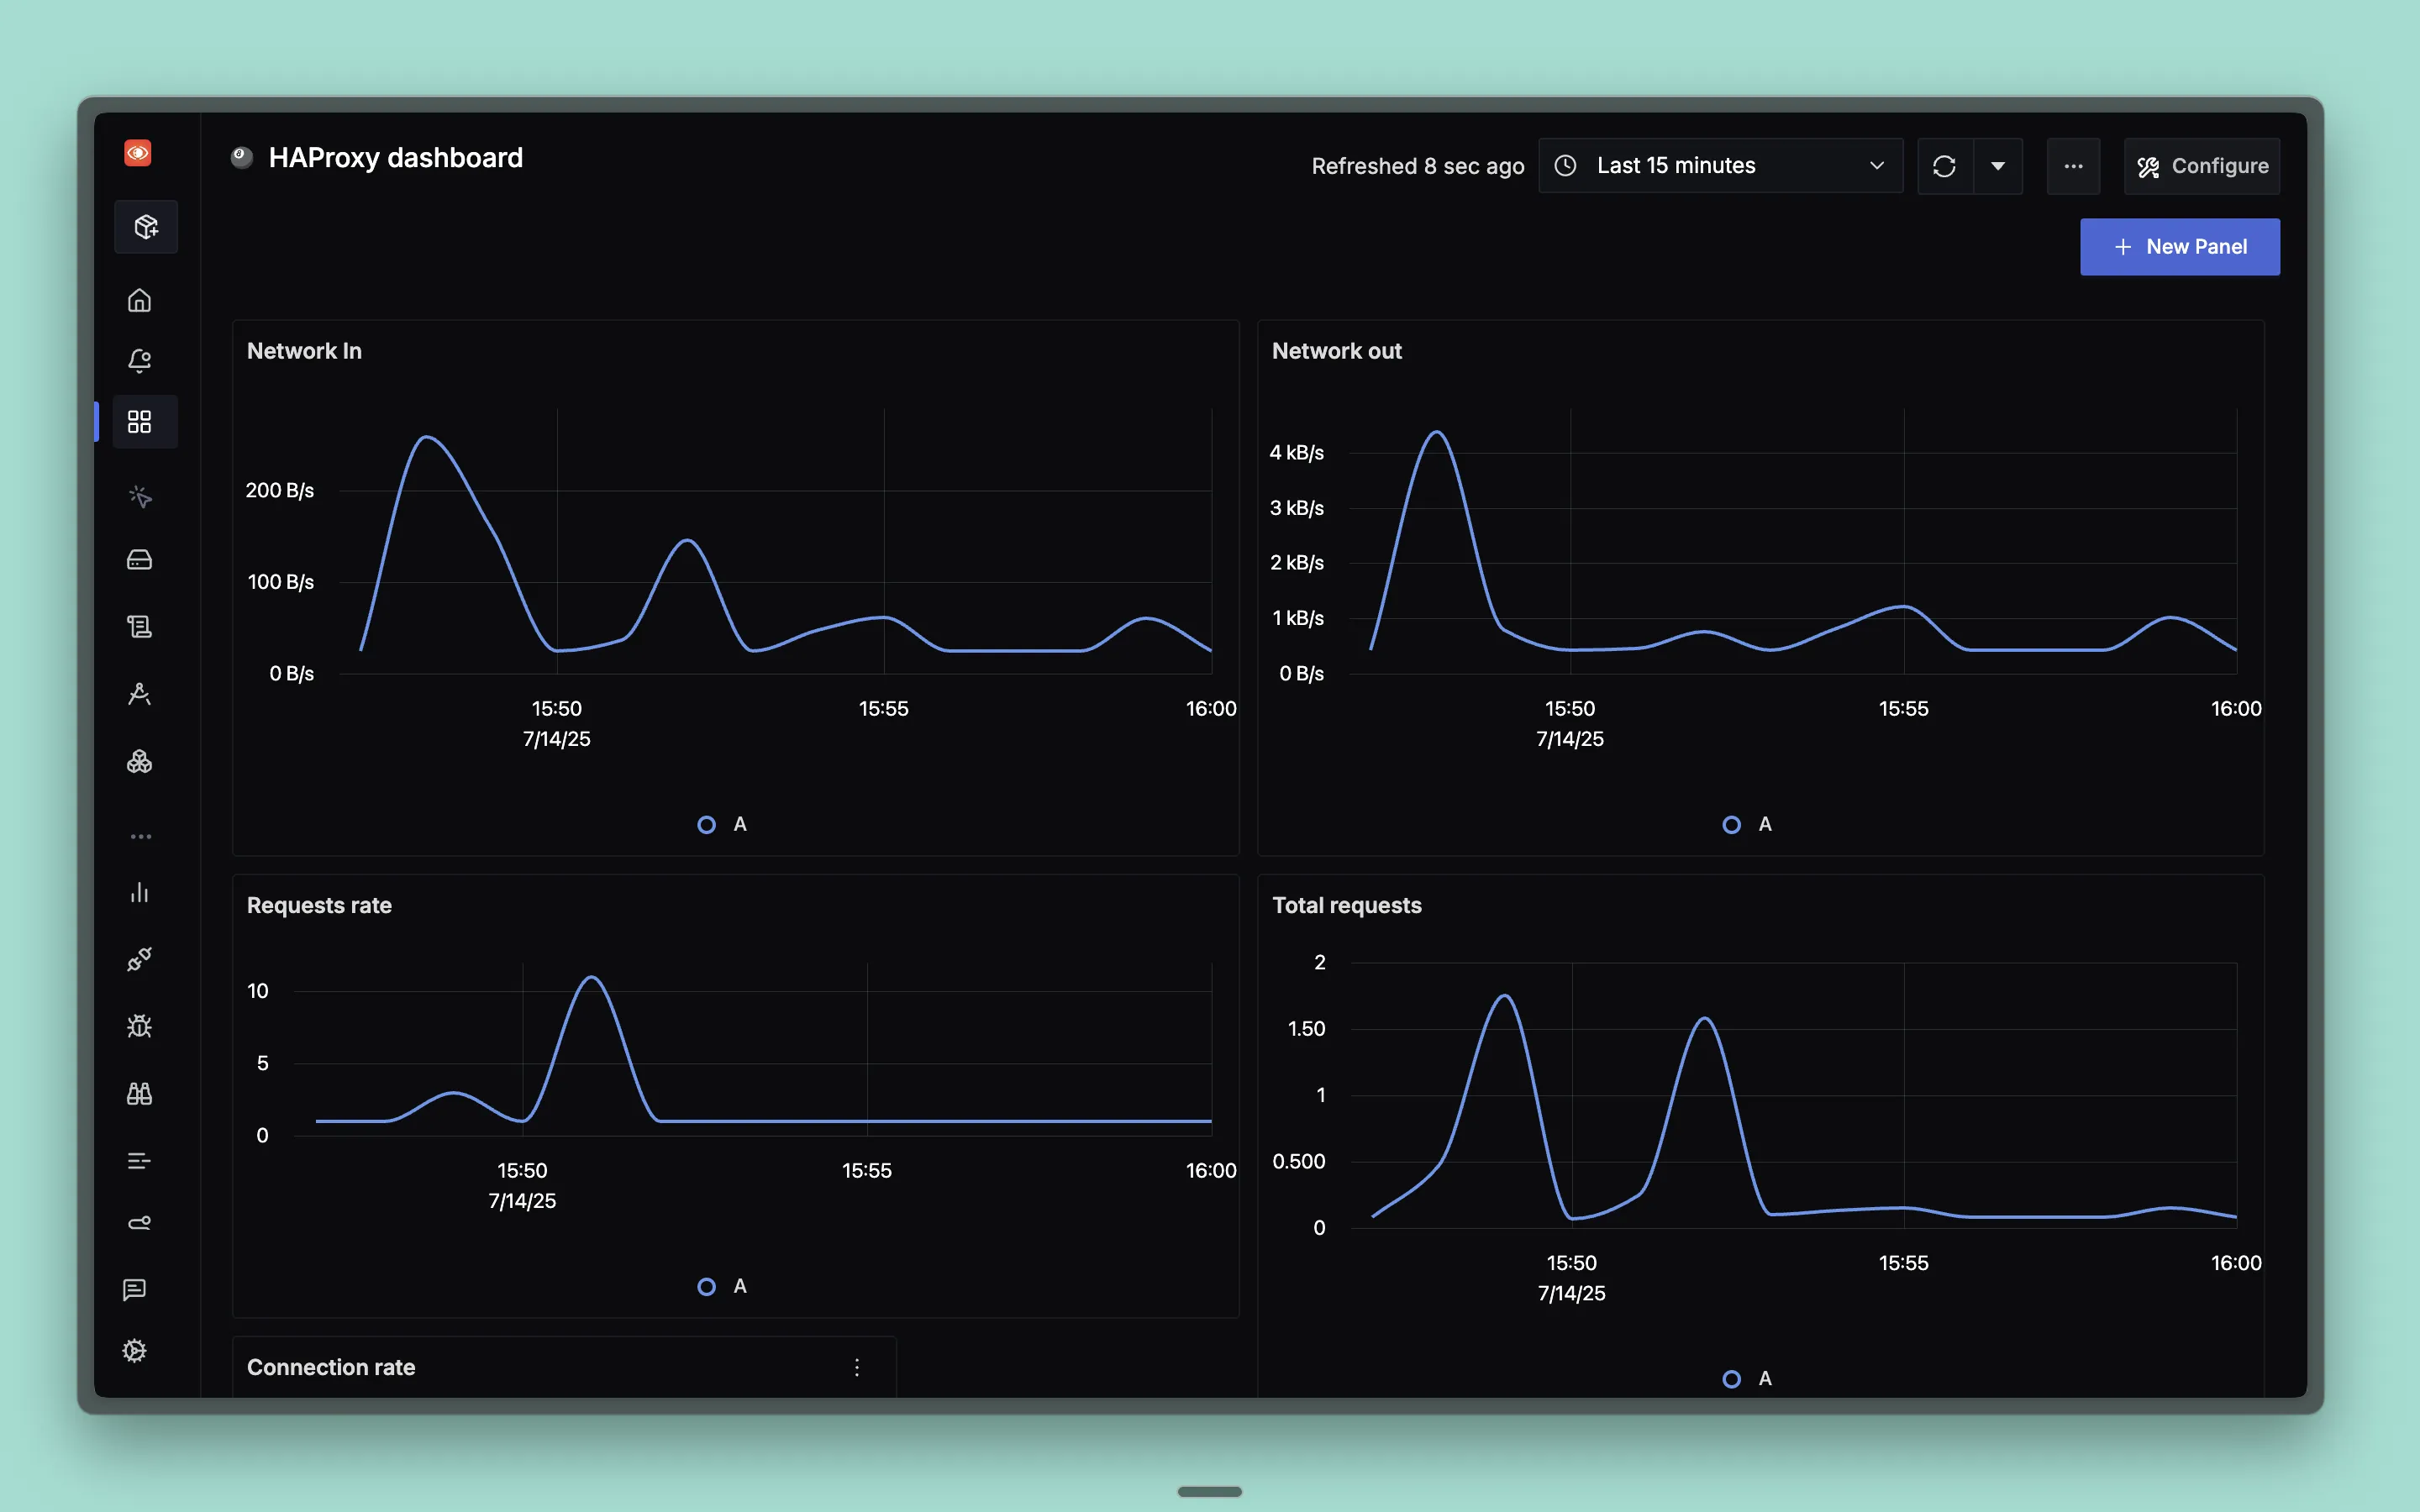
Dashboard Preview
Dashboards → + New dashboard → Import JSON
What This Dashboard Monitors
This dashboard tracks essential HAProxy metrics to help you:
- Monitor Network Performance: Track inbound and outbound network traffic and bandwidth usage
- Analyze Request/Response Patterns: Monitor request rates, total requests, and response statistics
- Track Connection Health: Monitor connection rates, errors, and retry attempts
- Monitor Session Management: Analyze session counts, rates, and averages
- Identify Performance Issues: Track error rates, denied requests, and queued operations
- Load Balancer Health Monitoring: Keep track of overall HAProxy performance and availability
Metrics Included
Network Metrics
- Network In: Shows inbound network traffic over time (Bps)
- Network Out: Shows outbound network traffic over time (Bps)
Request Metrics
- Requests Rate: Shows request rate over time
- Total Requests: Shows total number of requests over time
- Denied Requests: Shows denied request rate over time
- Error Requests: Shows error request rate over time
- Redispatched Requests: Shows redispatched request rate over time
- Queued Requests: Shows queued request rate over time
Connection Metrics
- Connection Rate: Shows connection establishment rate over time
- Connection Errors: Shows connection error rate over time
- Connection Retries: Shows connection retry rate over time
Response Metrics
- Denied Responses: Shows denied response rate over time
- Error Responses: Shows error response rate over time
Session Metrics
- Average Sessions: Shows average number of concurrent sessions over time
- Sessions Count: Shows current session count over time
- Sessions Rate: Shows session establishment rate over time
Error Metrics
- 500 Errors: Shows 5xx server error rate over time grouped by status code
