
This dashboard provides comprehensive monitoring of Java Virtual Machine (JVM) performance and resource utilization, offering detailed visibility into memory usage, garbage collection, thread states, and class loading for optimal Java application monitoring.
To use this dashboard, you need to set up the data source and send telemetry to SigNoz. Follow the JVM Metrics guide to get started.
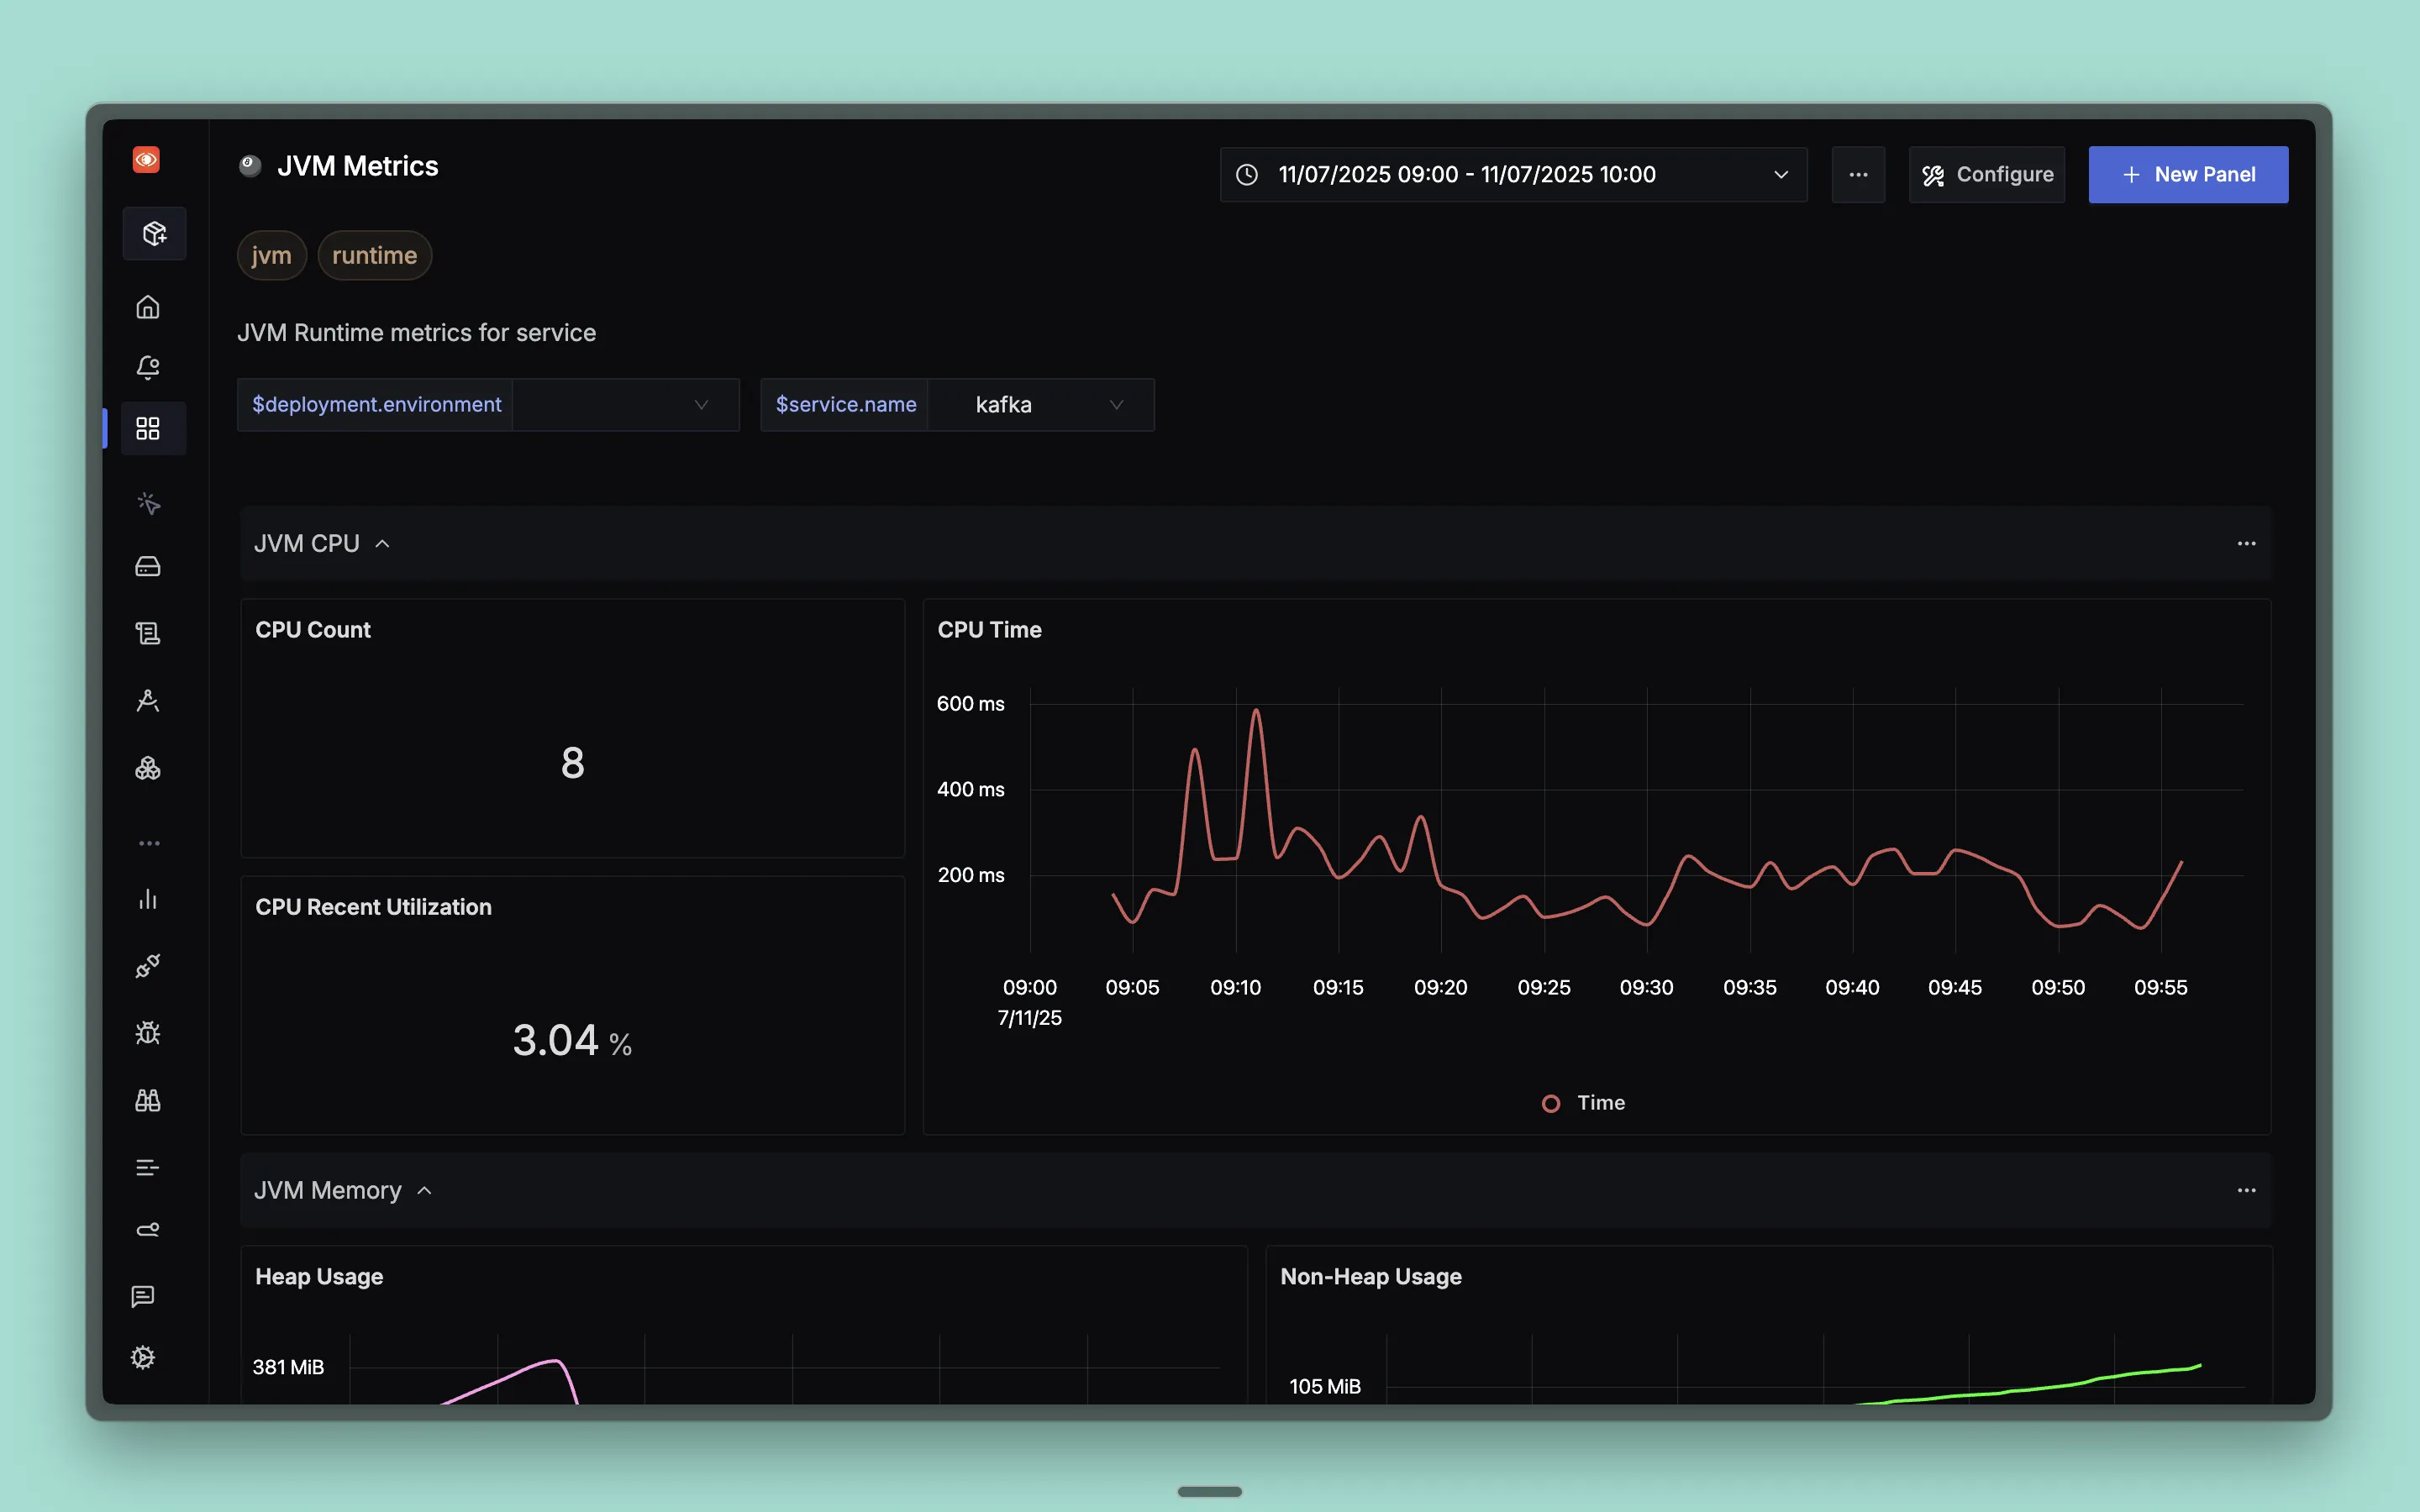
Dashboard Preview
Dashboards → + New dashboard → Import JSON
What This Dashboard Monitors
This dashboard tracks essential JVM runtime metrics to help you:
- Monitor CPU Performance: Track CPU utilization and processing time
- Analyze Memory Usage: Monitor heap, non-heap, and memory pool utilization
- Track Garbage Collection: Monitor GC frequency, duration, and performance impact
- Monitor Thread States: Track thread counts and states for concurrency analysis
- Class Loading: Monitor class loading and unloading patterns
- Performance Optimization: Identify bottlenecks and optimize JVM performance
- Resource Management: Monitor memory pools and garbage collection efficiency
Metrics Included
CPU Metrics
- CPU Count: Shows number of available CPU cores
- CPU Time: Shows JVM CPU time consumption over time
- CPU Recent Utilization: Shows recent CPU utilization percentage
Memory Metrics
- Heap Usage: Shows heap memory usage over time
- Non-Heap Usage: Shows non-heap memory usage over time
- Old gen size: Shows G1 Old Generation memory pool usage over time
- Eden size: Shows G1 Eden Space memory pool usage over time
- Survivor size: Shows G1 Survivor Space memory pool usage over time
Thread Metrics
- Timed waiting threads: Shows count of threads in timed waiting state over time
- Blocked threads: Shows count of threads in blocked state over time
- Daemon threads: Shows count of daemon threads over time
- Runnable threads: Shows count of threads in runnable state over time
- Live threads: Shows count of live (non-daemon) threads over time
Garbage Collection Metrics
- GC Major & Minor Collection Time (p90): Shows 90th percentile garbage collection duration for major and minor collections over time
- GC Major & Minor Collection Count: Shows rate of major and minor garbage collection events over time
- GC - Duration: Shows garbage collection duration percentiles (p50, p90, p99) in table format
- GC - p90 Duration: Shows 90th percentile garbage collection duration over time
Class Loading Metrics
- Classes loaded: Shows number of classes loaded over time
- Classes loaded: Shows number of classes unloaded over time (second graph)
Dashboard Variables
This dashboard includes pre-configured variables for filtering:
- deployment.environment: Filter by deployment environment
- service.name: Filter by specific service name