This dashboard provides focused monitoring of your application's most critical operations and endpoints, tracking the essential golden signals of observability: latency, traffic, errors, and overall performance. It's designed to help you quickly identify and troubleshoot performance issues in your key business operations.
To use this dashboard, you need to instrument your application and send traces to SigNoz. Follow the Instrumentation guide to get started.
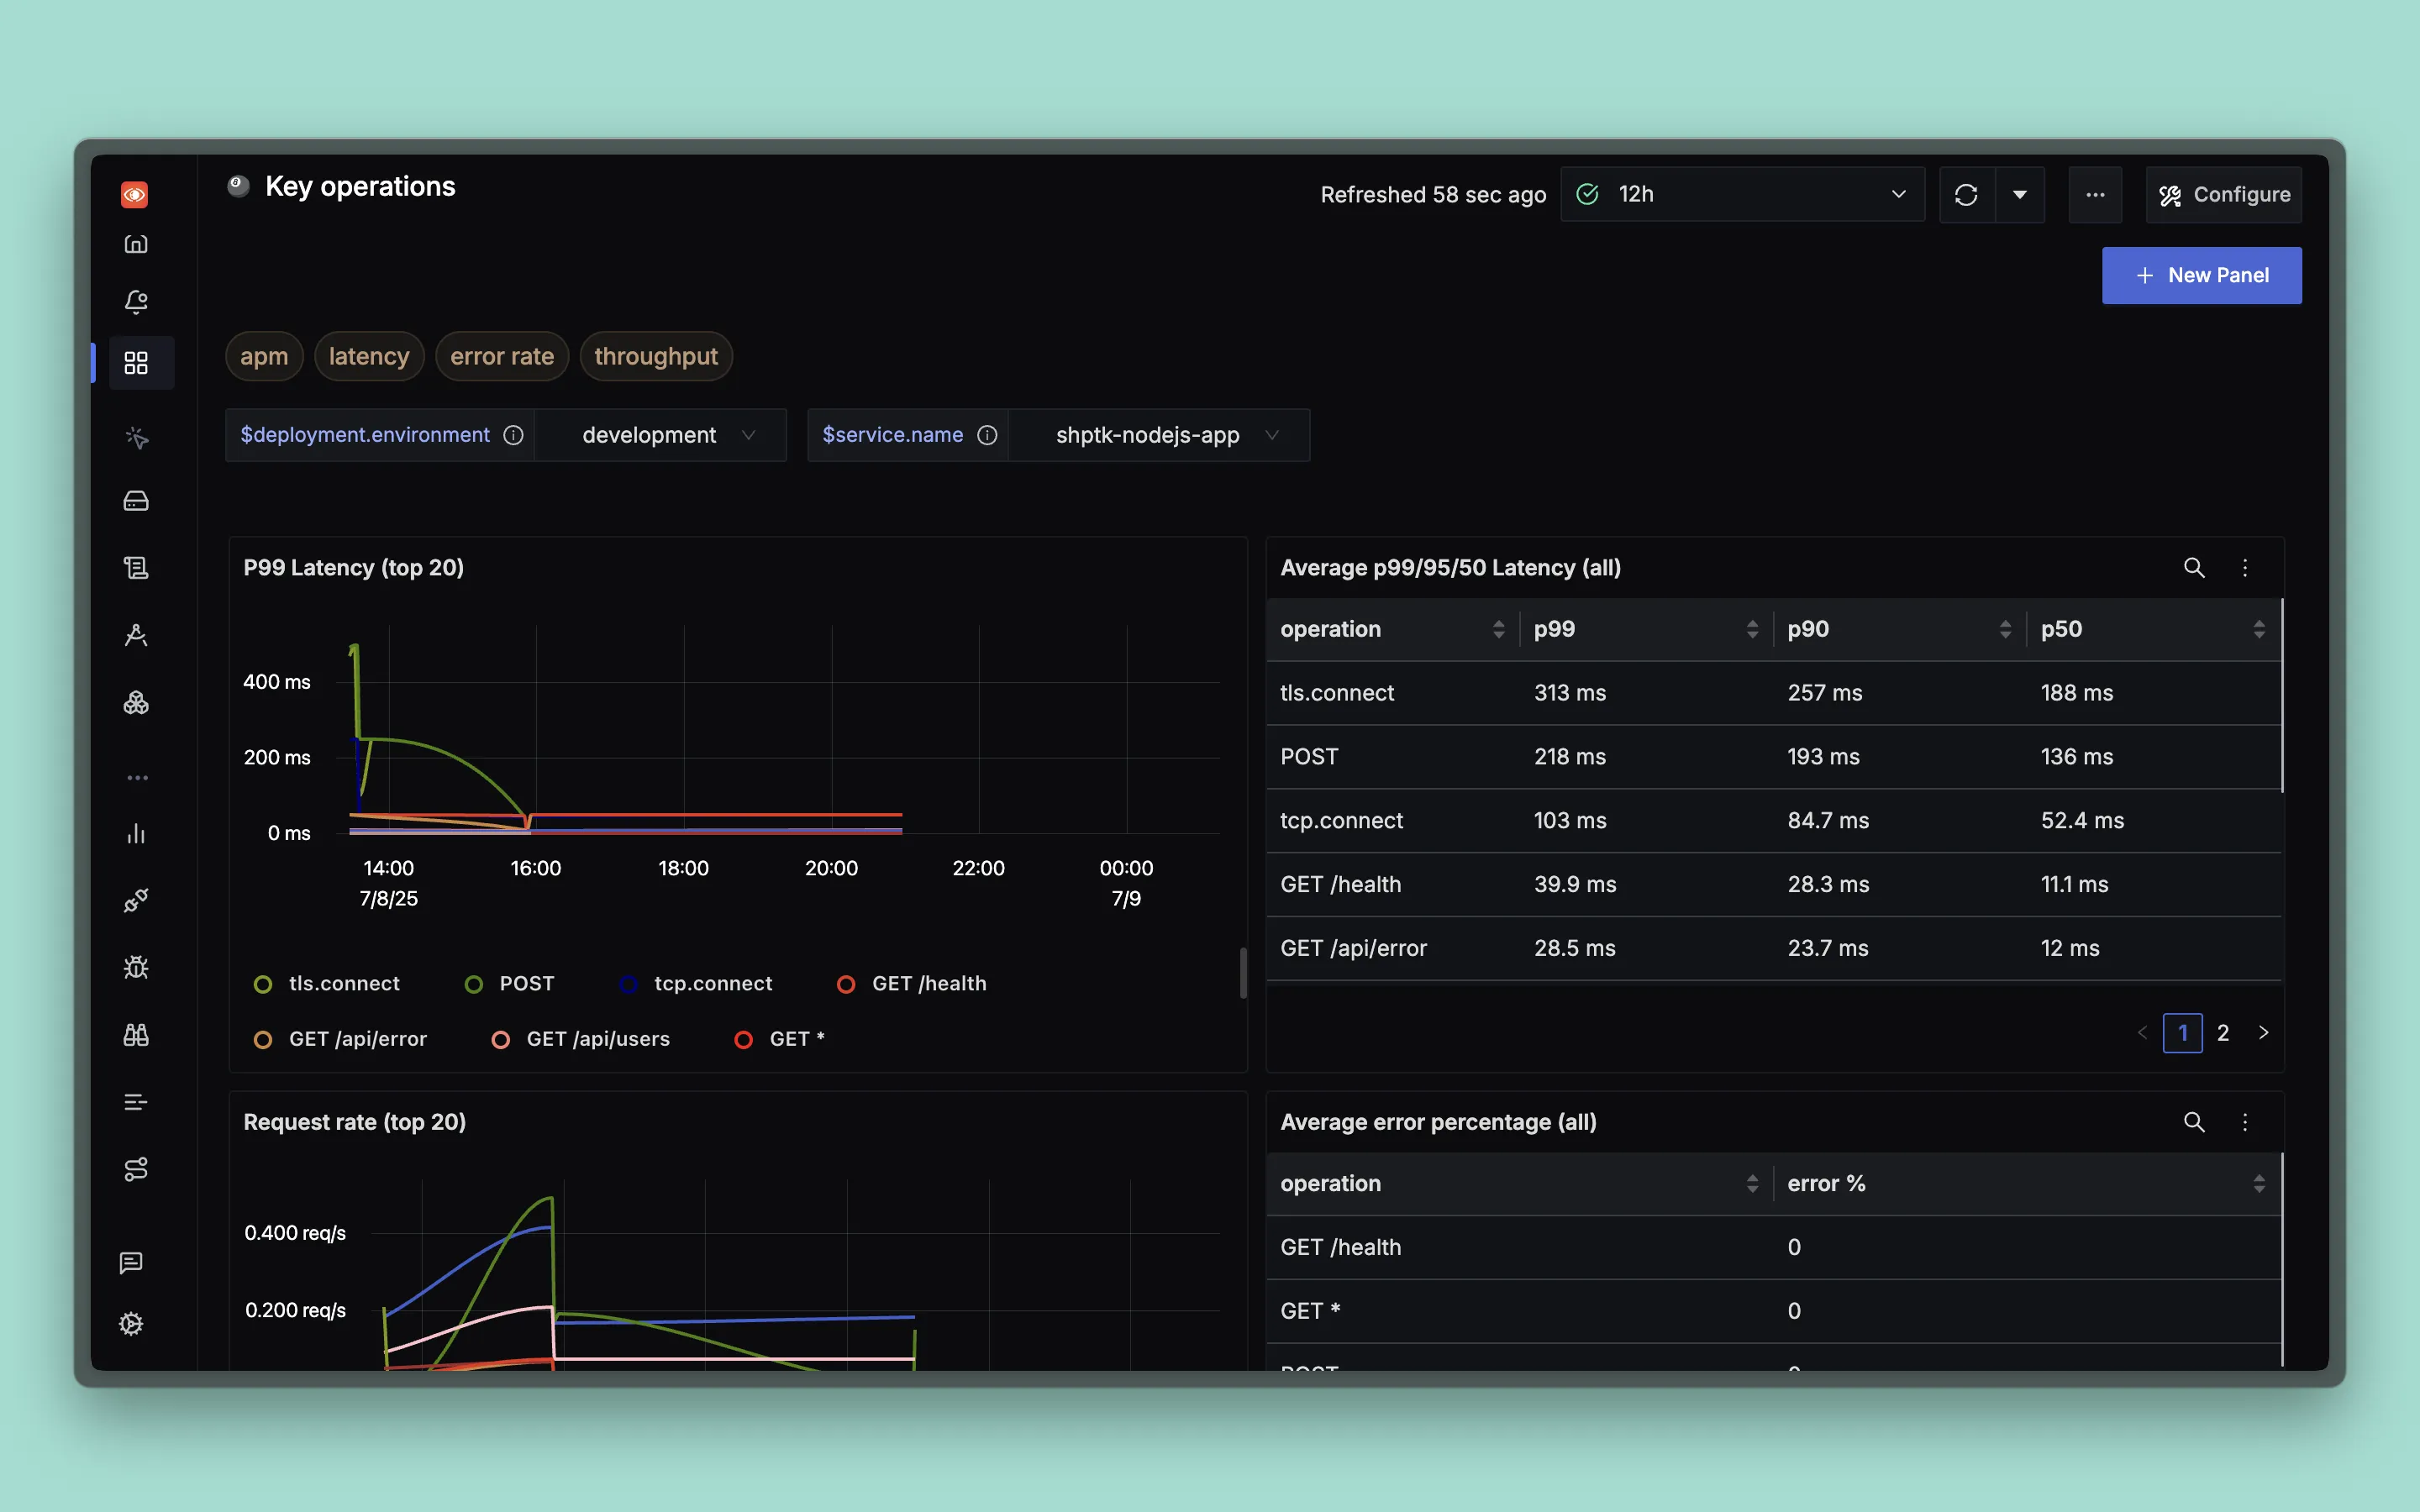
Dashboard Preview
Dashboards → + New dashboard → Import JSON
What This Dashboard Monitors
This dashboard tracks essential application performance metrics to help you:
- Monitor Key Operations: Focus on the most important API endpoints and operations
- Track Golden Signals: Monitor latency, traffic, errors, and performance indicators
- Performance Optimization: Identify slow operations and performance bottlenecks
- Error Analysis: Track error rates and identify problematic endpoints
- SLA Monitoring: Ensure critical operations meet performance requirements
Metrics Included
Latency Metrics
- P99 Latency (Top 20): 99th percentile response times chart for the highest-volume operations
- Average p99/95/50 Latency (All): Comprehensive table showing operation names with p99, p90, and p50 latencies for all operations
Request Rate Metrics
- Request Rate (Top 20): Requests per second chart for the busiest operations showing traffic patterns
Error Metrics
- Average Error Percentage (All): Table showing operation names and their corresponding error percentages
Dashboard Variables
This dashboard includes pre-configured variables for filtering:
- deployment.environment: Filter by deployment environment (production, staging, development)
- service.name: Filter by specific service names to focus on particular applications
