This dashboard provides comprehensive monitoring of Memcached performance and resource utilization, offering detailed visibility into cache operations, memory usage patterns, connection management, and system resource consumption for optimal caching system performance.
📝 Note
To use this dashboard, you need to configure the memcached receiver. Follow the OpenTelemetry Receivers guide to get started.
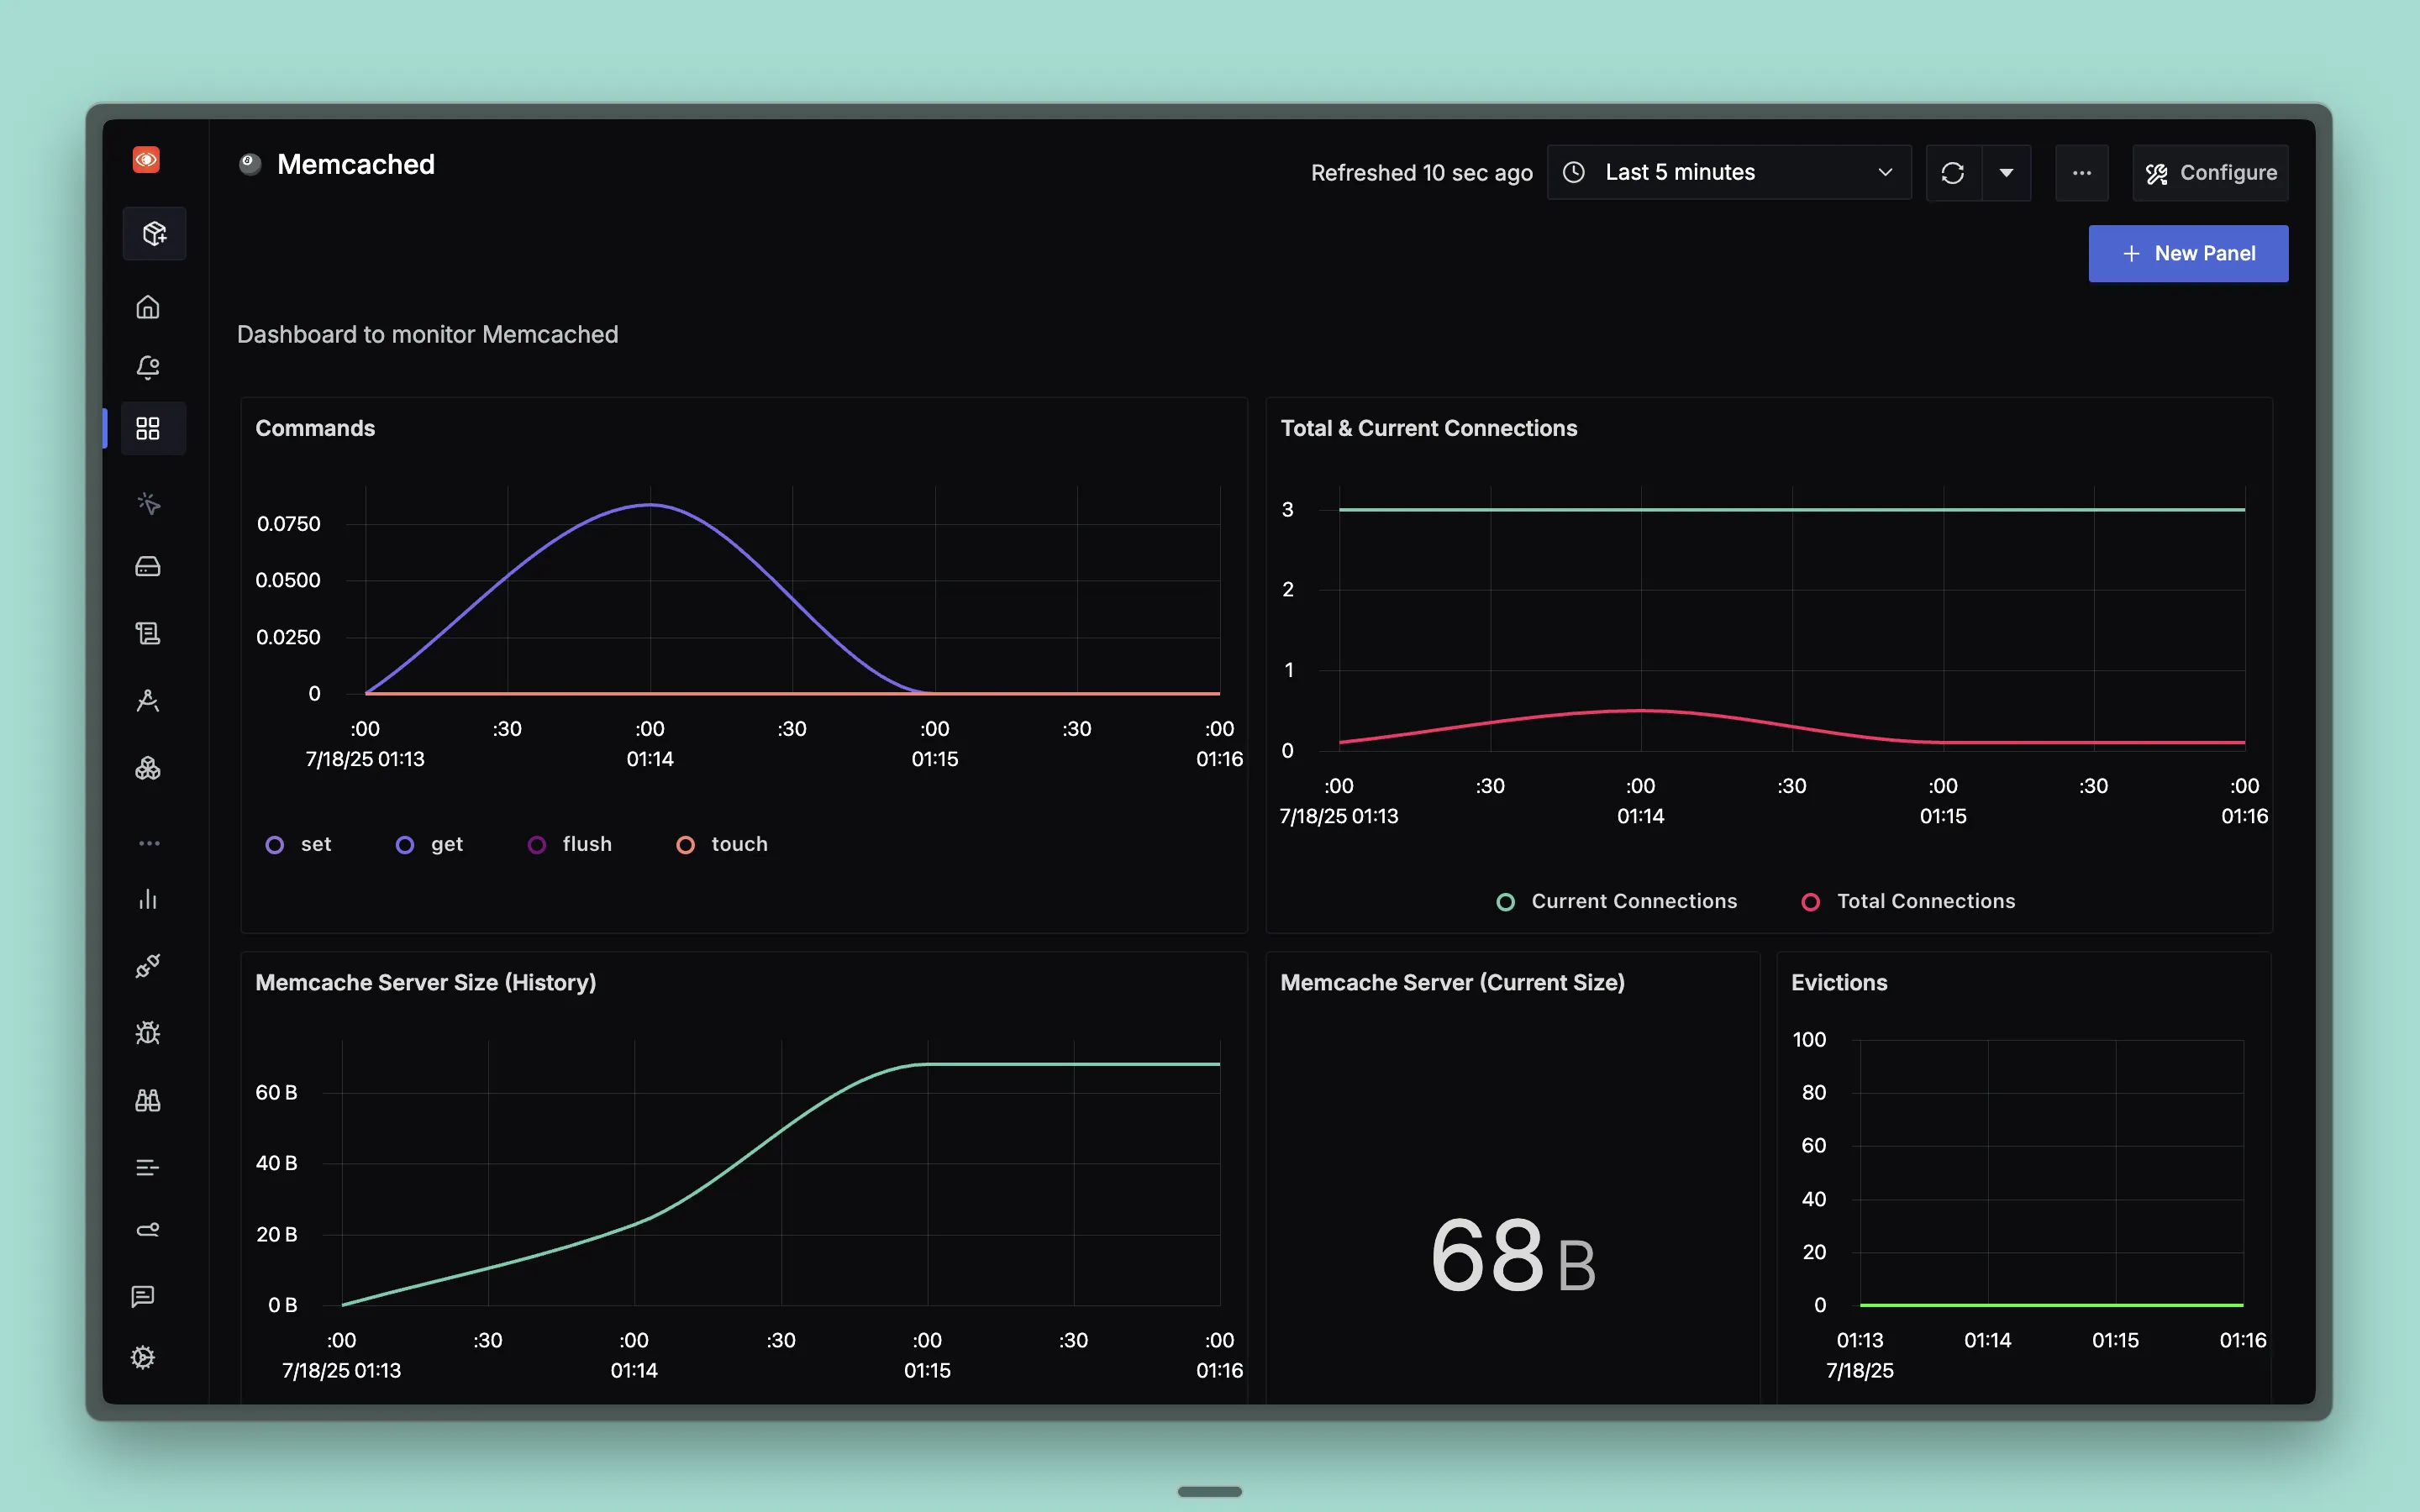
Dashboard Preview
Dashboards → + New dashboard → Import JSON
What This Dashboard Monitors
This dashboard tracks essential Memcached metrics to help you:
- Monitor Cache Operations: Track command execution patterns and cache performance
- Analyze Memory Usage: Monitor memory consumption and server size trends
- Track Connection Health: Monitor client connections and connection patterns
- Monitor Resource Utilization: Track thread usage and system resources
- Optimize Cache Performance: Identify bottlenecks and optimize cache efficiency
- Cache Management: Monitor evictions and item management
Metrics Included
Performance Metrics
- Commands: Shows command execution rate grouped by command type (set, get, flush, touch) over time
- Current Items: Shows current number of items stored in memcached over time
- Evictions: Shows cache eviction rate over time
Memory Metrics
- Memcache Server Size (History): Shows historical memory usage of memcached server over time
- Memcache Server (Current Size): Shows current memory usage of memcached server
Connection Metrics
- Current Connections: Shows current number of active client connections
- Total & Current Connections: Shows both total connection rate and current active connections over time
Resource Metrics
- Threads Count: Shows number of worker threads over time
