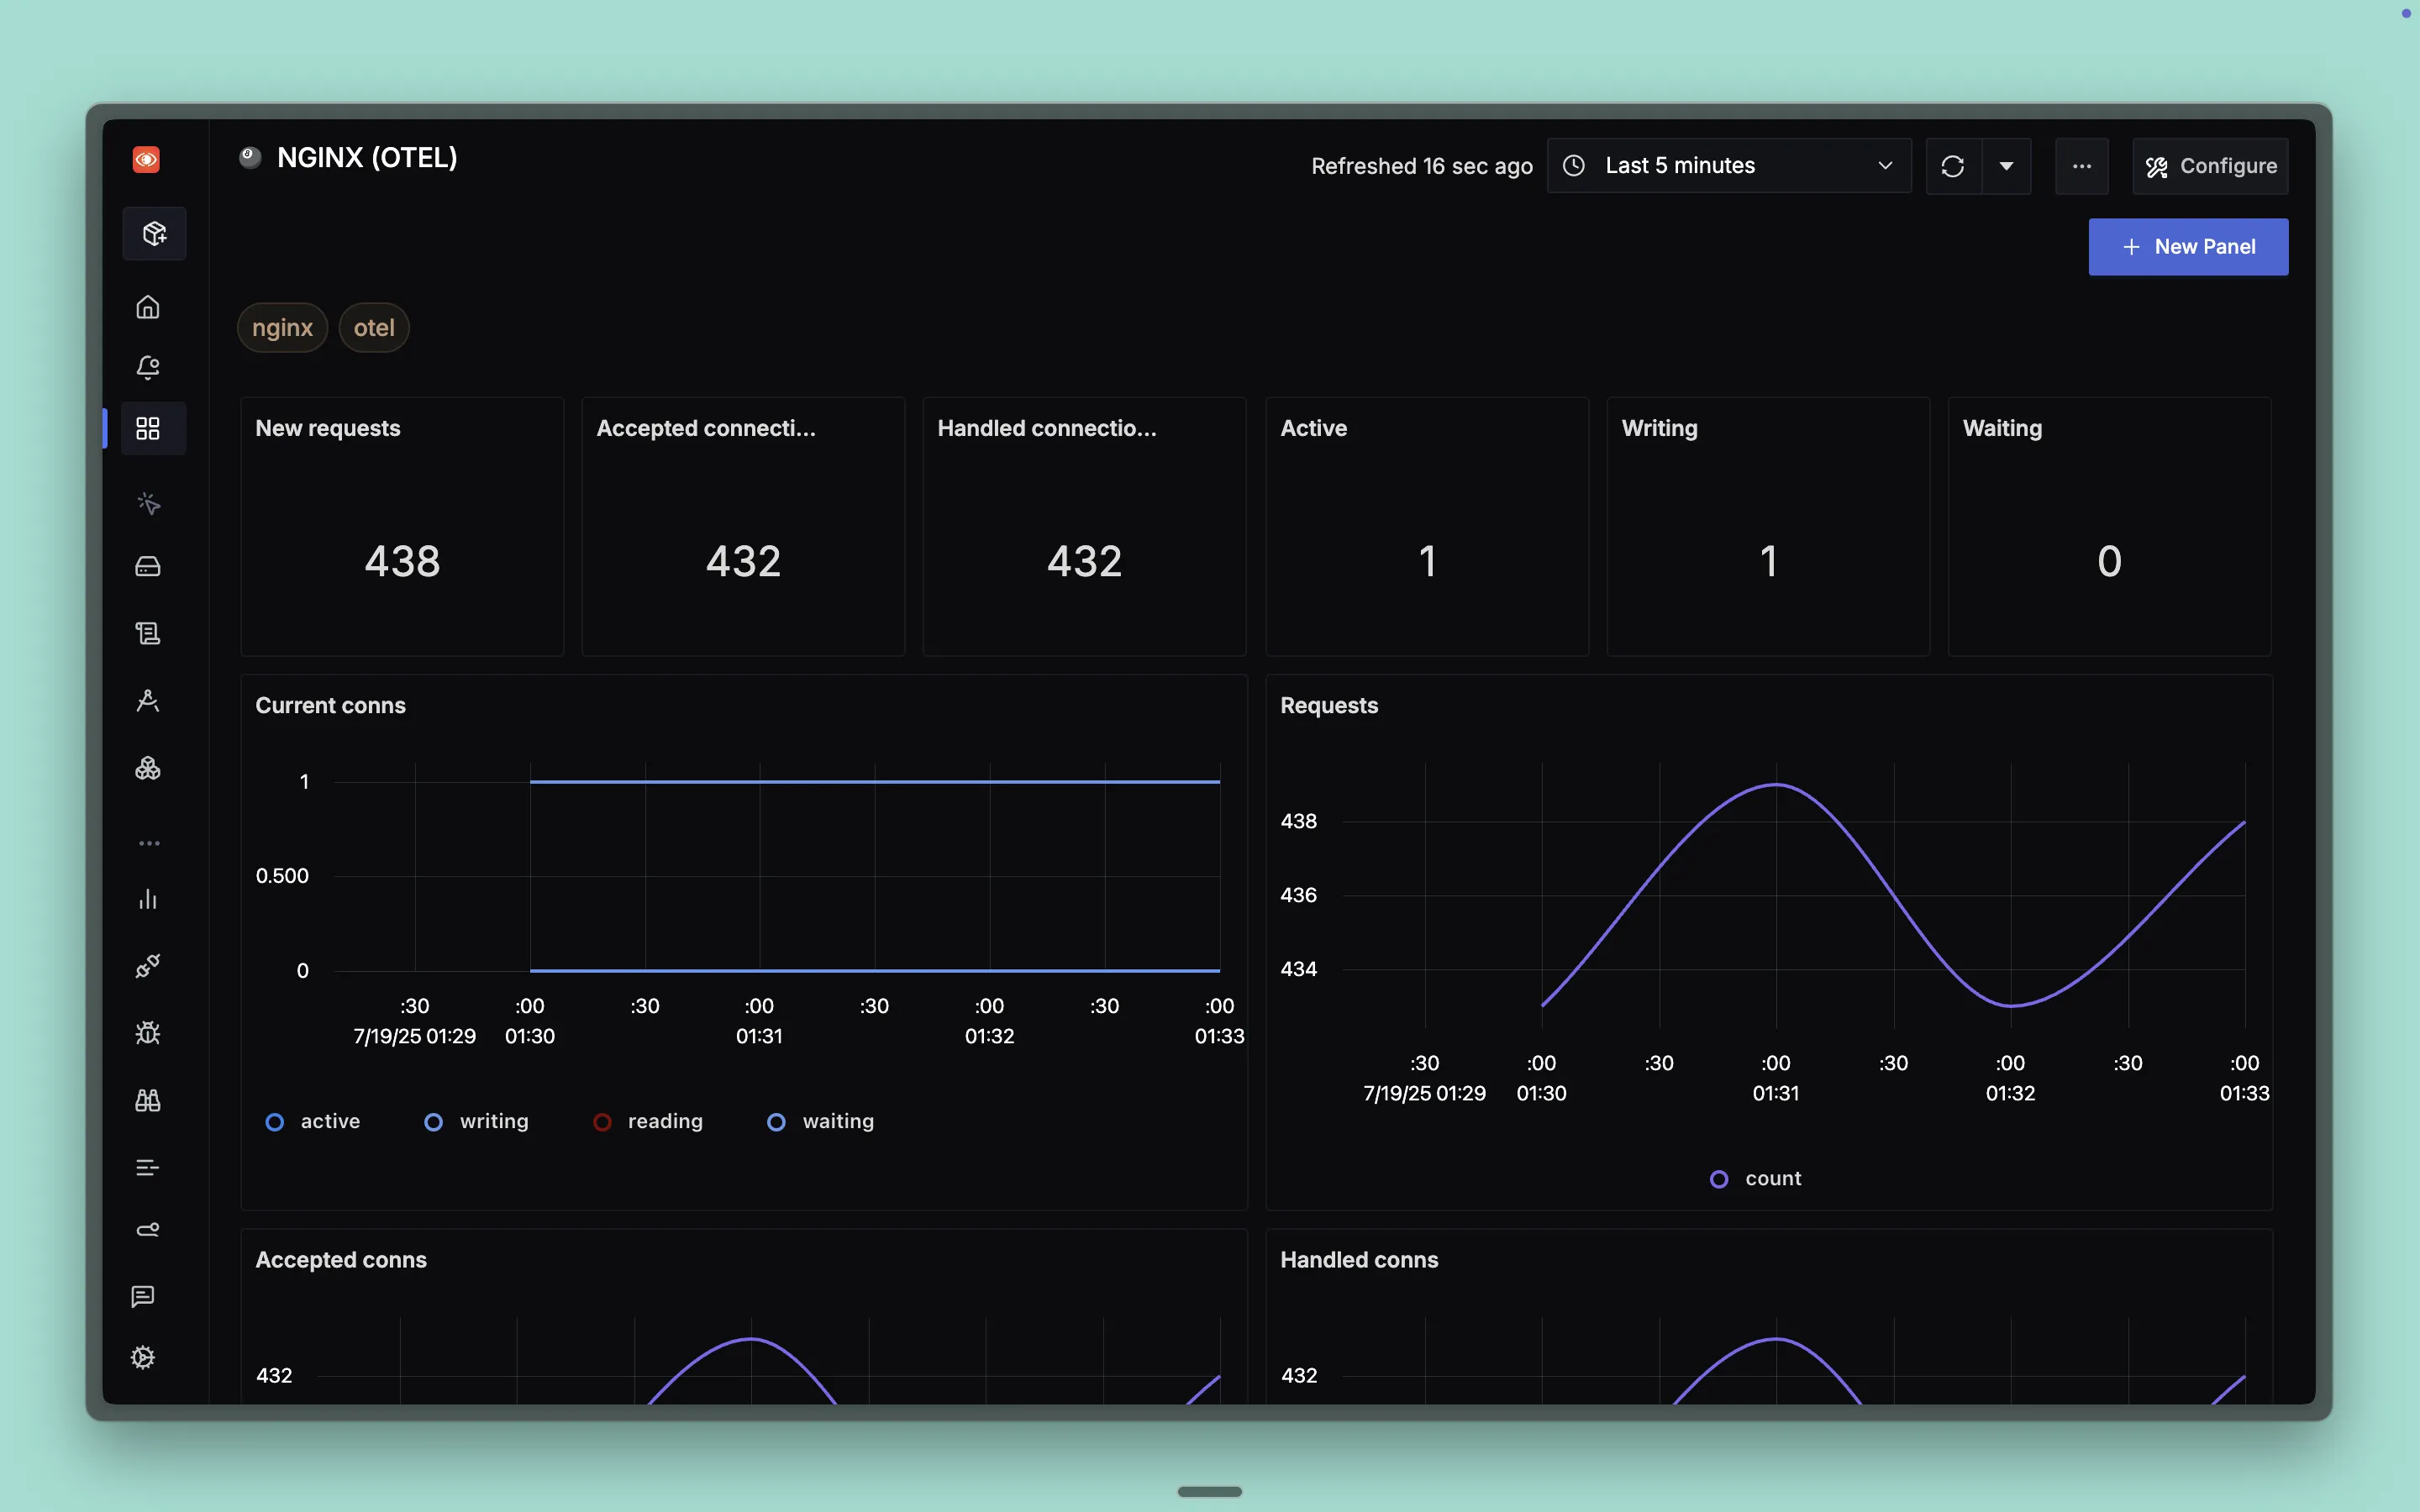
This dashboard provides comprehensive monitoring of NGINX web server performance and connection management using OpenTelemetry metrics, offering detailed visibility into request processing, connection handling, and server state analysis for optimal NGINX performance monitoring.
To use this dashboard, you need to set up the data source and send telemetry to SigNoz. Follow the NGINX Metrics guide to get started.
Dashboard Preview
Dashboards → + New dashboard → Import JSON
What This Dashboard Monitors
This dashboard tracks essential NGINX metrics using OpenTelemetry to help you:
- Monitor Request Processing: Track incoming requests and request handling patterns
- Analyze Connection Management: Monitor connection acceptance, handling, and current states
- Track Server Performance: Monitor active connections and connection states
- Connection State Analysis: Monitor writing, waiting, reading, and active connection states
- Performance Optimization: Identify bottlenecks and optimize server configuration
- Server Health: Monitor overall NGINX server health and throughput
Metrics Included
Overview Metrics (Value Panels)
- New requests: Shows current count of new requests processed
- Accepted connections: Shows current count of accepted connections
- Handled connections: Shows current count of handled connections
- Active: Shows current count of active connections
- Writing: Shows current count of connections in writing state
- Waiting: Shows current count of connections in waiting state
Trend Analysis (Graphs)
- Current conns: Shows current connections over time grouped by connection state (writing, active, reading, waiting)
- Requests: Shows request count trends over time
- Accepted conns: Shows accepted connections trends over time
- Handled conns: Shows handled connections trends over time
OpenTelemetry Integration
This dashboard uses OpenTelemetry metrics for NGINX monitoring, providing:
- Standardized metrics collection using the OpenTelemetry NGINX receiver
- Consistent metric naming following OpenTelemetry conventions
- Native integration with OpenTelemetry-based observability stacks
- Scalable monitoring across multiple NGINX instances


