This dashboard provides comprehensive monitoring of data ingestion volumes into SigNoz, offering detailed visibility into metrics, traces, and logs consumption patterns. It's specifically designed to help with cost optimization by analyzing ingestion volumes and identifying high-volume data sources.
Dashboard Preview
Dashboards → + New dashboard → Import JSON
What This Dashboard Monitors
This dashboard tracks essential ingestion metrics to help you:
- Monitor Data Volume: Track the total volume of metrics, traces, and logs being ingested
- Cost Optimization: Identify high-volume data sources that may impact costs
- Capacity Planning: Understand ingestion patterns for better resource allocation
- Volume Analysis: Break down ingestion by service, environment, and data type
- Ingestion Health: Monitor the health and patterns of your data ingestion pipeline
For controlling data volume, refer to these comprehensive guides:
- Metrics: How to drop metrics
- Logs: How to drop logs
- Traces: How to drop spans
Metrics Included
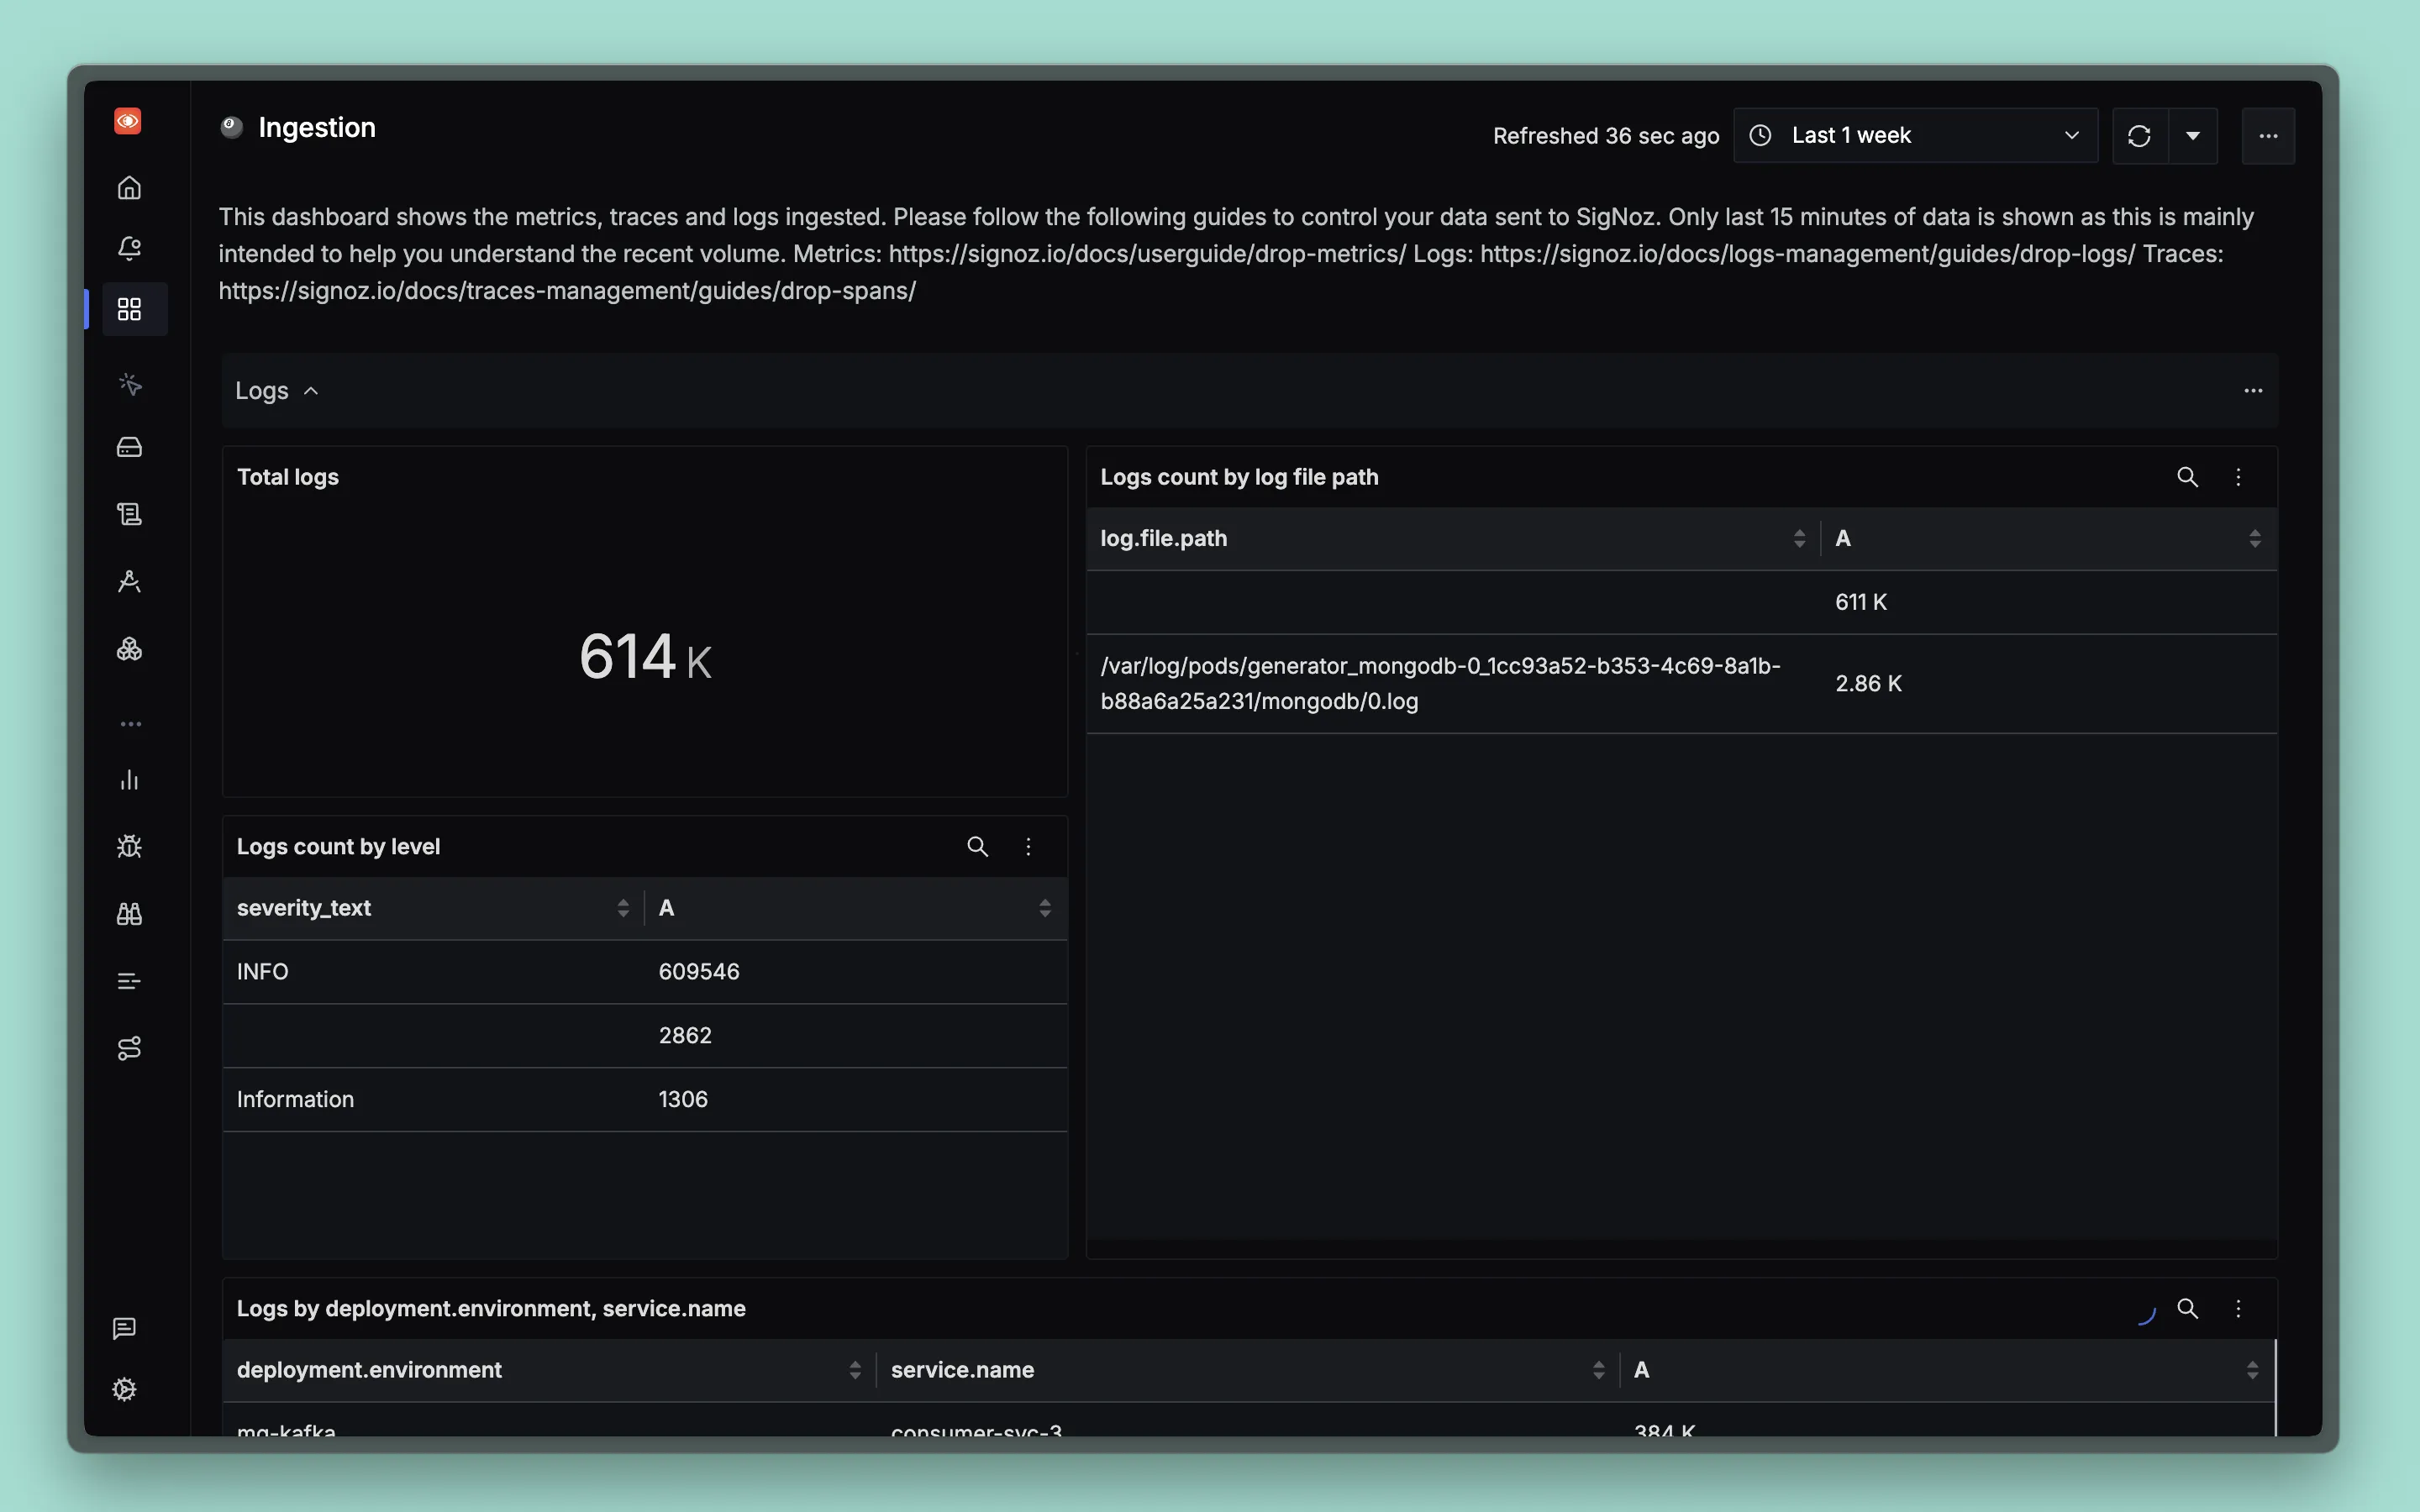
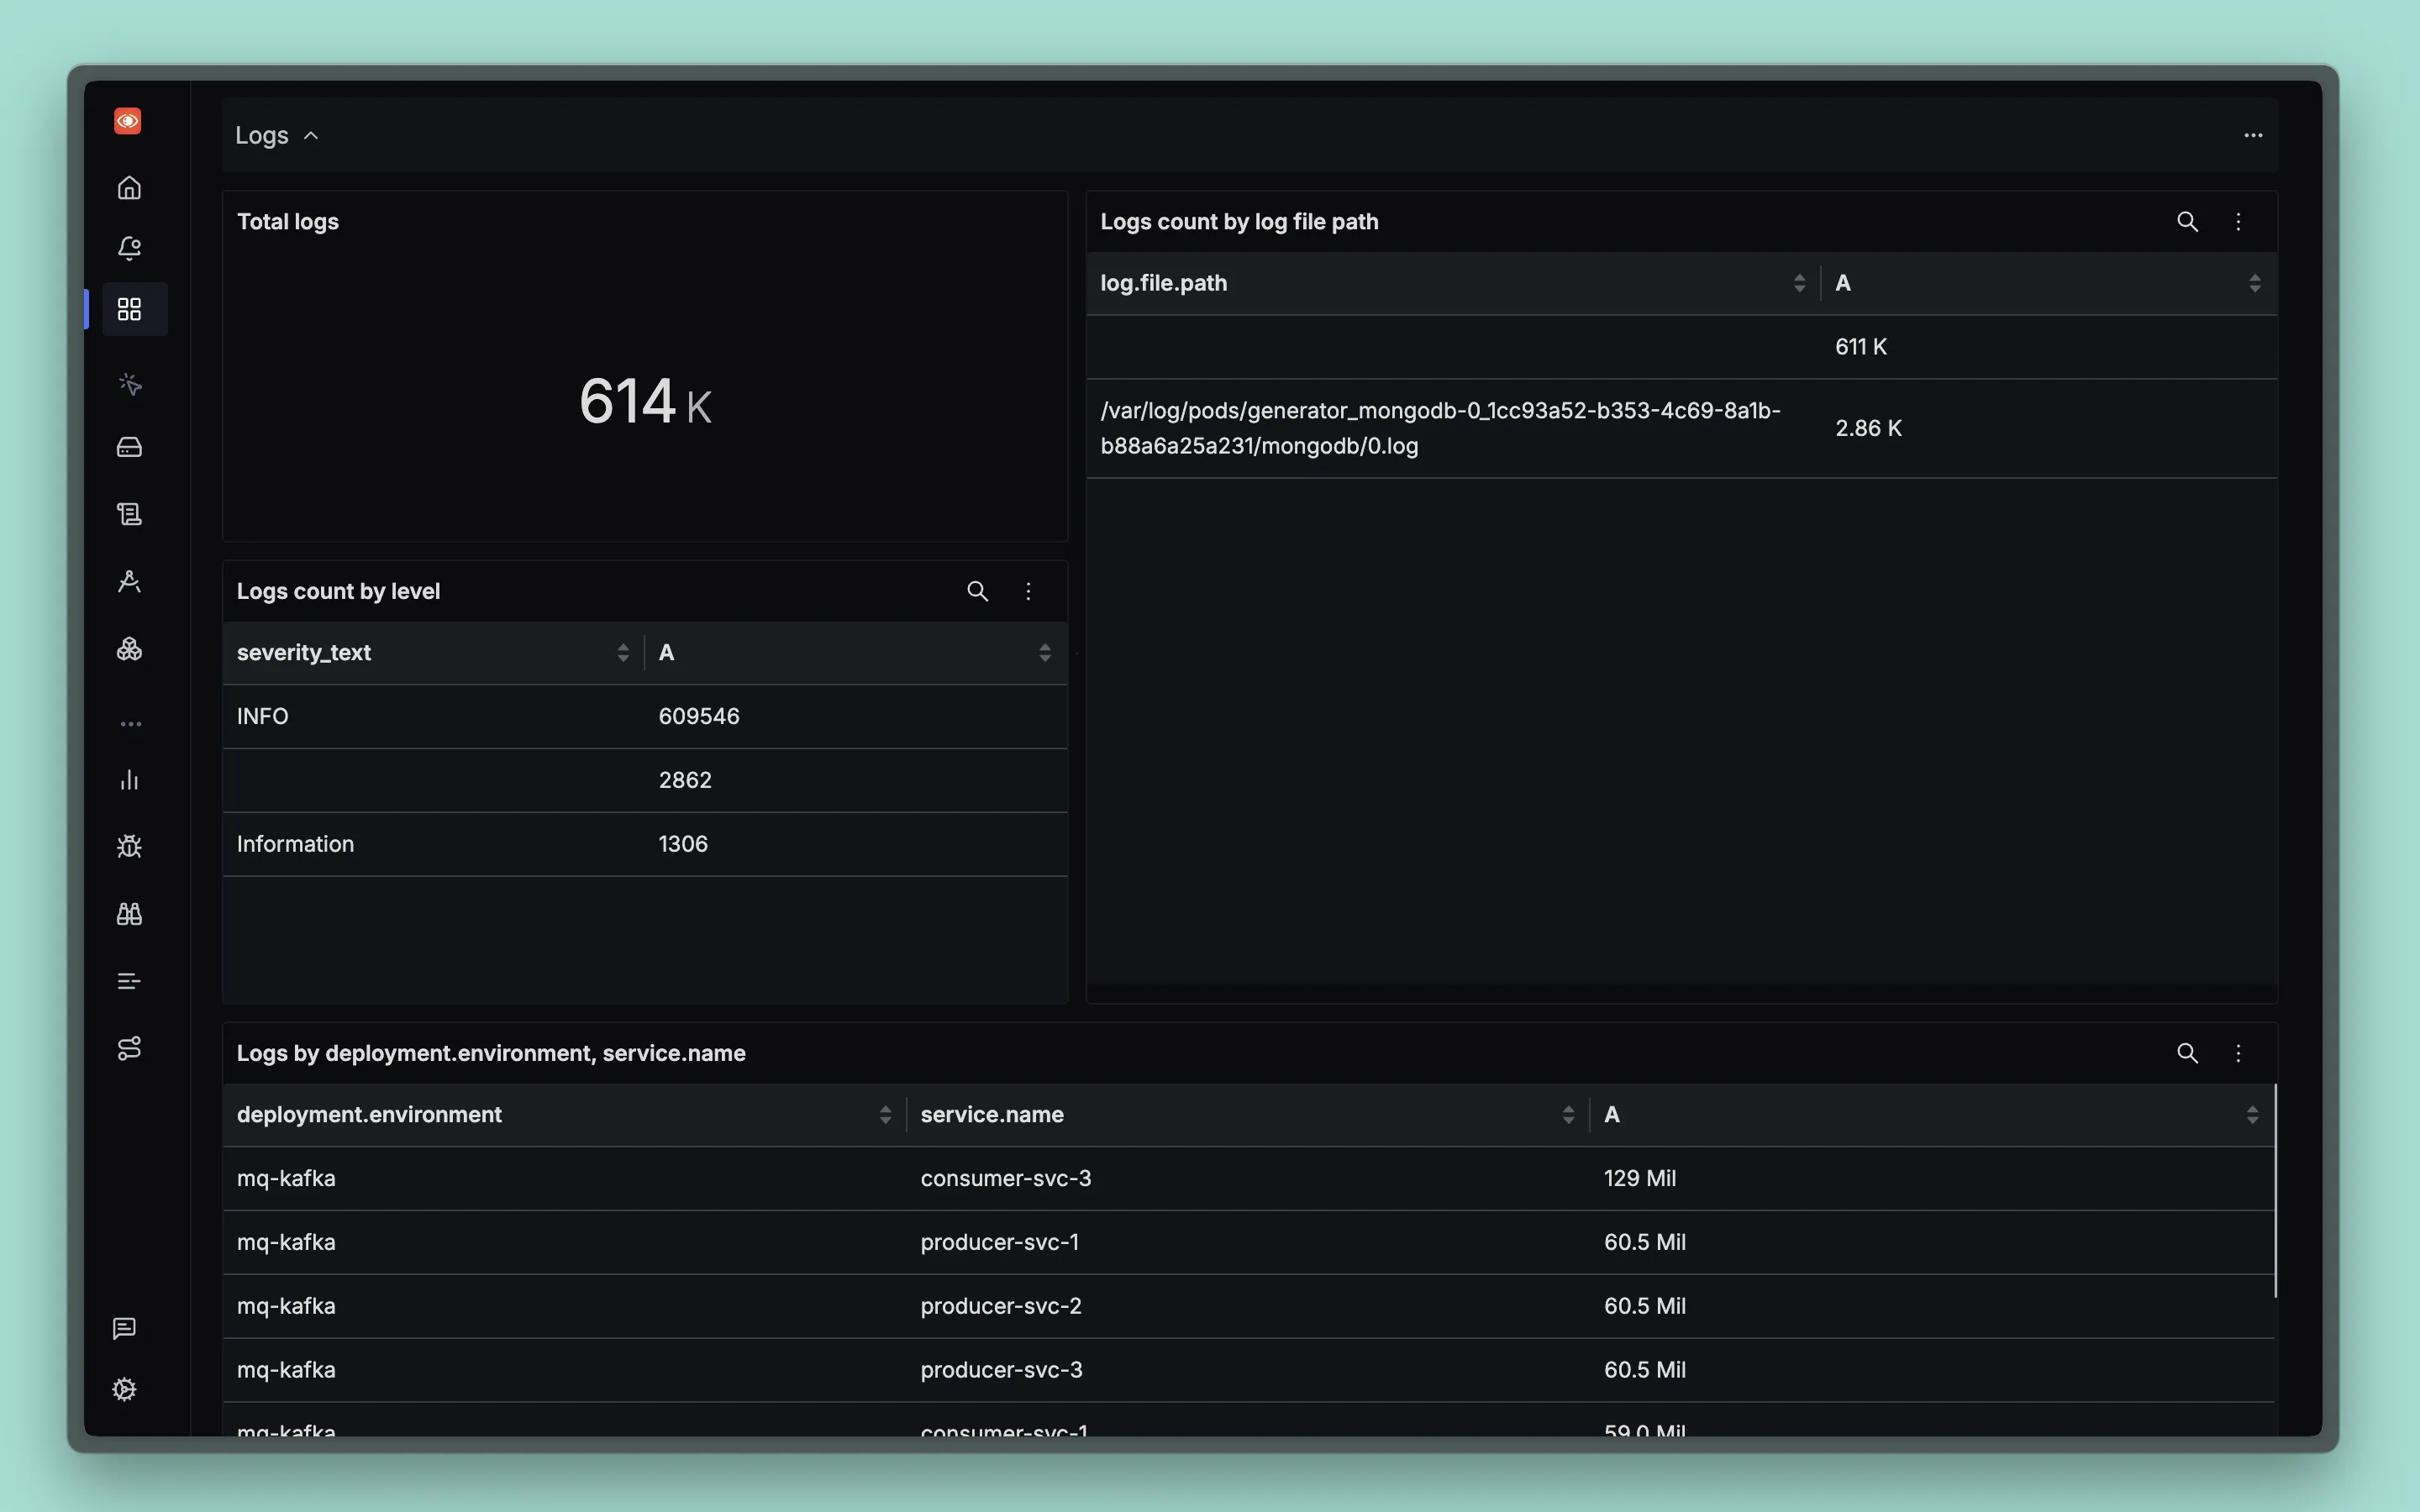
Logs Ingestion
- Total Logs: Total count of log records ingested (605K)
- Logs Count by Level: Distribution of log levels by severity_text (INFO, Information, etc.)
- Logs Count by Log File Path: Volume breakdown by log file sources showing file paths and counts
- Logs by Deployment Environment and Service: Breakdown showing deployment environment, service name, and log counts
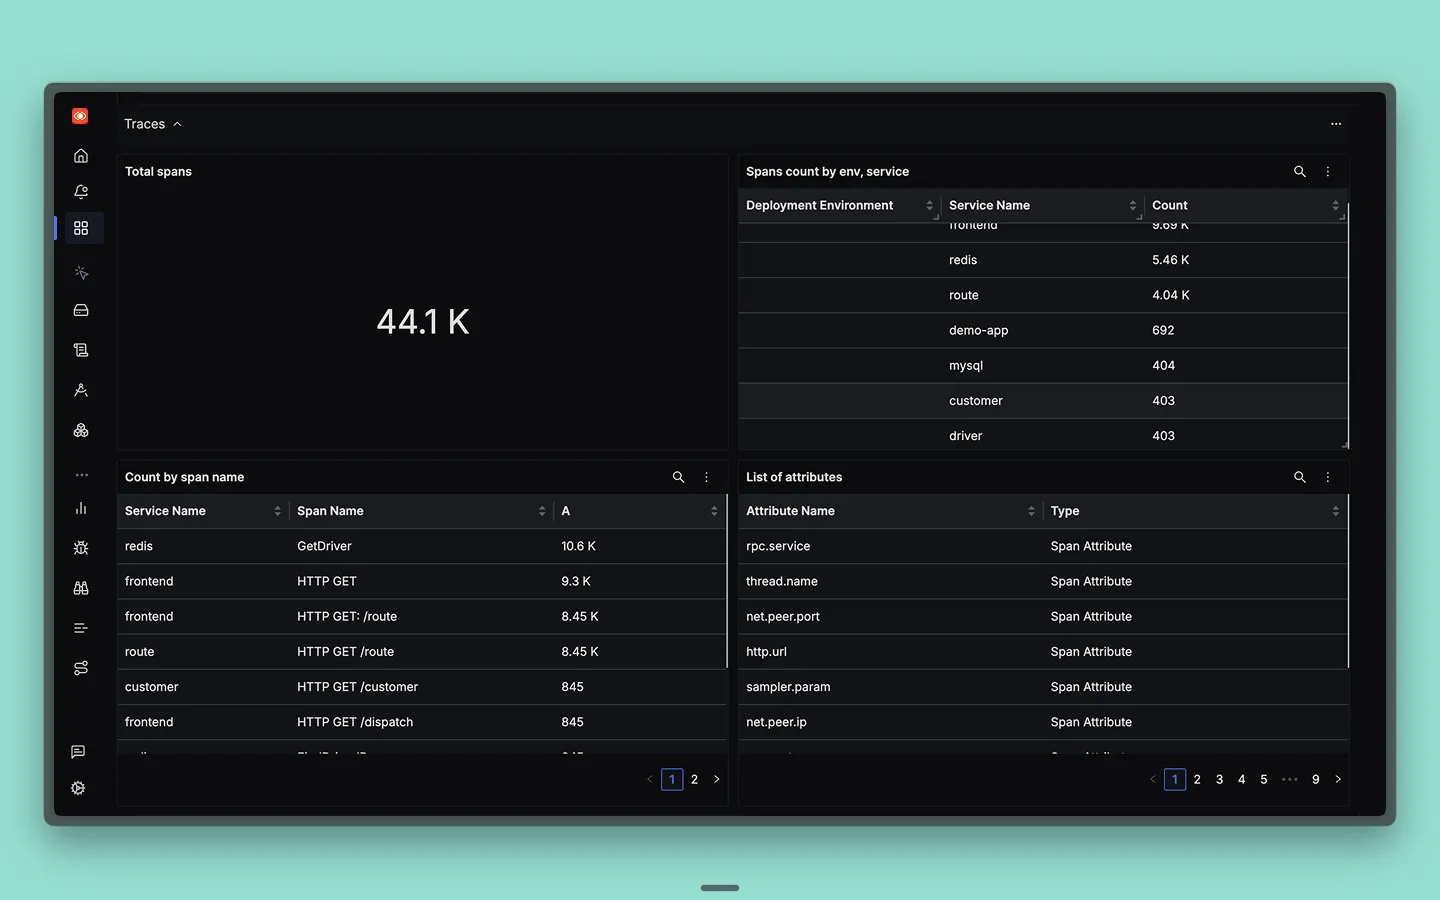
Traces Ingestion
- Total Spans: Total count of spans ingested
- Spans Count by Environment and Service: Breakdown of span volume by environment and service
- Count by Span Name: Volume analysis per span name/operation
- List of Attributes: Comprehensive table showing all span attributes and resource attributes with their types (Span Attribute, Span Resource Attribute, Log Resource Attribute)
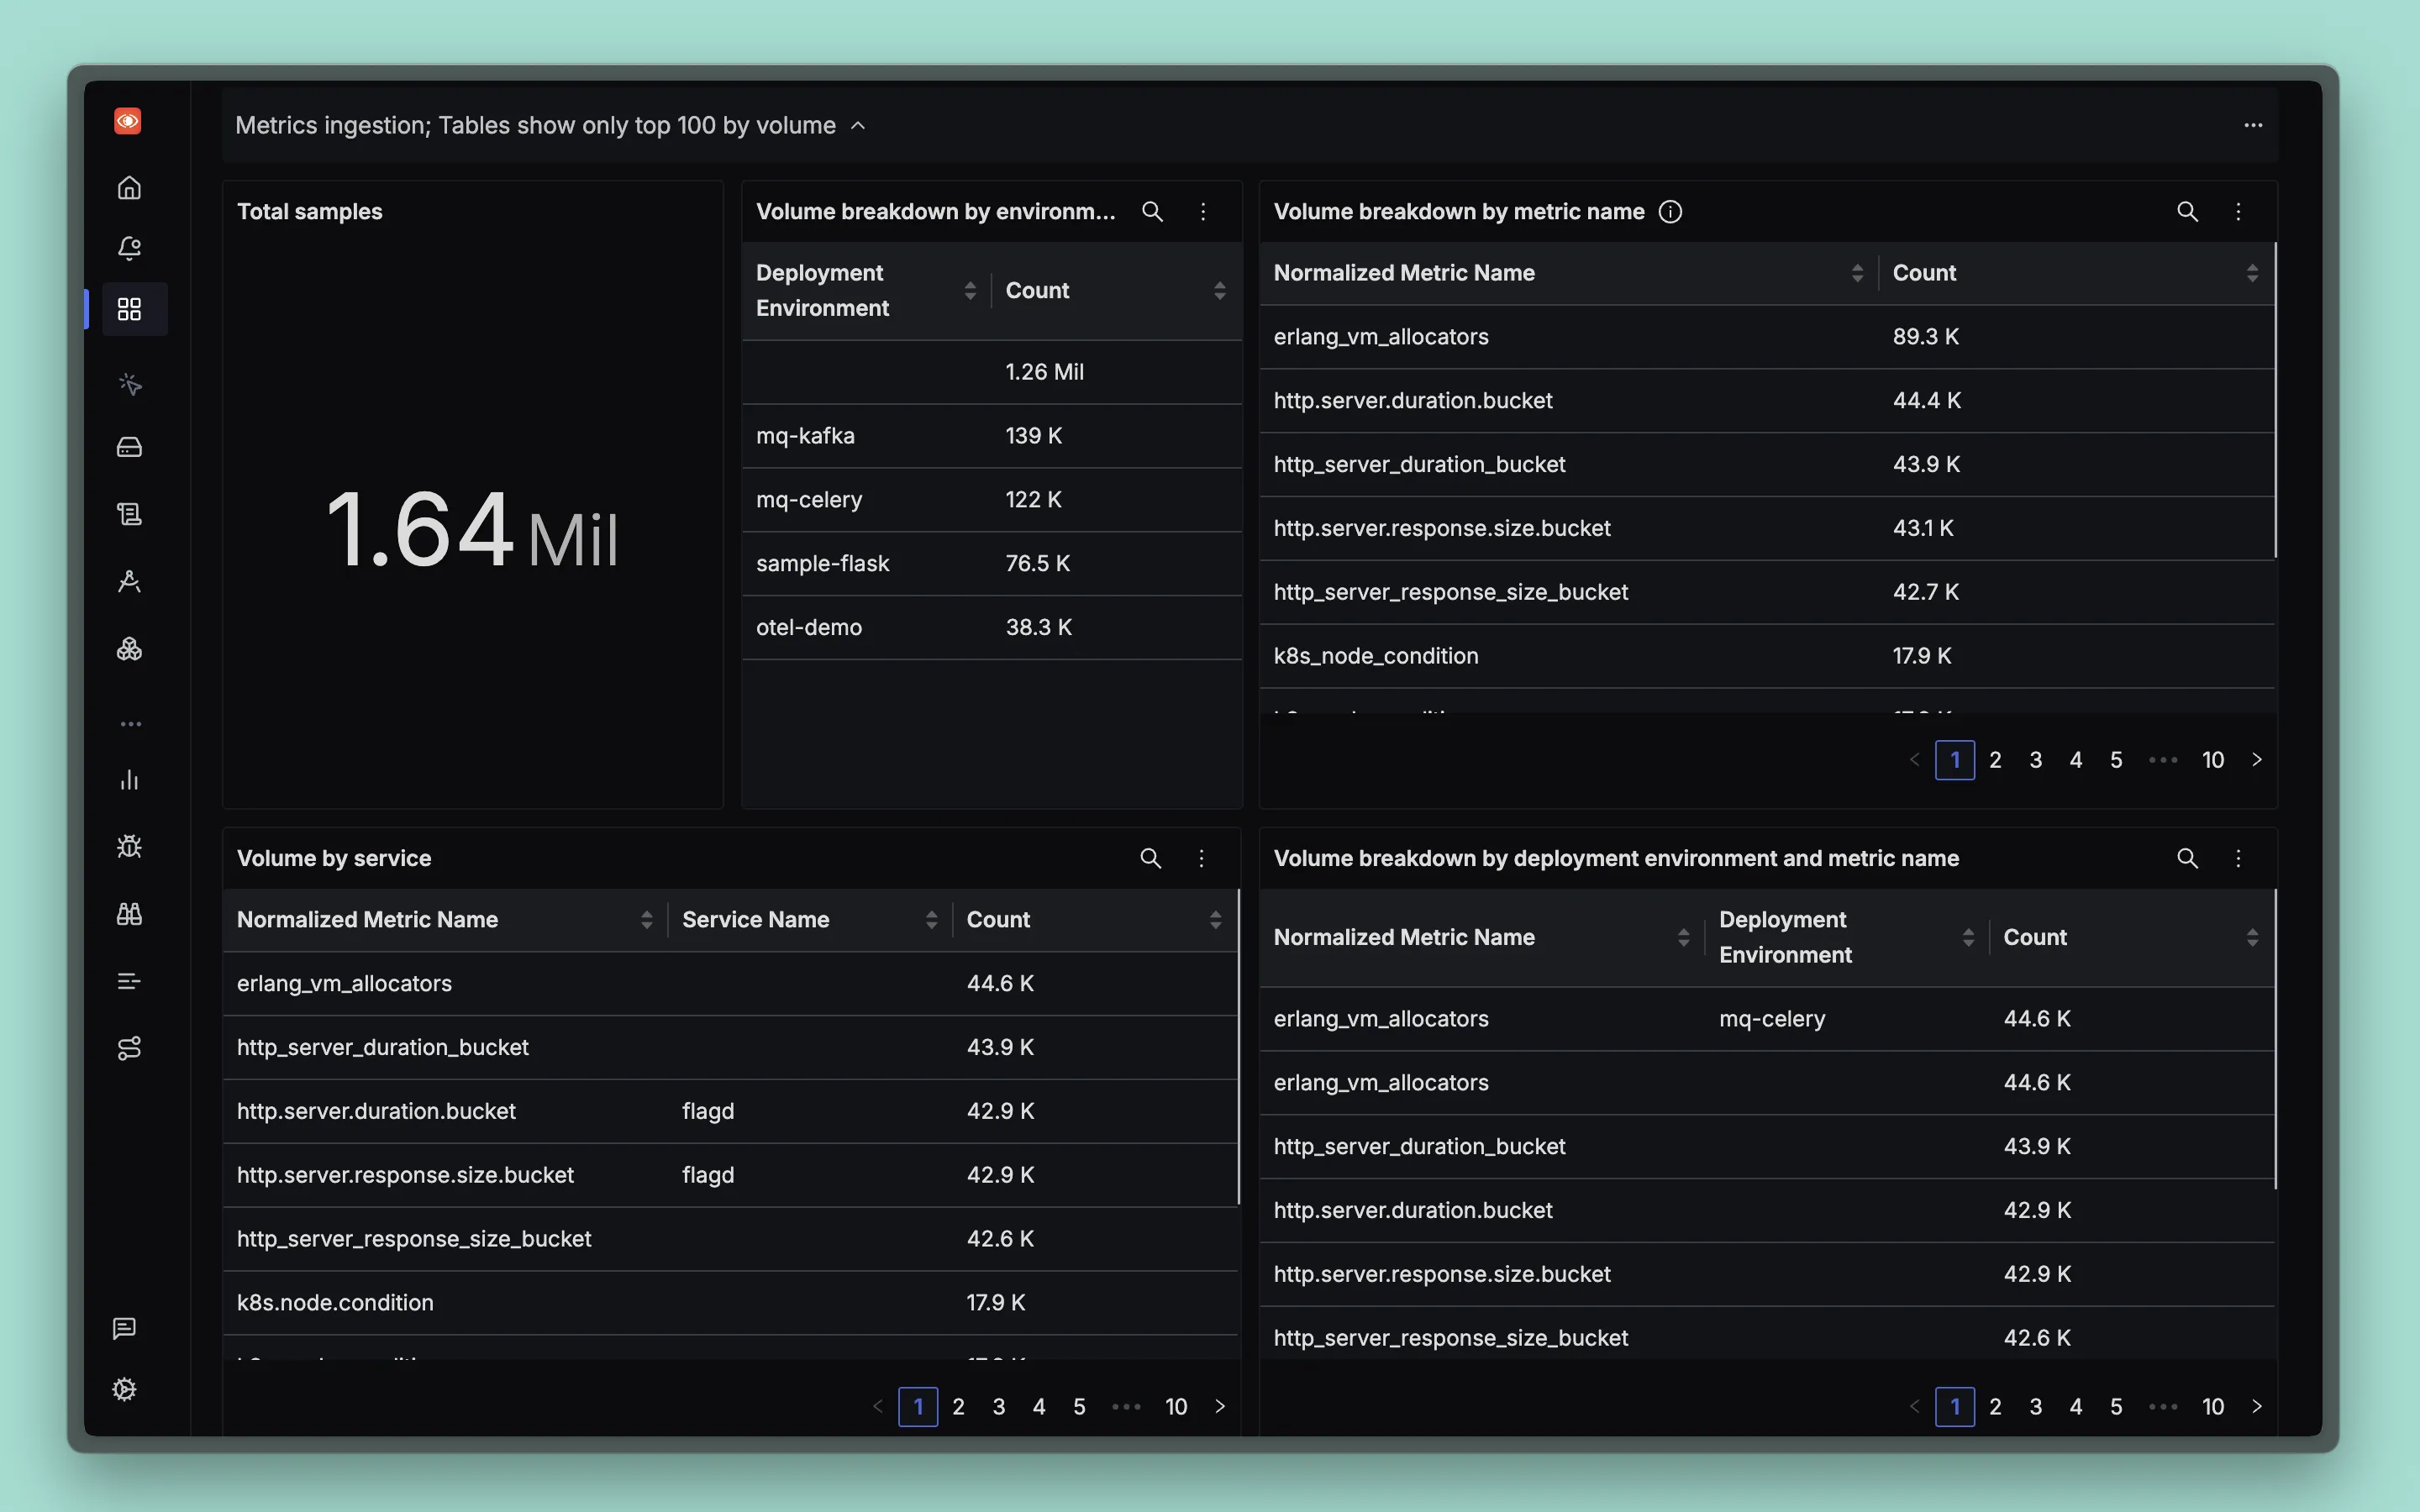
Metrics Ingestion
- Total Samples: Total count of metric samples ingested (1.63 Mil)
- Volume Breakdown by Environment: Table showing deployment environment and sample counts
- Volume Breakdown by Metric Name: Table showing normalized metric names and their sample counts (top 100 metrics by volume)
- Volume by Service: Table showing metric names, service names, and counts
- Volume Breakdown by Deployment Environment and Metric Name: Combined breakdown showing environment, metric name, and sample counts
- The Observed Report Interval for (Metric, Service) Combination: Table showing deployment environment, metric name, service name, and reporting intervals in seconds
- Is My Cluster/Node/Namespace Sending Metric?: Table checking if Kubernetes components are sending metrics with cluster, node, and namespace details
- Is My Host Sending Metric?: Table showing host-level metrics to verify metric collection from specific hosts
Important Notes
- Time Window: Dashboard shows only the last 15 minutes of data for focused analysis
- Volume Limits: Tables show top 100 entries by volume to focus on highest impact sources
- Real-time Focus: Designed for understanding current ingestion patterns rather than historical analysis
