This dashboard provides comprehensive monitoring of Vercel AI SDK performance using OpenTelemetry metrics, offering detailed visibility into latency, token usage, generation rates, and latent request tracking for optimal AI workload monitoring and performance tuning.
📝 Note
To use this dashboard, you need to set up the data source and send telemetry to SigNoz. Follow the Vercel AI SDK Observability guide to get started.
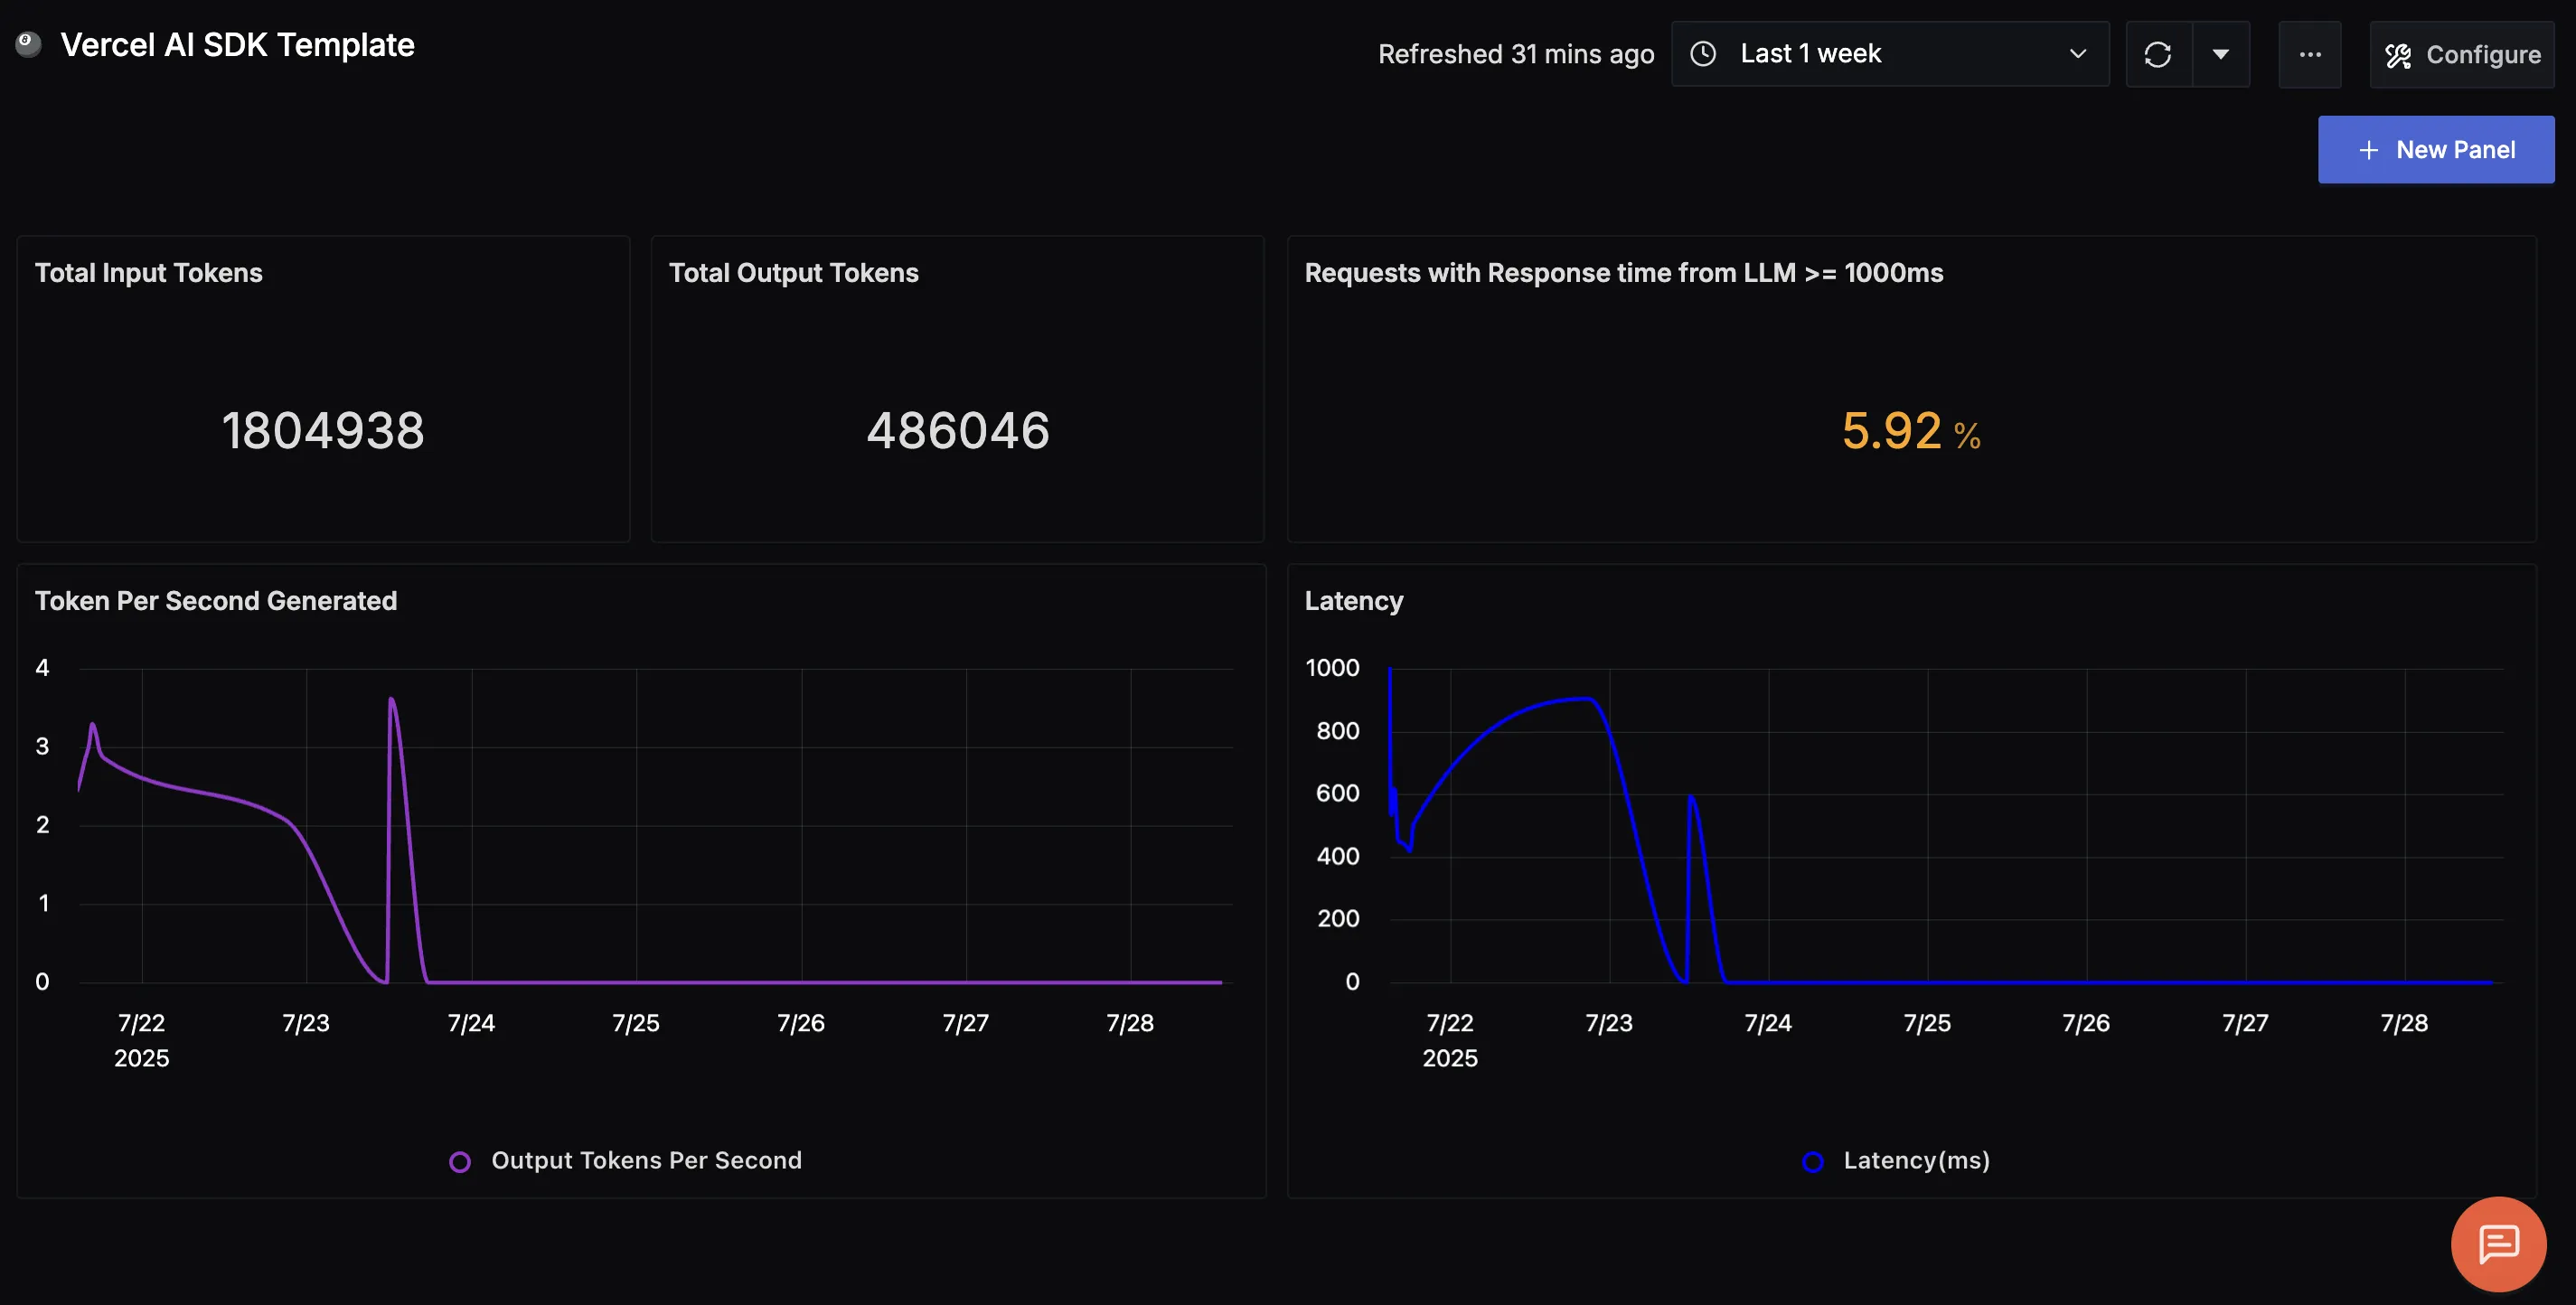
Dashboard Preview
Dashboards → + New dashboard → Import JSON
What This Dashboard Monitors
This dashboard tracks critical performance metrics for your LLM application using OpenTelemetry to help you:
- Monitor Token Usage: Track the total number of input and output tokens processed by your application to understand workload volume.
- Analyze Throughput Efficiency: Monitor connection acceptance, handling, and current states
- Track Server Performance: Visualize the rate of token generation over time to assess performance trends.
- Track Latency Behavior: Measure request latency, including p99 latency and high-latency request percentages—to identify and address performance slowdowns.
- Identify Bottlenecks: Spot token generation or latency inefficiencies and use historical patterns to guide optimization.
- Ensure Application Responsiveness: Monitor the percentage of slow responses (>=1000ms) to maintain reliable LLM performance and user experience.
Metrics Included
Overview Metrics (Value Panels)
- Total Input Tokens: Displays the total number of input tokens sent to the LLM within the selected time frame.
- Total Output Tokens: Displays the total number of output tokens generated by the LLM in the selected time frame.
- % of Requests ≥ 1000ms: Shows the percentage of requests with latency ≥ 1000ms; the value turns orange above 5% and red above 10% to highlight degradation.
Trend Analysis (Graphs)
- Tokens Per Second Generated: A line graph showing the average number of tokens generated per second, helping visualize LLM throughput efficiency.
- Latency (p99): A time-series chart showing the 99th percentile latency in milliseconds across all LLM requests, highlighting peak delay patterns.
- Number of Requests Given Time Frame: A time-series chart showing the number of requests over time, helping to understand request patterns and traffic trends.
- Model Provider Distribution: A pie chart showing the distribution of model providers used in your Vercel AI applications (e.g., OpenAI, Anthropic).
- LLM Model Distribution: A pie chart showing the distribution of specific models used (e.g., gpt-4o-nano, gpt-4o-mini).
- Services and Languages Using Vercel AI SDK: A table providing an overview of the various services and their respective programming languages that utilize the Vercel AI SDK.
