Histogram Panel Type
Histogram
A Histogram is a plot chart that shows the frequency distribution of a set of measurements. This helps in identifying the distribution of data, skewness, etc.
This panel type allows users to create a chart where the data is grouped into buckets (such as “40 to 49”, “50 to 59”, etc.), and then plotted as bars. Similar to a Bar Graph, but in a Histogram, each bar represents a range of data. The panel type allows the user to control the number of bins, and will automatically calculate the size of each bin accordingly.
Data Formats
Support signals
- Logs
- Traces
- Metrics
This panel type supports any time series data. The time series data can be from logs, traces, or metrics.
Examples
One Series
The following table shows the requests per second (req/s) for a service over a period of time.
Show table
| Timestamp | Value |
|---|---|
| 2024-06-06 00:27:00 | 46.68333333333333 |
| 2024-06-06 00:28:00 | 49.88333333333333 |
| 2024-06-06 00:29:00 | 45.61666666666667 |
| 2024-06-06 00:30:00 | 44.9 |
| 2024-06-06 00:31:00 | 50.5 |
| 2024-06-06 00:32:00 | 45.15 |
| 2024-06-06 00:33:00 | 47.983333333333334 |
| 2024-06-06 00:34:00 | 46.016666666666666 |
| 2024-06-06 00:35:00 | 46.85 |
| 2024-06-06 00:36:00 | 46 |
| 2024-06-06 00:37:00 | 48.81666666666667 |
| 2024-06-06 00:38:00 | 42.93333333333333 |
| 2024-06-06 00:39:00 | 44.6 |
| 2024-06-06 00:40:00 | 47.43333333333333 |
| 2024-06-06 00:41:00 | 44.6 |
| 2024-06-06 00:42:00 | 42.63333333333333 |
| 2024-06-06 00:43:00 | 46.53333333333333 |
| 2024-06-06 00:44:00 | 46.9 |
| 2024-06-06 00:45:00 | 43.4 |
| 2024-06-06 00:46:00 | 47.28333333333333 |
| 2024-06-06 00:47:00 | 46.833333333333336 |
| 2024-06-06 00:48:00 | 47.65 |
| 2024-06-06 00:49:00 | 44.6 |
| 2024-06-06 00:50:00 | 43.766666666666666 |
| 2024-06-06 00:51:00 | 46.583333333333336 |
| 2024-06-06 00:52:00 | 47.13333333333333 |
| 2024-06-06 00:53:00 | 46.85 |
| 2024-06-06 00:54:00 | 47.96666666666667 |
| 2024-06-06 00:55:00 | 44.61666666666667 |
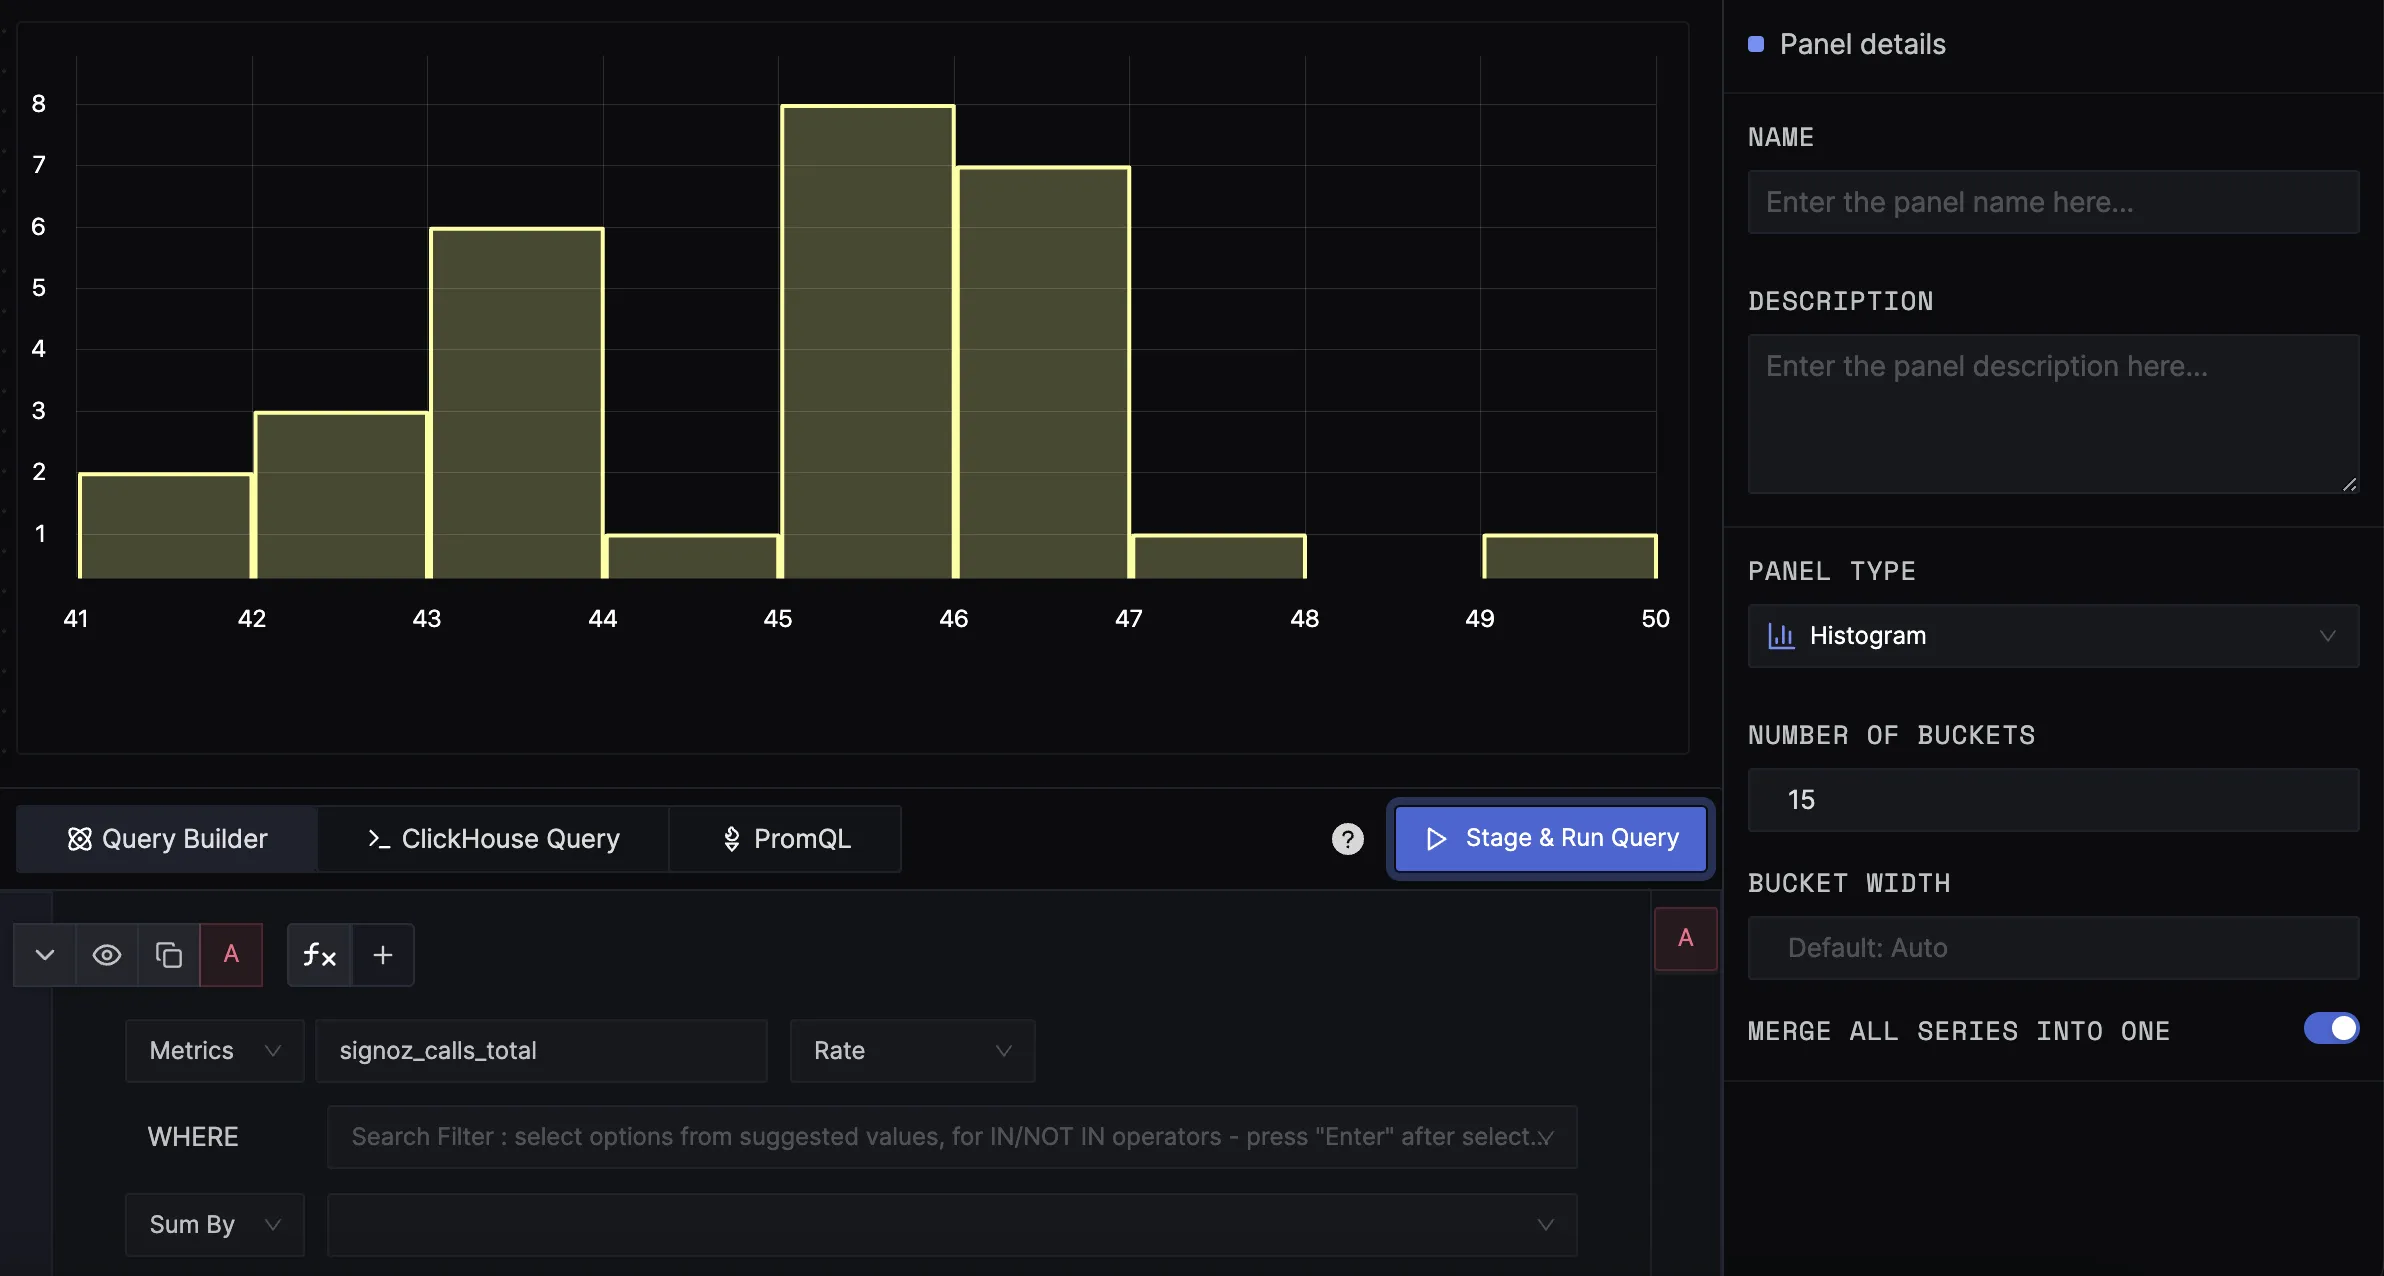
When configured to use 15 buckets, the chart is rendered as follows:

Multiple Series
The following tables show the requests per second (RPS) by status code over time.
- Series with STATUS_CODE_UNSET
Show table for Series with STATUS_CODE_UNSET
| Timestamp | Value |
|---|---|
| 2024-06-06 00:38:00 | 40.8 |
| 2024-06-06 00:39:00 | 42.4 |
| 2024-06-06 00:40:00 | 45.05 |
| 2024-06-06 00:41:00 | 42.4 |
| 2024-06-06 00:42:00 | 40.55 |
| 2024-06-06 00:43:00 | 44.2 |
| 2024-06-06 00:44:00 | 44.6 |
| 2024-06-06 00:45:00 | 41.233333333333334 |
| 2024-06-06 00:46:00 | 44.95 |
| 2024-06-06 00:47:00 | 44.5 |
| 2024-06-06 00:48:00 | 45.31666666666667 |
| 2024-06-06 00:49:00 | 42.4 |
| 2024-06-06 00:50:00 | 41.6 |
| 2024-06-06 00:51:00 | 44.25 |
| 2024-06-06 00:52:00 | 44.8 |
| 2024-06-06 00:53:00 | 44.55 |
| 2024-06-06 00:54:00 | 45.6 |
| 2024-06-06 00:55:00 | 44.61666666666667 |
| 2024-06-06 00:56:00 | 44.8 |
| 2024-06-06 00:57:00 | 43.3 |
| 2024-06-06 00:58:00 | 42.36666666666667 |
| 2024-06-06 00:59:00 | 41.53333333333333 |
| 2024-06-06 01:00:00 | 48 |
| 2024-06-06 01:01:00 | 42.233333333333334 |
| 2024-06-06 01:02:00 | 40.45 |
| 2024-06-06 01:03:00 | 48.7 |
| 2024-06-06 01:04:00 | 43.88333333333333 |
| 2024-06-06 01:05:00 | 46.333333333333336 |
| 2024-06-06 01:06:00 | 49.6 |
- Series with STATUS_CODE_ERROR
Show table for Series with STATUS_CODE_ERROR
| Timestamp | Value |
|---|---|
| 2024-06-06 00:38:00 | 2.1333333333333333 |
| 2024-06-06 00:39:00 | 2.2 |
| 2024-06-06 00:40:00 | 2.3833333333333333 |
| 2024-06-06 00:41:00 | 2.2 |
| 2024-06-06 00:42:00 | 2.0833333333333335 |
| 2024-06-06 00:43:00 | 2.3333333333333335 |
| 2024-06-06 00:44:00 | 2.3 |
| 2024-06-06 00:45:00 | 2.1666666666666665 |
| 2024-06-06 00:46:00 | 2.3333333333333335 |
| 2024-06-06 00:47:00 | 2.3333333333333335 |
| 2024-06-06 00:48:00 | 2.3333333333333335 |
| 2024-06-06 00:49:00 | 2.2 |
| 2024-06-06 00:50:00 | 2.1666666666666665 |
| 2024-06-06 00:51:00 | 2.3333333333333335 |
| 2024-06-06 00:52:00 | 2.3333333333333335 |
| 2024-06-06 00:53:00 | 2.3 |
| 2024-06-06 00:54:00 | 2.3666666666666667 |
| 2024-06-06 00:55:00 | 2.216666666666667 |
| 2024-06-06 00:56:00 | 2.3333333333333335 |
| 2024-06-06 00:57:00 | 2.2666666666666666 |
| 2024-06-06 00:58:00 | 2.2 |
| 2024-06-06 00:59:00 | 2.15 |
| 2024-06-06 01:00:00 | 2.5 |
| 2024-06-06 01:01:00 | 2.216666666666667 |
| 2024-06-06 01:02:00 | 2.1166666666666667 |
| 2024-06-06 01:03:00 | 2.533333333333333 |
| 2024-06-06 01:04:00 | 2.2666666666666666 |
| 2024-06-06 01:05:00 | 2.4166666666666665 |
| 2024-06-06 01:06:00 | 2.5833333333333335 |
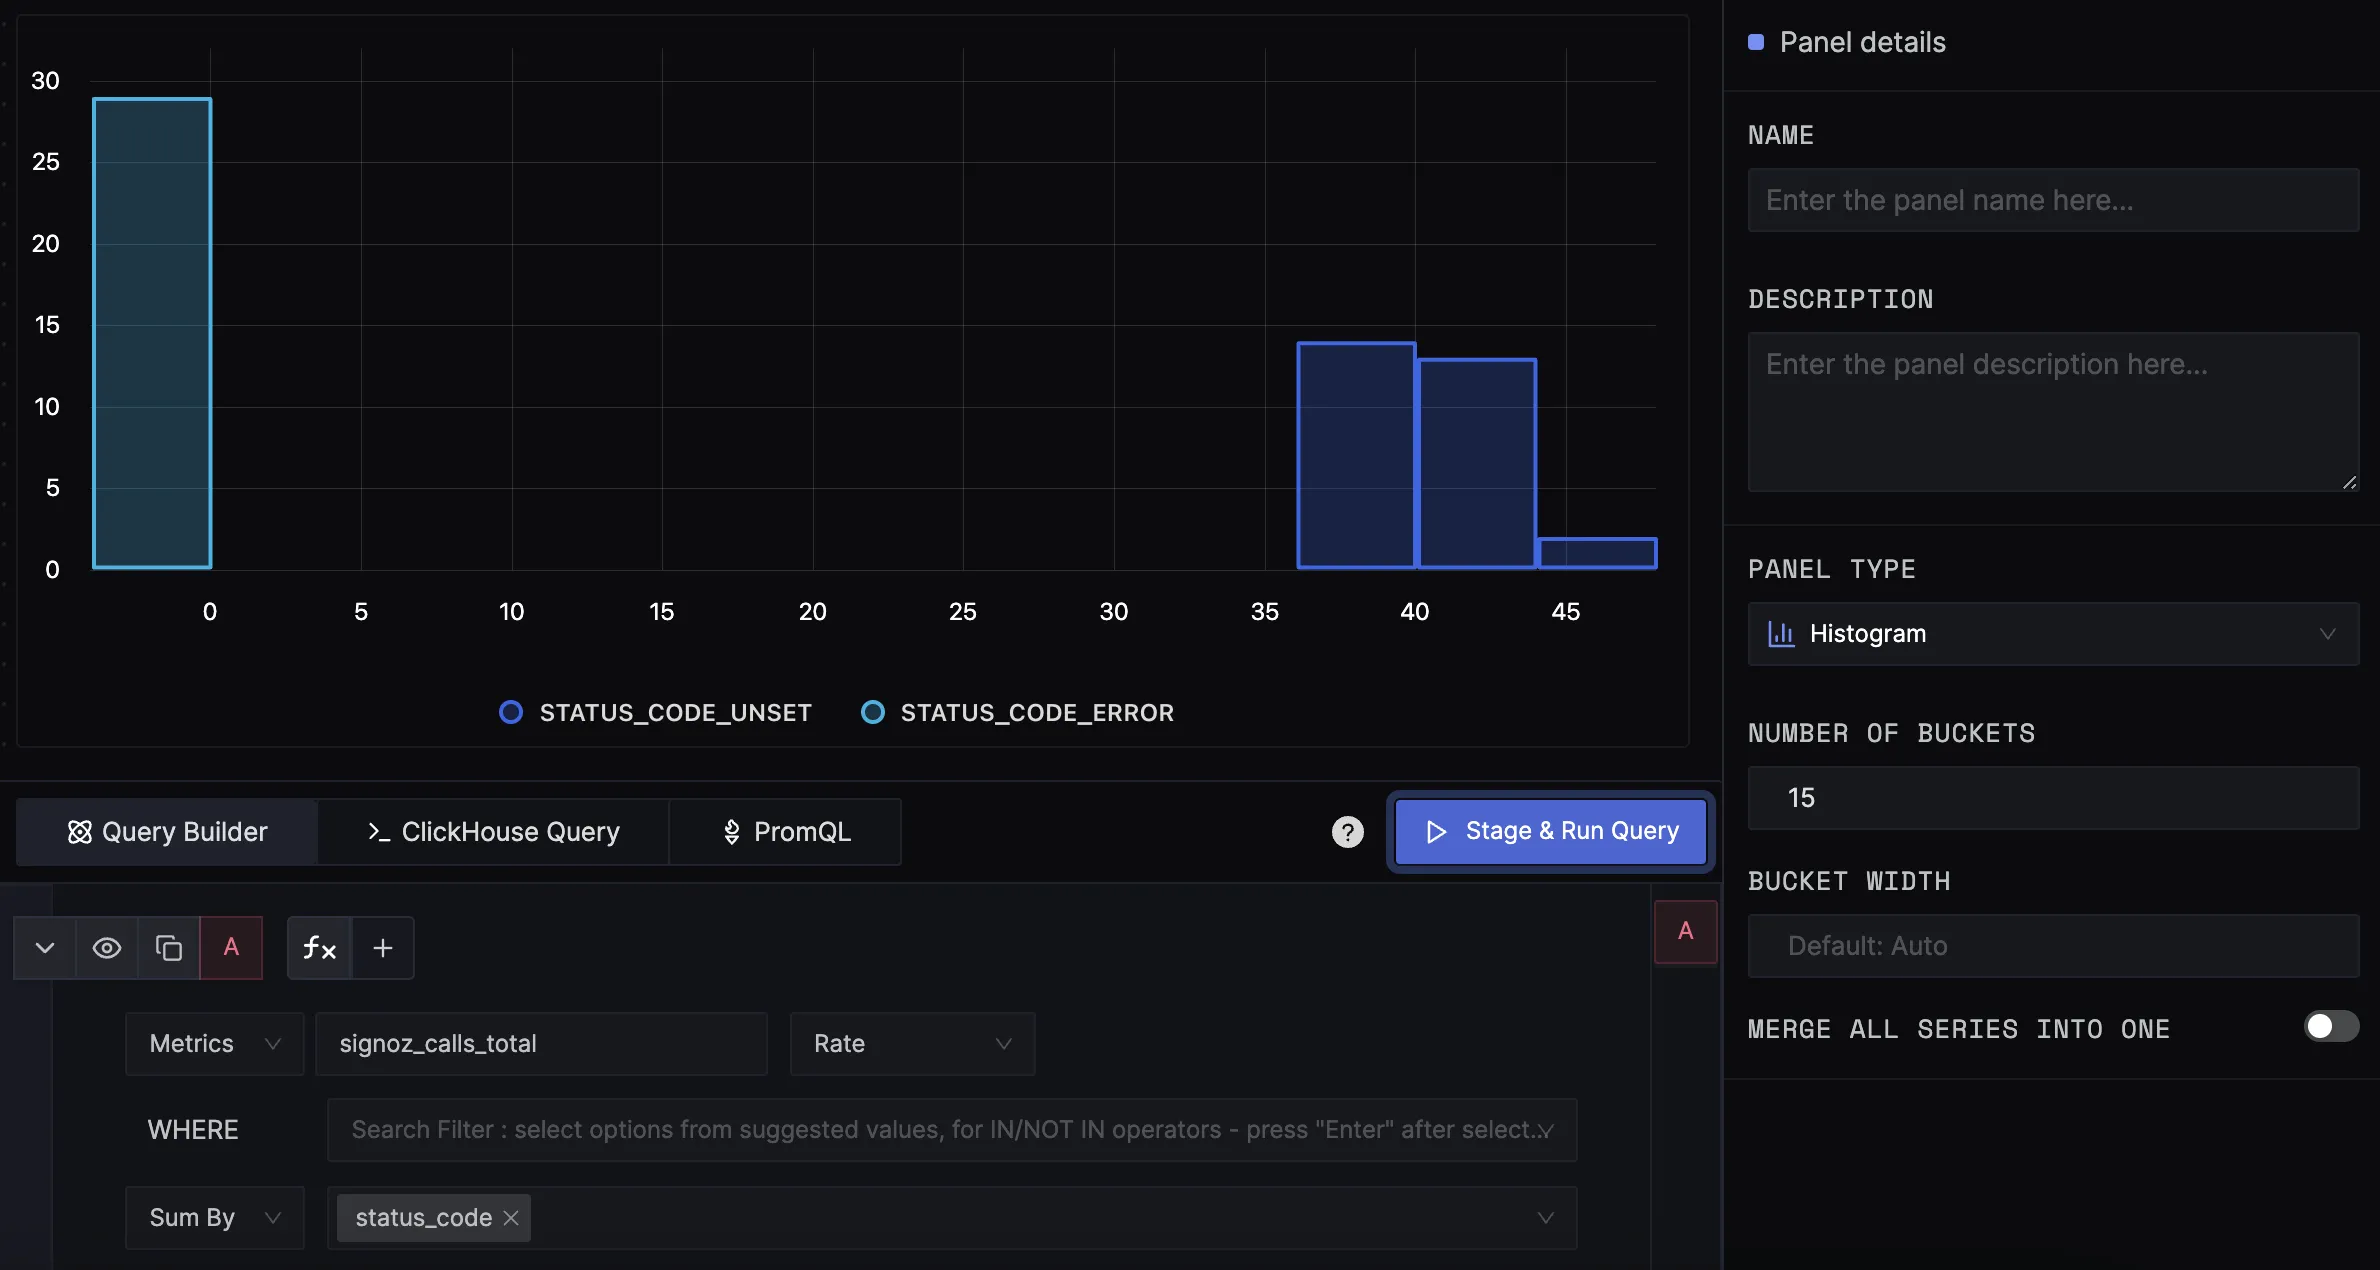
When configured to use 15 buckets, the chart is rendered as follows:

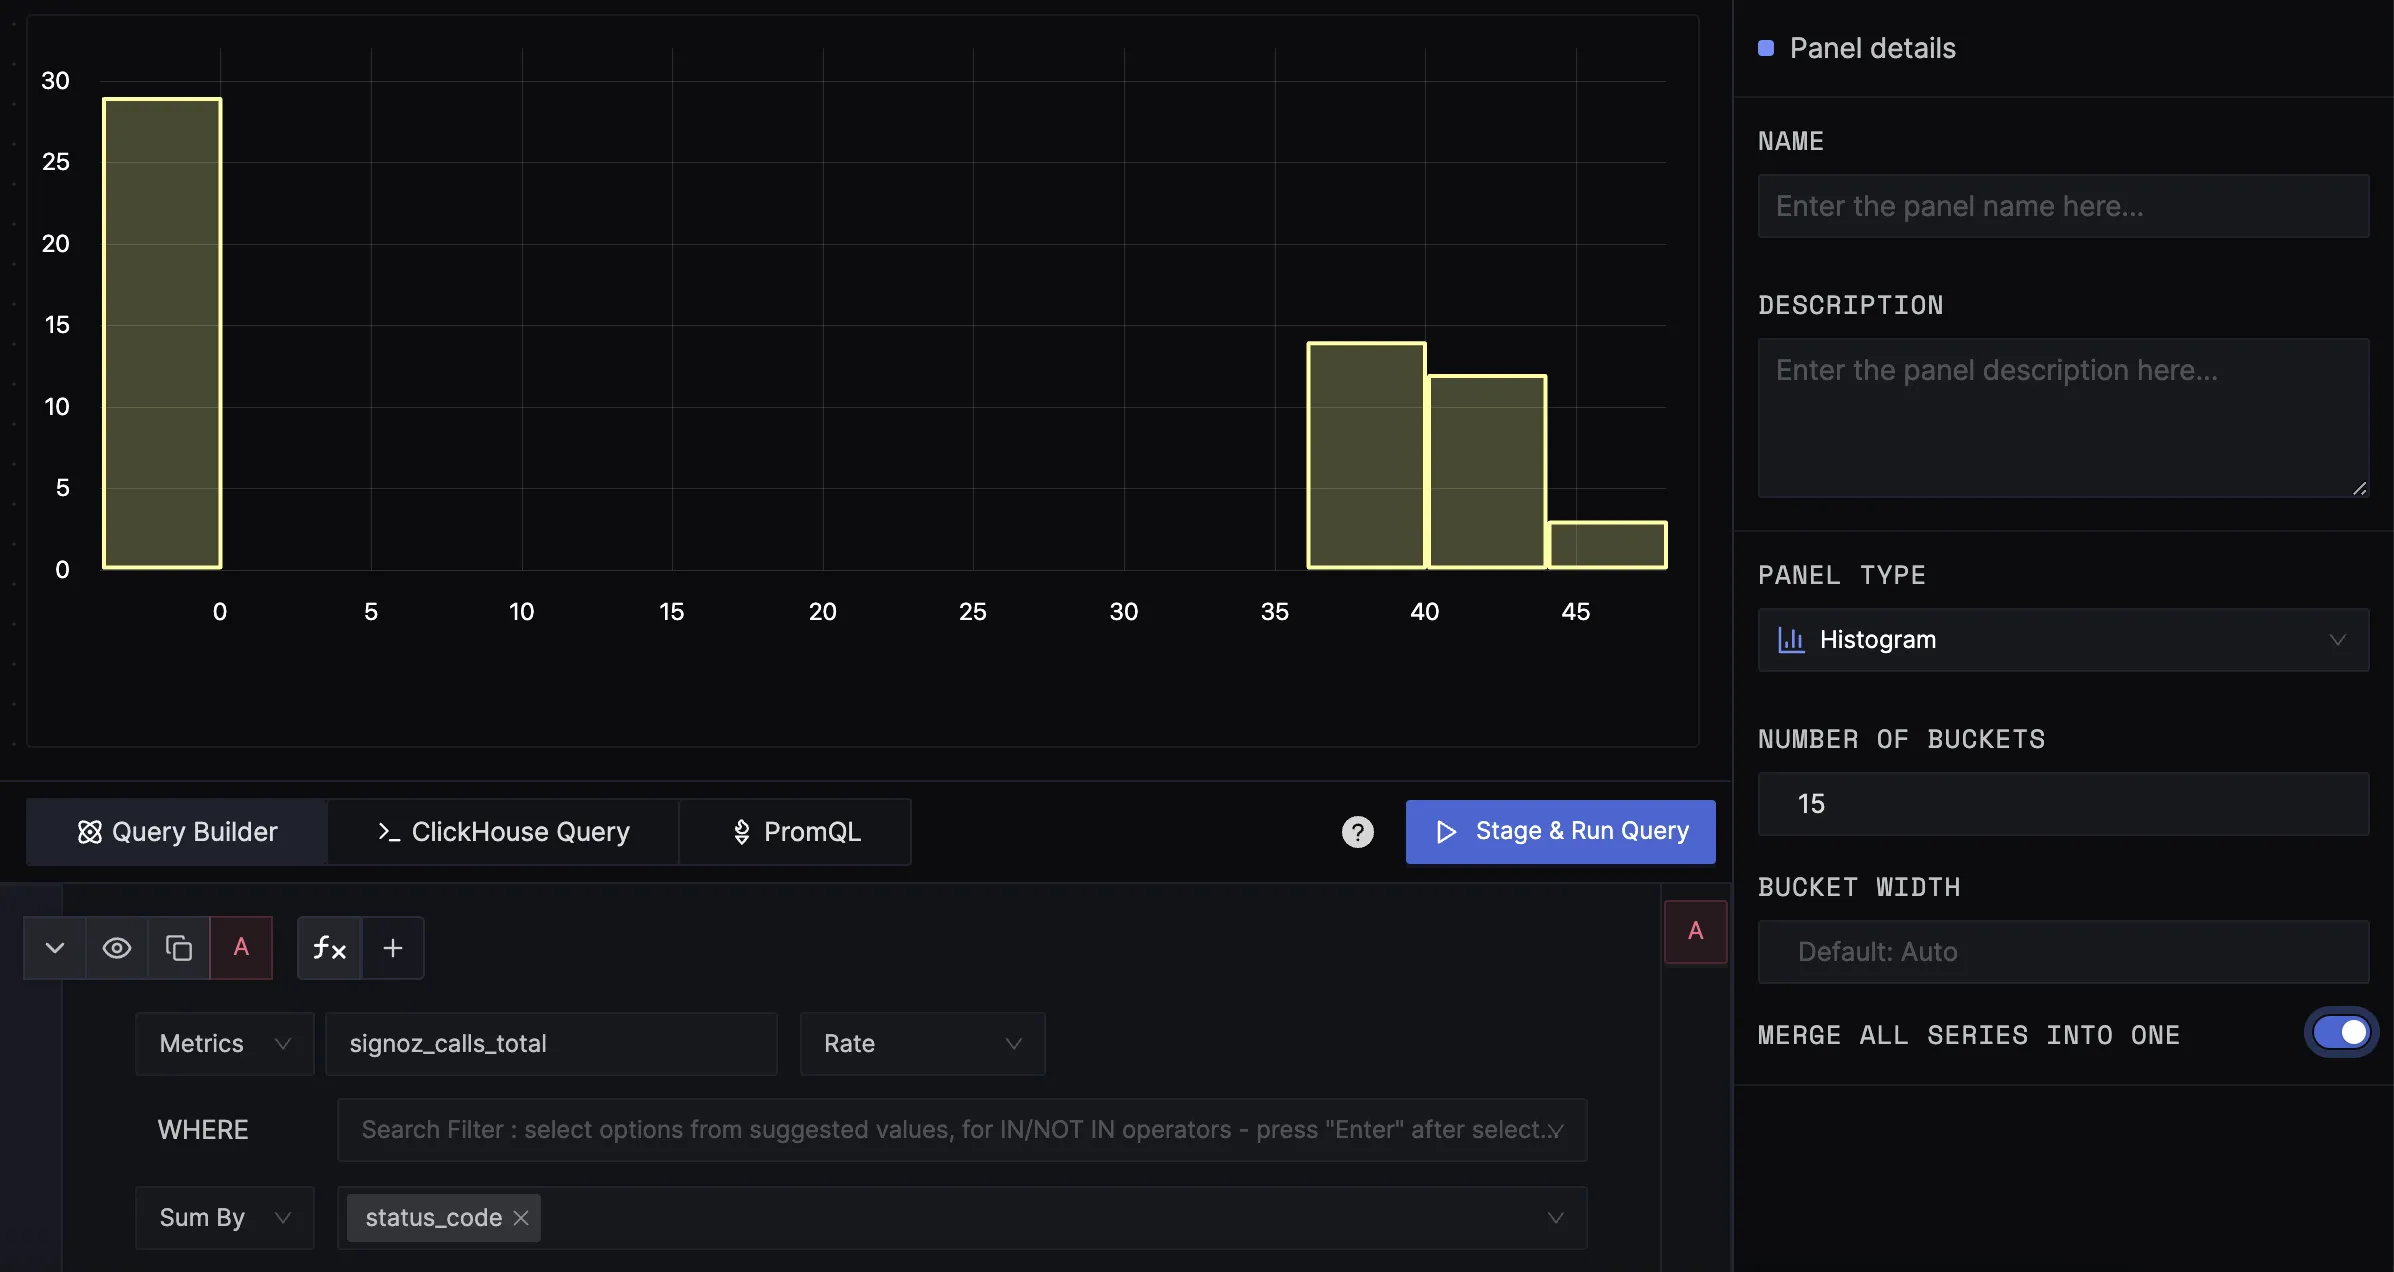
- Merging the multiple series into one Histogram
Multiple series can be merged into a Histogram using the option MERGE ALL SERIES INTO ONE from the right side of the panel configuration.

Configuration
Number of Buckets
The number of buckets to create in the Histogram. The default value is 30.
Bucket Width
The size of the buckets. Automatic bucket sizing is applied by default.
Merging Series
This allows users to combine the values from multiple series into one Histogram.
Get Help
If you need help with the steps in this topic, please reach out to us on SigNoz Community Slack.
If you are a SigNoz Cloud user, please use in product chat support located at the bottom right corner of your SigNoz instance or contact us at cloud-support@signoz.io.
