Q. I see an empty Dashboard, what should I do ?
A. Try changing the variable in the Dashboard. Or increase the time range to see if data is available.
Show detailed steps
Try changing the variable in Dashboard. For example, if you're using the Kubernetes Pod Metrics - Overall dashboard, you can select $node_name variable as ALL to see the data as shown in below image.
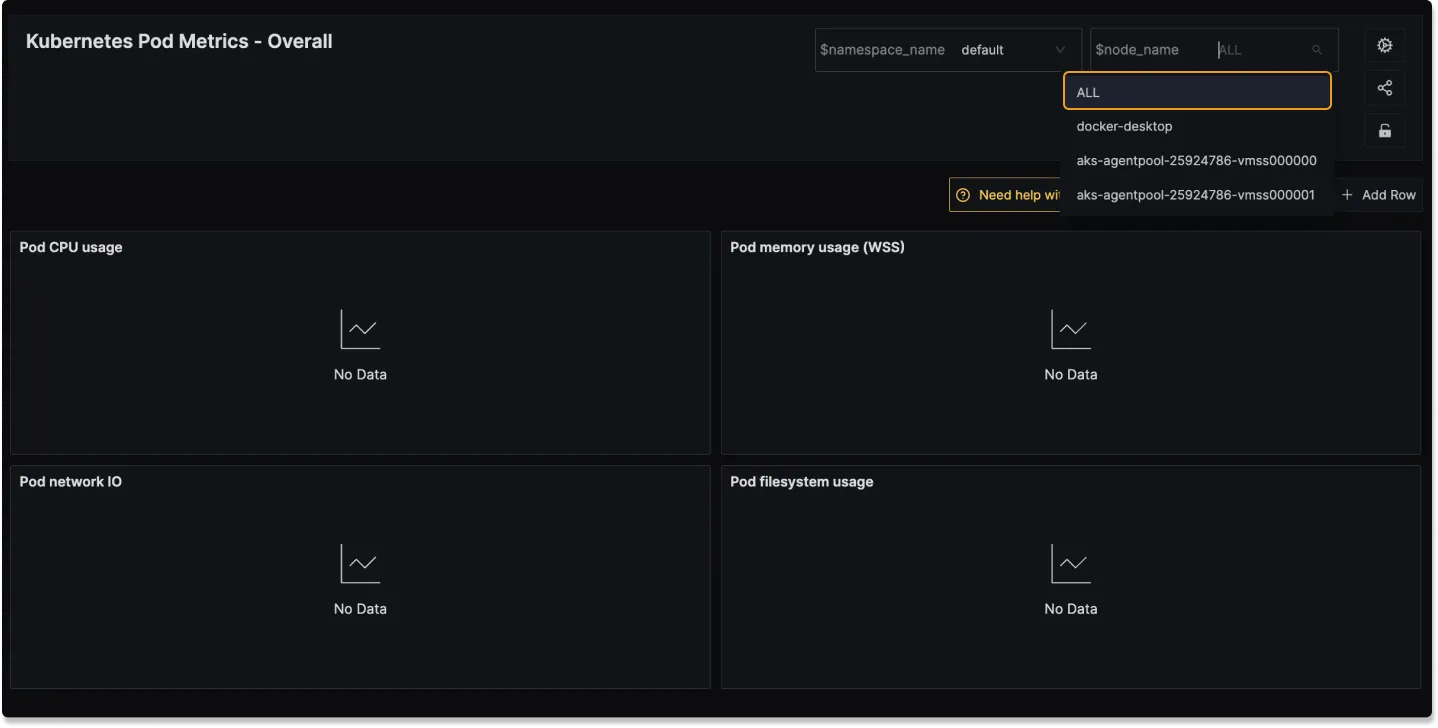
Selecting ALL as $node_name variable in Kubernetes Pod Metrics - Overall Dashboard
Q. Is it possible to import Grafana Dashboards in SigNoz?
A. No, it's not possible to import Grafana Dashboards in SigNoz at the moment.
Q. How do I change legend colors in charts?
A. You can change the legend colors in charts by modifying the chart settings. Look for the "Legend Colors" option in the chart settings panel, where you can customize the colors for each series in the chart.
Show detailed steps
To change legend colors:
- Go in edit panel mode
- Locate the right side panel of your chart
- Find the "Legend Colors" option
- Select and adjust the colors for individual legend items as needed This is particularly useful when certain color combinations may be difficult to read, such as when hovering over data points with default color schemes.
Q. How do I export table data to CSV from dashboards?
A. You can download table data as CSV directly from the dashboard view. Follow these steps:
Show detailed steps
- Create and configure your table in the dashboard editor.
- Save the dashboard.
- Open the saved dashboard in view mode.
- In the table panel, locate the menu icon (three vertical dots) and select "Download CSV" to export the table data.
Note: The CSV download option is only available in the dashboard view mode, not in the dashboard editor mode.
Q. Why do my time series and bar charts show 'no data' even though my table view displays results?
A. Time series and bar charts require a timestamp column in your query results to plot data correctly. These chart types use time as the x-axis, so without a timestamp column, they cannot display the data even if your table view shows results.
Show detailed steps to resolve
To resolve this issue:
Add a timestamp column to your SELECT statement
- Your query must include a column that represents time/date values
Ensure the timestamp column is properly formatted
- The timestamp should be in a format that the charting system can recognize
Verify your GROUP BY clause includes time-based grouping
- For time series charts, you typically need to group your data by time intervals
Example:
If you have a query like max(last_seen) AS bucket_completed which contains timestamp data, you may need to adjust how this is structured or ensure it's being recognized as the time dimension for your charts.
Alternative visualization:
If you only need to display aggregate data without time-based visualization, consider using a table view or other chart types that don't require time-based x-axis data.
