This documentation provides steps for sending logs from your frontend application to SigNoz.
SigNoz natively supports OpenTelemetry for collecting logs, so you can lift-and-shift existing log libraries or build new pipelines, all with the same unified model as your traces and metrics.
Logs can be collected on the client side at meaningful points to capture various events, state changes, errors and warnings.
Prerequisites
- SigNoz Cloud or self-hosted account
- A web application from where you want to send logs
Setup
Step 1: Install dependencies
Install the following dependencies.
npm install @opentelemetry/resources
npm install @opentelemetry/sdk-logs
npm install @opentelemetry/exporter-logs-otlp-http
npm install @opentelemetry/api-logs
yarn add @opentelemetry/resources
yarn add @opentelemetry/sdk-logs
yarn add @opentelemetry/exporter-logs-otlp-http
yarn add @opentelemetry/api-logs
Read more about the dependencies
@opentelemetry/resources: Provides resource attributes that identify your service (like service name, version, etc.). This helps distinguish logs from different services in your SigNoz dashboard.@opentelemetry/sdk-logs: Contains the core logging SDK implementation includingLoggerProviderandBatchLogRecordProcessor. This is the foundation for creating and processing log records in your application.@opentelemetry/exporter-logs-otlp-http: Implements the OTLP (OpenTelemetry Protocol) HTTP exporter that sends your logs to the SigNoz collector. This handles the actual transmission of log data over HTTP.@opentelemetry/api-logs: Provides the logging API interface (logsobject) that your application code uses to create log records. This is the main API you'll interact with when adding logging statements to your code.
Step 2: Create an instrumentation file
The instrumentation file is required to setup the LoggerProvider which is used to create custom logs within your application and export them to your collector.
import {
  LoggerProvider,
  BatchLogRecordProcessor,
} from '@opentelemetry/sdk-logs';
import { OTLPLogExporter } from '@opentelemetry/exporter-logs-otlp-http';
import { logs } from '@opentelemetry/api-logs';
import { resourceFromAttributes } from '@opentelemetry/resources';

const loggerProvider = new LoggerProvider({
  resource: resourceFromAttributes({
    'service.name': '<SERVICE_NAME>',
  }),
  processors: [
    new BatchLogRecordProcessor(
      new OTLPLogExporter({
        // For self-hosted version, please use the collector url instead.
        url: `https://ingest.<INGESTION_REGION>.signoz.cloud:443/v1/logs`,
        headers: {
          // Optional for the self-hosted version
          'signoz-ingestion-key': '<INGESTION_KEY>',
        },
      }),
    ),
  ],
});

logs.setGlobalLoggerProvider(loggerProvider);
- Set the
<INGESTION_REGION>to match your SigNoz Cloud region - Replace
<INGESTION_KEY>with your SigNoz ingestion key <SERVICE_NAME>is the name of your service
For self-hosted deployments, add the following CORS configuration to your OpenTelemetry Collector config file to allow browser requests from your frontend domain. Also, update the endpoint and remove the ingestion key header as shown in Cloud → Self-Hosted.
receivers:
  otlp:
    protocols:
      grpc:
        endpoint: 0.0.0.0:4317
      http:
        endpoint: 0.0.0.0:4318
        cors:
          allowed_origins:
            - <YOUR_FRONTEND_URL>
          allowed_headers: ['*']
<YOUR_FRONTEND_URL>is the url pointing to your frontend application
Step 3: Importing the instrumentation file
Import the instrumentation file at the top level of your application. This ensures that the OpenTelemetry instrumentation is initialized before any other code runs, allowing it to capture telemetry data from the very beginning of your application's execution.
In your main entry file (typically main.tsx or index.tsx), import the instrumentation file at the very top:
import './instrumentation';
import { StrictMode } from 'react';
import { createRoot } from 'react-dom/client';
import './index.css';
import App from './App';

createRoot(document.getElementById('root')!).render(
  <StrictMode>
    <App />
  </StrictMode>
);
Next.js (App Router) supports instrumentation through a special instrumentation.ts file at the root of your project (or inside src/ if using the src directory).
For client-side instrumentation, create a separate file and import it in your root layout:
// Your OpenTelemetry instrumentation code here
// (the code from Step 2)
Import it in your root layout:
import './instrumentation-client';

export default function RootLayout({ children }: { children: React.ReactNode }) {
  return (
    <html lang="en">
      <body>{children}</body>
    </html>
  );
}
Note: Make sure to enable instrumentation in next.config.js (Only required when using NextJs 14 and below):
module.exports = {
  experimental: {
    instrumentationHook: true,
  },
};
For Next.js with Pages Router, import the instrumentation in your _app.tsx file:
import '../instrumentation';
import type { AppProps } from 'next/app';

export default function App({ Component, pageProps }: AppProps) {
  return <Component {...pageProps} />;
}
Alternatively, you can use the instrumentation.ts file at the root (requires Next.js 13.2+):
export async function register() {
  if (typeof window !== 'undefined') {
    // Client-side instrumentation
    await import('./instrumentation-client');
  }
}
And enable it in next.config.js (Only required when using NextJs 14 and below):
module.exports = {
  experimental: {
    instrumentationHook: true,
  },
};
For Nuxt.js, create a plugin to initialize the instrumentation:
// Your OpenTelemetry instrumentation code here
// (the code from Step 2)

export default defineNuxtPlugin(() => {
  // Instrumentation is initialized when this plugin loads
});
The .client.ts suffix ensures this only runs on the client side. Nuxt will automatically load this plugin during application initialization.
Alternatively, you can import it directly in app.vue:
<script setup>
import './instrumentation';
</script>

<template>
  <NuxtPage />
</template>
For Angular, import the instrumentation file at the very top of your main.ts:
import './instrumentation';
import { bootstrapApplication } from '@angular/platform-browser';
import { appConfig } from './app/app.config';
import { AppComponent } from './app/app.component';

bootstrapApplication(AppComponent, appConfig)
  .catch((err) => console.error(err));
For older Angular versions using platformBrowserDynamic:
import './instrumentation';
import { platformBrowserDynamic } from '@angular/platform-browser-dynamic';
import { AppModule } from './app/app.module';

platformBrowserDynamic().bootstrapModule(AppModule)
  .catch(err => console.error(err));
For Vue.js, import the instrumentation file at the very top of your main.ts (or main.js):
import './instrumentation';
import { createApp } from 'vue';
import App from './App.vue';

createApp(App).mount('#app');
For Vue 2:
import './instrumentation';
import Vue from 'vue';
import App from './App.vue';

new Vue({
  render: h => h(App),
}).$mount('#app');
For Svelte (with Vite), import in your main.ts:
import './instrumentation';
import App from './App.svelte';

const app = new App({
  target: document.getElementById('app')!,
});

export default app;
For SvelteKit, create a hook in src/hooks.client.ts:
import './instrumentation';
Or import it in your root layout:
<script>
  import '../instrumentation';
</script>

<slot />
Step 4: Create utility functions for Logging
The utils file will contain our utility functions for recording various kinds of logs (info, warning, error).
import {
  logs,
  SeverityNumber,
  type AnyValueMap,
} from '@opentelemetry/api-logs';

const logger = logs.getLogger('frontend-logger');

export function logInfo(body: string, attrs: AnyValueMap = {}) {
  logger.emit({
    body,
    severityNumber: SeverityNumber.INFO,
    severityText: 'INFO',
    attributes: attrs,
  });
}

export function logWarn(body: string, attrs: AnyValueMap = {}) {
  logger.emit({
    body,
    severityNumber: SeverityNumber.WARN,
    severityText: 'WARN',
    attributes: attrs,
  });
}

export function logError(body: string, attrs: AnyValueMap = {}) {
  logger.emit({
    body,
    severityNumber: SeverityNumber.ERROR,
    severityText: 'ERROR',
    attributes: attrs,
  });
}
import {
  logs,
  SeverityNumber,
} from '@opentelemetry/api-logs';

const logger = logs.getLogger('frontend-logger');

export function logInfo(body, attrs = {}) {
  logger.emit({
    body,
    severityNumber: SeverityNumber.INFO,
    severityText: 'INFO',
    attributes: attrs,
  });
}

export function logWarn(body, attrs = {}) {
  logger.emit({
    body,
    severityNumber: SeverityNumber.WARN,
    severityText: 'WARN',
    attributes: attrs,
  });
}

export function logError(body, attrs = {}) {
  logger.emit({
    body,
    severityNumber: SeverityNumber.ERROR,
    severityText: 'ERROR',
    attributes: attrs,
  });
}
Step 5: Setting up Logs within your Application
Add logs at meaningful points in your application.
async function onNextClick() {
  try {
    const response = await fetch('/api/data');
    const data = await response.json();
    logInfo('Next button clicked!', { data });
    return data;
  } catch (error) {
    logError('Failed to fetch data', { error: error.message });
  }
}
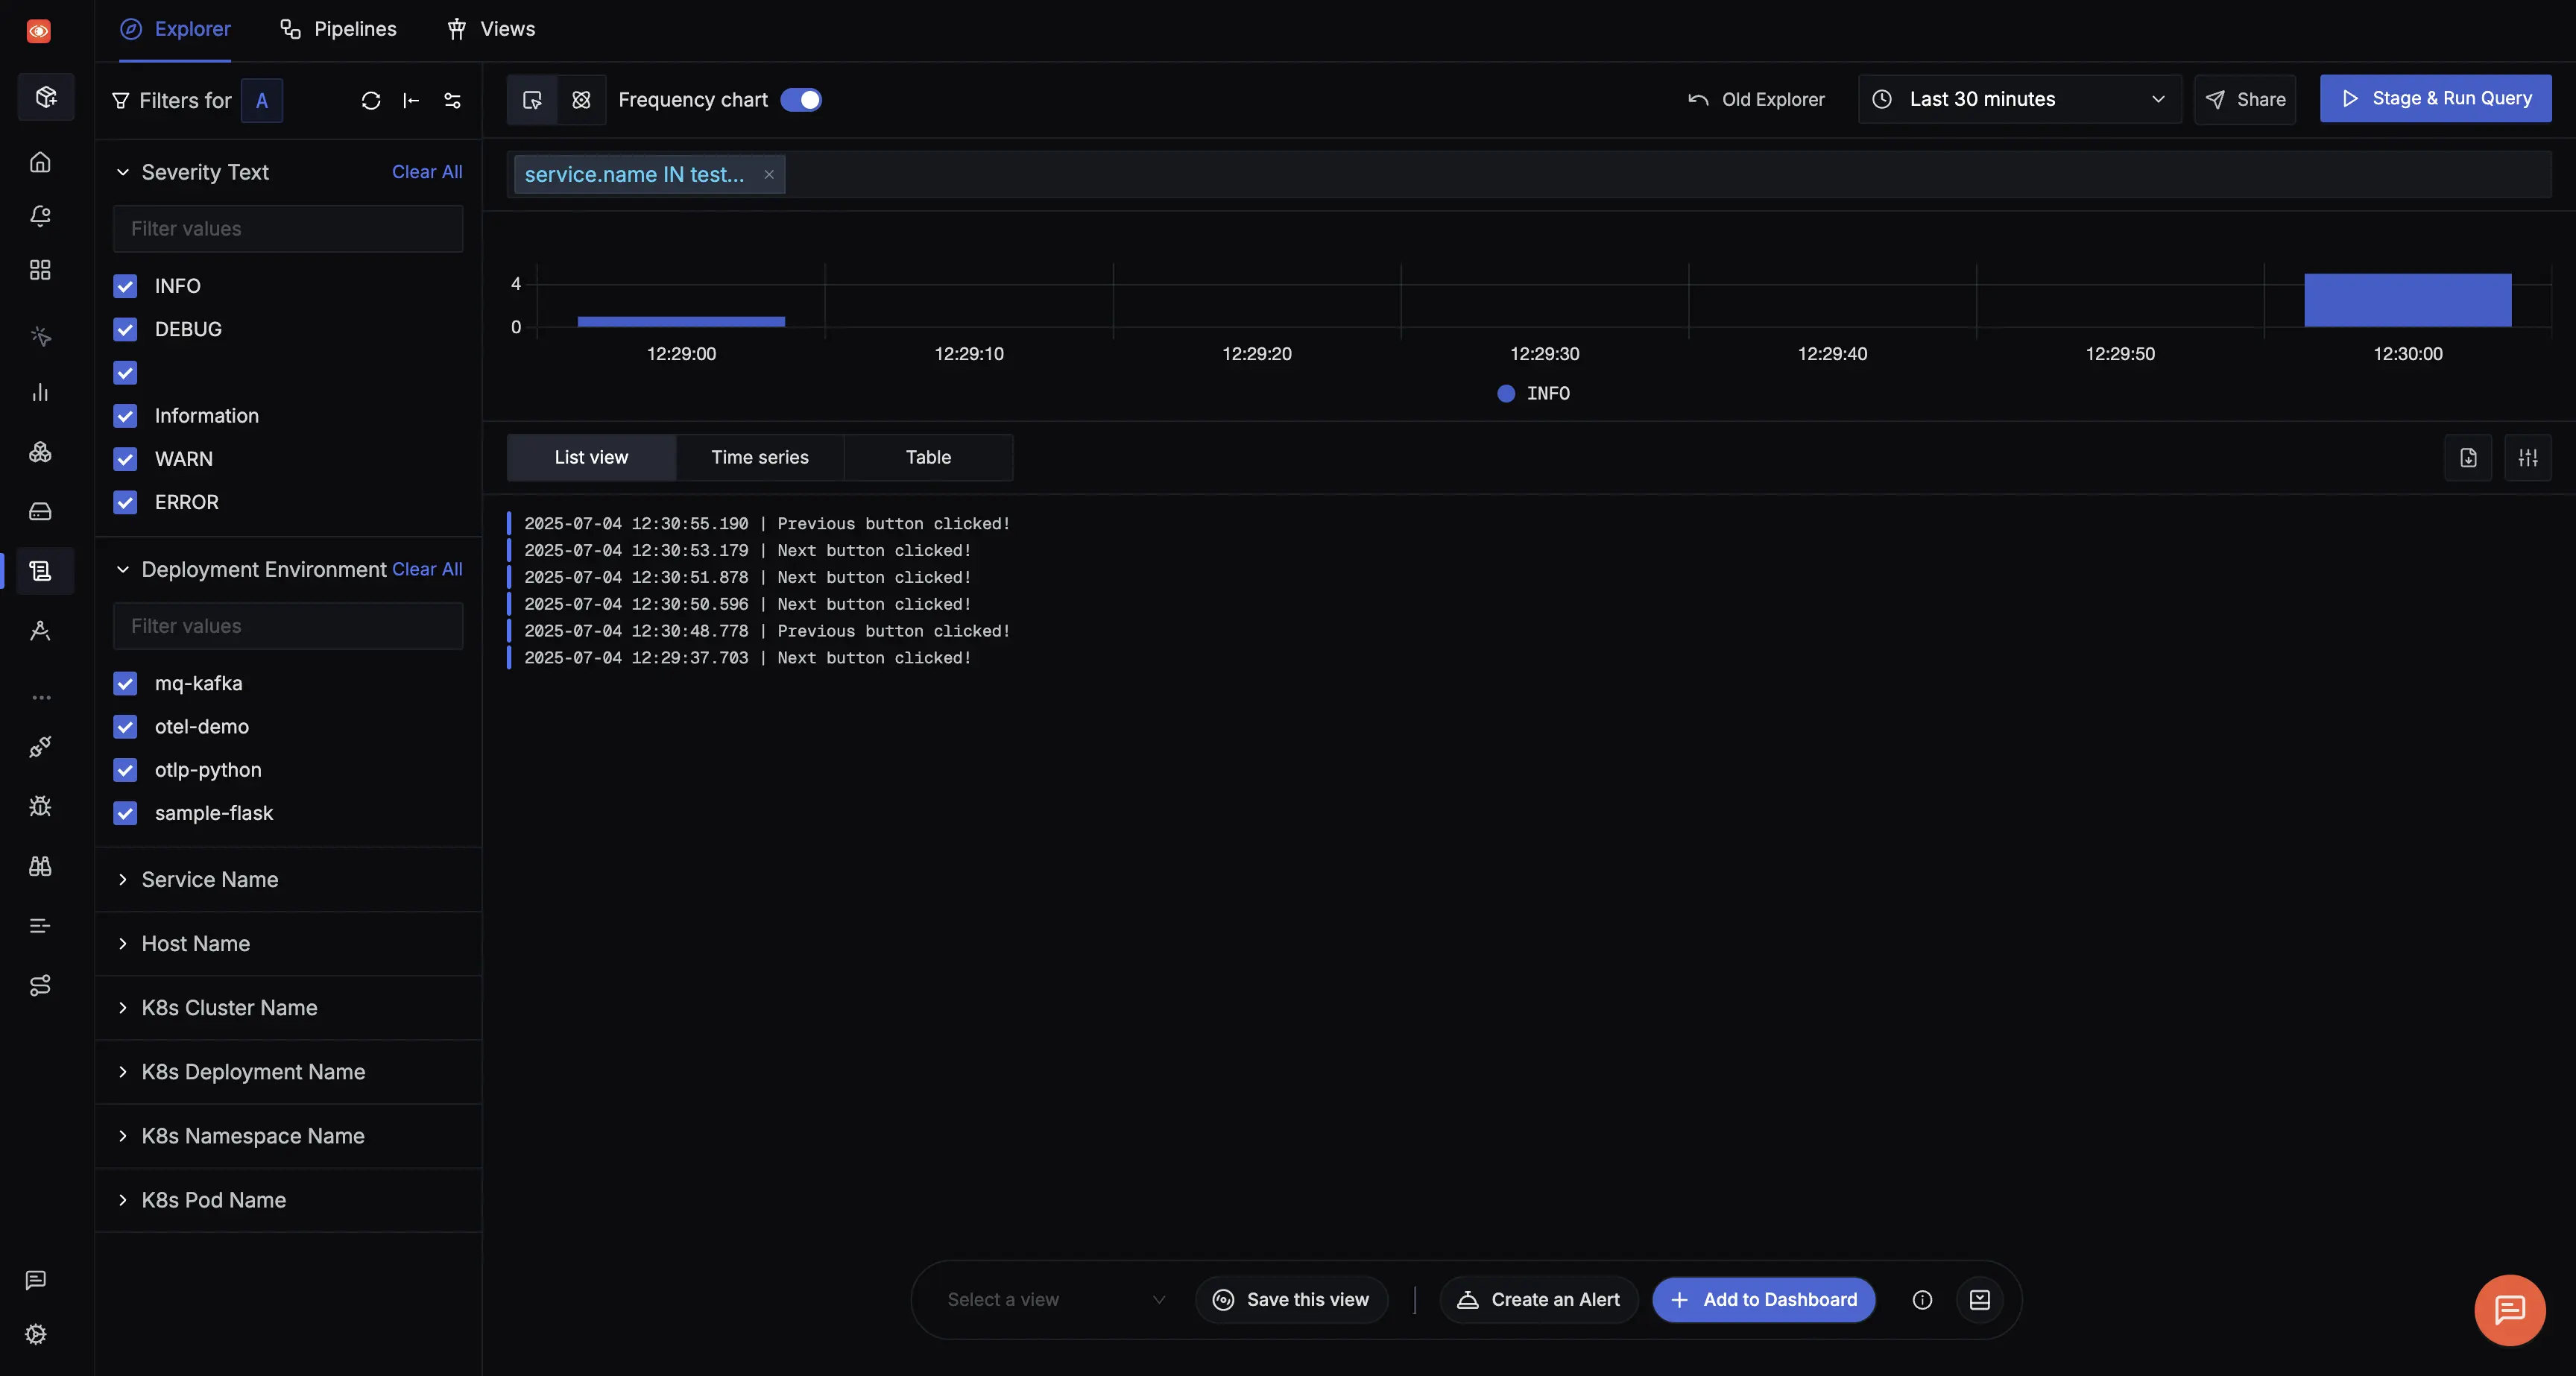
Step 6: Viewing Captured Logs in SigNoz
The captured logs can then be viewed in the Logs Explorer.
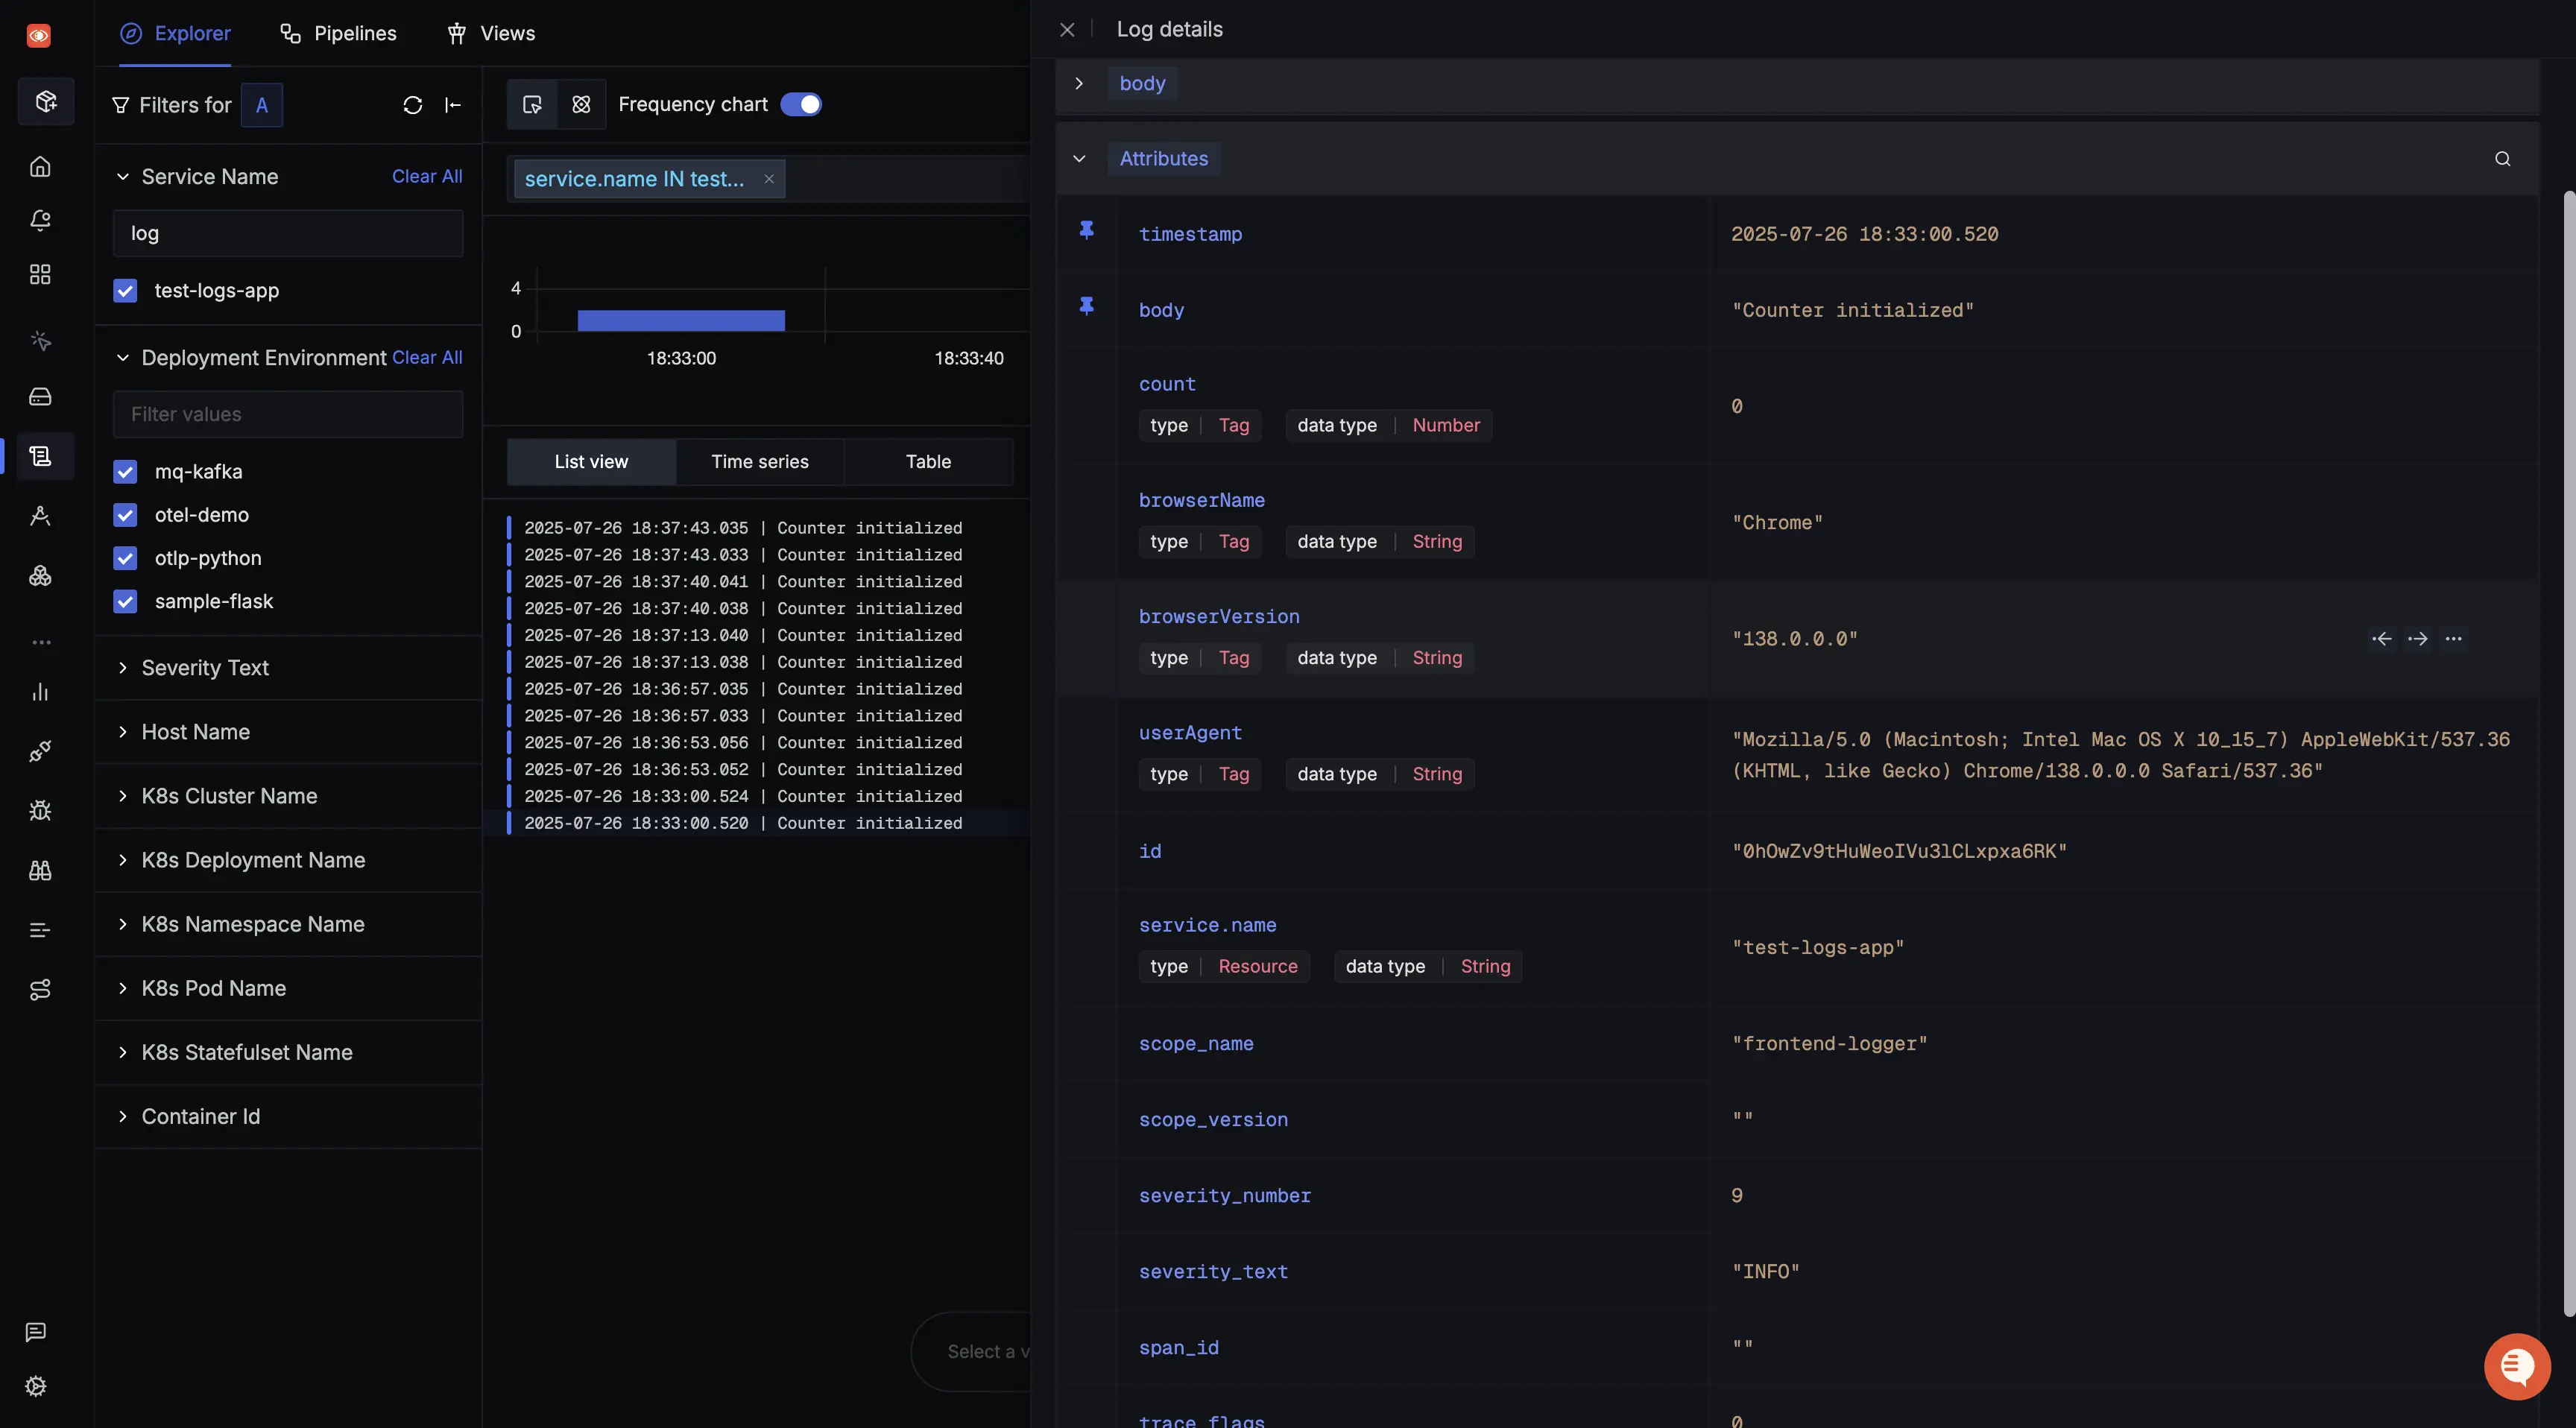
Attaching additional identifiers to your Logs
You can enrich logs with additional metadata like browser type, user ID etc. to enable real user monitoring (RUM)-like insights.
To do so, you need to write a custom implementation on top of LogRecordProcessor which will intercept all your exported logs and attach additional attributes to them.
import type { LogRecordProcessor, SdkLogRecord } from '@opentelemetry/sdk-logs';
import { UAParser } from 'ua-parser-js';

function getBrowserInfo() {
  // You can add your custom browser tracking logic here as well.
  // This example uses the ua-parser-js package.
  const parser = new UAParser();
  const result = parser.getResult();
  return {
    browserName: result.browser.name,
    browserVersion: result.browser.version,
    userAgent: result.ua,
  };
}

function getUserId() {
  // You can add your custom user ID tracking logic here as well.
  // This example uses localStorage.
  const userId = localStorage.getItem('userId');
  return {
    userId,
  };
}

function getAdditionalAttributes() {
  return {
    ...getBrowserInfo(),
    ...getUserId(),
  };
}

export class CustomAttributesProcessor implements LogRecordProcessor {
  onEmit(logRecord: SdkLogRecord) {
    const additionalAttrs = getAdditionalAttributes();
    logRecord.setAttributes(additionalAttrs);
  }

  shutdown(): Promise<void> {
    return Promise.resolve();
  }

  forceFlush(): Promise<void> {
    return Promise.resolve();
  }
}
import { UAParser } from 'ua-parser-js';

function getBrowserInfo() {
  // You can add your custom browser tracking logic here as well.
  // This example uses the ua-parser-js package.
  const parser = new UAParser();
  const result = parser.getResult();
  return {
    browserName: result.browser.name,
    browserVersion: result.browser.version,
    userAgent: result.ua,
  };
}

function getUserId() {
  // You can add your custom user ID tracking logic here as well.
  // This example uses localStorage.
  const userId = localStorage.getItem('userId');
  return {
    userId,
  };
}

function getAdditionalAttributes() {
  return {
    ...getBrowserInfo(),
    ...getUserId(),
  };
}

export class CustomAttributesProcessor {
  onEmit(logRecord) {
    const additionalAttrs = getAdditionalAttributes();
    logRecord.setAttributes(additionalAttrs);
  }

  shutdown() {
    return Promise.resolve();
  }

  forceFlush() {
    return Promise.resolve();
  }
}
Update your instrumentation file to include this processor before the default one.
const loggerProvider = new LoggerProvider({
  resource: resourceFromAttributes({
    'service.name': '<SERVICE_NAME>',
  }),
  processors: [
    new CustomAttributesProcessor(),
    new BatchLogRecordProcessor(new OTLPLogExporter({
      url: `https://ingest.<INGESTION_REGION>.signoz.cloud:443/v1/logs`,
      headers: {
        // Optional for the self-hosted version
        'signoz-ingestion-key': '<INGESTION_KEY>',
      },
    })),
  ],
})
Now every log exported will include these additional contextual attributes.
Tracking Errors within your application
You can track various console errors, javascript errors and exceptions by adding event handlers on each of them to send custom logs to SigNoz.
Create a separate error-tracking.js (or .ts for TypeScript) containing the event handlers.
import { logError } from './logger';

// JavaScript Errors
window.addEventListener('error', (event) => {
  logError('window.onerror', {
    'exception.message': event.message,
    'exception.type': event.error?.name || 'Error',
    'exception.stacktrace': event.error?.stack || '',
    'exception.source': event.filename,
    'exception.lineno': event.lineno,
    'exception.colno': event.colno,
  });
});

// JavaScript Rejections
window.addEventListener('unhandledrejection', (event) => {
  const reason = event.reason || {};
  logError('unhandledrejection', {
    'exception.message': reason.message || String(reason),
    'exception.stacktrace': reason.stack || '',
    'exception.type': reason.name || typeof reason || 'UnhandledRejection',
  });
});


// JavaScript Console Errors
const originalConsoleError = console.error;
console.error = (...args) => {
  const message = args.map(String).join(' ');
  logError('console.error', {
    'exception.message': message,
    'exception.type': 'ConsoleError',
    'exception.stacktrace': new Error().stack || '',
  });

  originalConsoleError(...args);
};
These captured logs can then also be viewed in the Logs Explorer.
Demo Application
Check out this Sample React Application that demonstrates sending logs to SigNoz.
