This documentation provides steps for sending metrics from your frontend application to SigNoz.
SigNoz natively supports OpenTelemetry for collecting metrics, so you can lift-and-shift existing metric instrumentation, all with the same unified model as your traces and logs.
Metrics can be collected on the client side at meaningful points to capture various events and state changes.
Prerequisites
- SigNoz Cloud or self-hosted account
- A web application from where you want to send metrics
Setup
Step 1: Install dependencies
Install the following dependencies.
npm install @opentelemetry/resources
npm install @opentelemetry/sdk-metrics
npm install @opentelemetry/exporter-metrics-otlp-http
npm install @opentelemetry/api
yarn add @opentelemetry/resources
yarn add @opentelemetry/sdk-metrics
yarn add @opentelemetry/exporter-metrics-otlp-http
yarn add @opentelemetry/api
Read more about the dependencies
@opentelemetry/resources: Provides resource attributes that identify your service (like service name, version, etc.). This helps distinguish metrics from different services in your SigNoz dashboard.@opentelemetry/sdk-metrics: Contains the core metrics SDK implementation includingMeterProviderandPeriodicExportingMetricReader. This is the foundation for creating and sending metrics from your application.@opentelemetry/exporter-metrics-otlp-http: Implements the OTLP (OpenTelemetry Protocol) HTTP exporter that sends your metrics to the SigNoz collector. This handles the actual transmission of metrics data over HTTP.@opentelemetry/api: Provides the API interface that your application code uses to create metrics. This is the main API you'll interact with when adding metrics to your code.
Step 2: Create an instrumentation file
The instrumentation file is required to setup the MeterProvider which is used to create custom metrics within your application and export them to your collector.
import {
  MeterProvider,
  PeriodicExportingMetricReader,
} from '@opentelemetry/sdk-metrics';
import { OTLPMetricExporter } from '@opentelemetry/exporter-metrics-otlp-http';
import { resourceFromAttributes } from '@opentelemetry/resources';
import { metrics } from '@opentelemetry/api';

// Define your resource, e.g., service name, environment.
const resource = resourceFromAttributes({
  'service.name': '<SERVICE_NAME>',
});

// Create a metric reader with OTLP exporter configured to send metrics to a local collector.
const metricReader = new PeriodicExportingMetricReader({
  exporter: new OTLPMetricExporter({
    // For self-hosted version, please use the collector url instead.
    url: `https://ingest.<INGESTION_REGION>.signoz.cloud:443/v1/metrics`,
    headers: {
      // Optional for the self-hosted version
      'signoz-ingestion-key': '<INGESTION_KEY>',
    },
  }),
  exportIntervalMillis: 10000, // Export metrics every 10 seconds.
});

// Initialize a MeterProvider with the above configurations.
const myServiceMeterProvider = new MeterProvider({
  resource,
  readers: [metricReader],
});

// Set the initialized MeterProvider as global to enable metric collection across the app.
metrics.setGlobalMeterProvider(myServiceMeterProvider);
- Set the
<INGESTION_REGION>to match your SigNoz Cloud region - Replace
<INGESTION_KEY>with your SigNoz ingestion key <SERVICE_NAME>is the name of your service
For self-hosted deployments, add the following CORS configuration to your OpenTelemetry Collector config file to allow browser requests from your frontend domain. Also, update the endpoint and remove the ingestion key header as shown in Cloud → Self-Hosted.
receivers:
  otlp:
    protocols:
      grpc:
        endpoint: 0.0.0.0:4317
      http:
        endpoint: 0.0.0.0:4318
        cors:
          allowed_origins:
            - <YOUR_FRONTEND_URL>
          allowed_headers: ['*']
<YOUR_FRONTEND_URL>is the url pointing to your frontend application
Step 3: Importing the instrumentation file
Import the instrumentation file at the top level of your application. This ensures that the OpenTelemetry instrumentation is initialized before any other code runs, allowing it to capture telemetry data from the very beginning of your application's execution.
In your main entry file (typically main.tsx or index.tsx), import the instrumentation file at the very top:
import './instrumentation';
import { StrictMode } from 'react';
import { createRoot } from 'react-dom/client';
import './index.css';
import App from './App';

createRoot(document.getElementById('root')!).render(
  <StrictMode>
    <App />
  </StrictMode>
);
Next.js (App Router) supports instrumentation through a special instrumentation.ts file at the root of your project (or inside src/ if using the src directory).
For client-side instrumentation, create a separate file and import it in your root layout:
// Your OpenTelemetry instrumentation code here
// (the code from Step 2)
Import it in your root layout:
import './instrumentation-client';

export default function RootLayout({ children }: { children: React.ReactNode }) {
  return (
    <html lang="en">
      <body>{children}</body>
    </html>
  );
}
Note: Make sure to enable instrumentation in next.config.js (Only required when using NextJs 14 and below):
module.exports = {
  experimental: {
    instrumentationHook: true,
  },
};
For Next.js with Pages Router, import the instrumentation in your _app.tsx file:
import '../instrumentation';
import type { AppProps } from 'next/app';

export default function App({ Component, pageProps }: AppProps) {
  return <Component {...pageProps} />;
}
Alternatively, you can use the instrumentation.ts file at the root (requires Next.js 13.2+):
export async function register() {
  if (typeof window !== 'undefined') {
    // Client-side instrumentation
    await import('./instrumentation-client');
  }
}
And enable it in next.config.js (Only required when using NextJs 14 and below):
module.exports = {
  experimental: {
    instrumentationHook: true,
  },
};
For Nuxt.js, create a plugin to initialize the instrumentation:
// Your OpenTelemetry instrumentation code here
// (the code from Step 2)

export default defineNuxtPlugin(() => {
  // Instrumentation is initialized when this plugin loads
});
The .client.ts suffix ensures this only runs on the client side. Nuxt will automatically load this plugin during application initialization.
Alternatively, you can import it directly in app.vue:
<script setup>
import './instrumentation';
</script>

<template>
  <NuxtPage />
</template>
For Angular, import the instrumentation file at the very top of your main.ts:
import './instrumentation';
import { bootstrapApplication } from '@angular/platform-browser';
import { appConfig } from './app/app.config';
import { AppComponent } from './app/app.component';

bootstrapApplication(AppComponent, appConfig)
  .catch((err) => console.error(err));
For older Angular versions using platformBrowserDynamic:
import './instrumentation';
import { platformBrowserDynamic } from '@angular/platform-browser-dynamic';
import { AppModule } from './app/app.module';

platformBrowserDynamic().bootstrapModule(AppModule)
  .catch(err => console.error(err));
For Vue.js, import the instrumentation file at the very top of your main.ts (or main.js):
import './instrumentation';
import { createApp } from 'vue';
import App from './App.vue';

createApp(App).mount('#app');
For Vue 2:
import './instrumentation';
import Vue from 'vue';
import App from './App.vue';

new Vue({
  render: h => h(App),
}).$mount('#app');
For Svelte (with Vite), import in your main.ts:
import './instrumentation';
import App from './App.svelte';

const app = new App({
  target: document.getElementById('app')!,
});

export default app;
For SvelteKit, create a hook in src/hooks.client.ts:
import './instrumentation';
Or import it in your root layout:
<script>
  import '../instrumentation';
</script>

<slot />
Step 4: Setting up Metrics within your Application
Now you can create and record metrics in your application. Here's an example of how to create and use metrics.
import { metrics } from '@opentelemetry/api'

// Get a meter from the global meter provider
const meter = metrics.getMeter('my-app-metrics')

// Create a histogram metric for measuring request duration (also gives count & sum)
const requestDuration = meter.createHistogram('http.client.request.duration', {
  description: 'Duration of HTTP requests',
  unit: 's', // seconds
})

// Record metrics in your application
async function handleRequest() {
  const startTime = performance.now()

  try {
    const response = await fetch('/api/data', { method: 'GET' })

    // Record the request duration
    const duration = (performance.now() - startTime) / 1000 // Convert to seconds
    requestDuration.record(duration, {
      'http.request.method': 'GET',
      'http.response.status_code': response.status,
      'http.route': '/api/data',
      'url.path': '/api/data',
      'url.scheme': window.location.protocol.replace(':', ''),
    })

    return await response.json()
  } catch (err) {
    const duration = (performance.now() - startTime) / 1000 // Convert to seconds
    requestDuration.record(duration, {
      'http.request.method': 'GET',
      'http.response.status_code': 0,
      'http.route': '/api/data',
      'url.path': '/api/data',
      'url.scheme': window.location.protocol.replace(':', ''),
    })
    throw err
  }
}
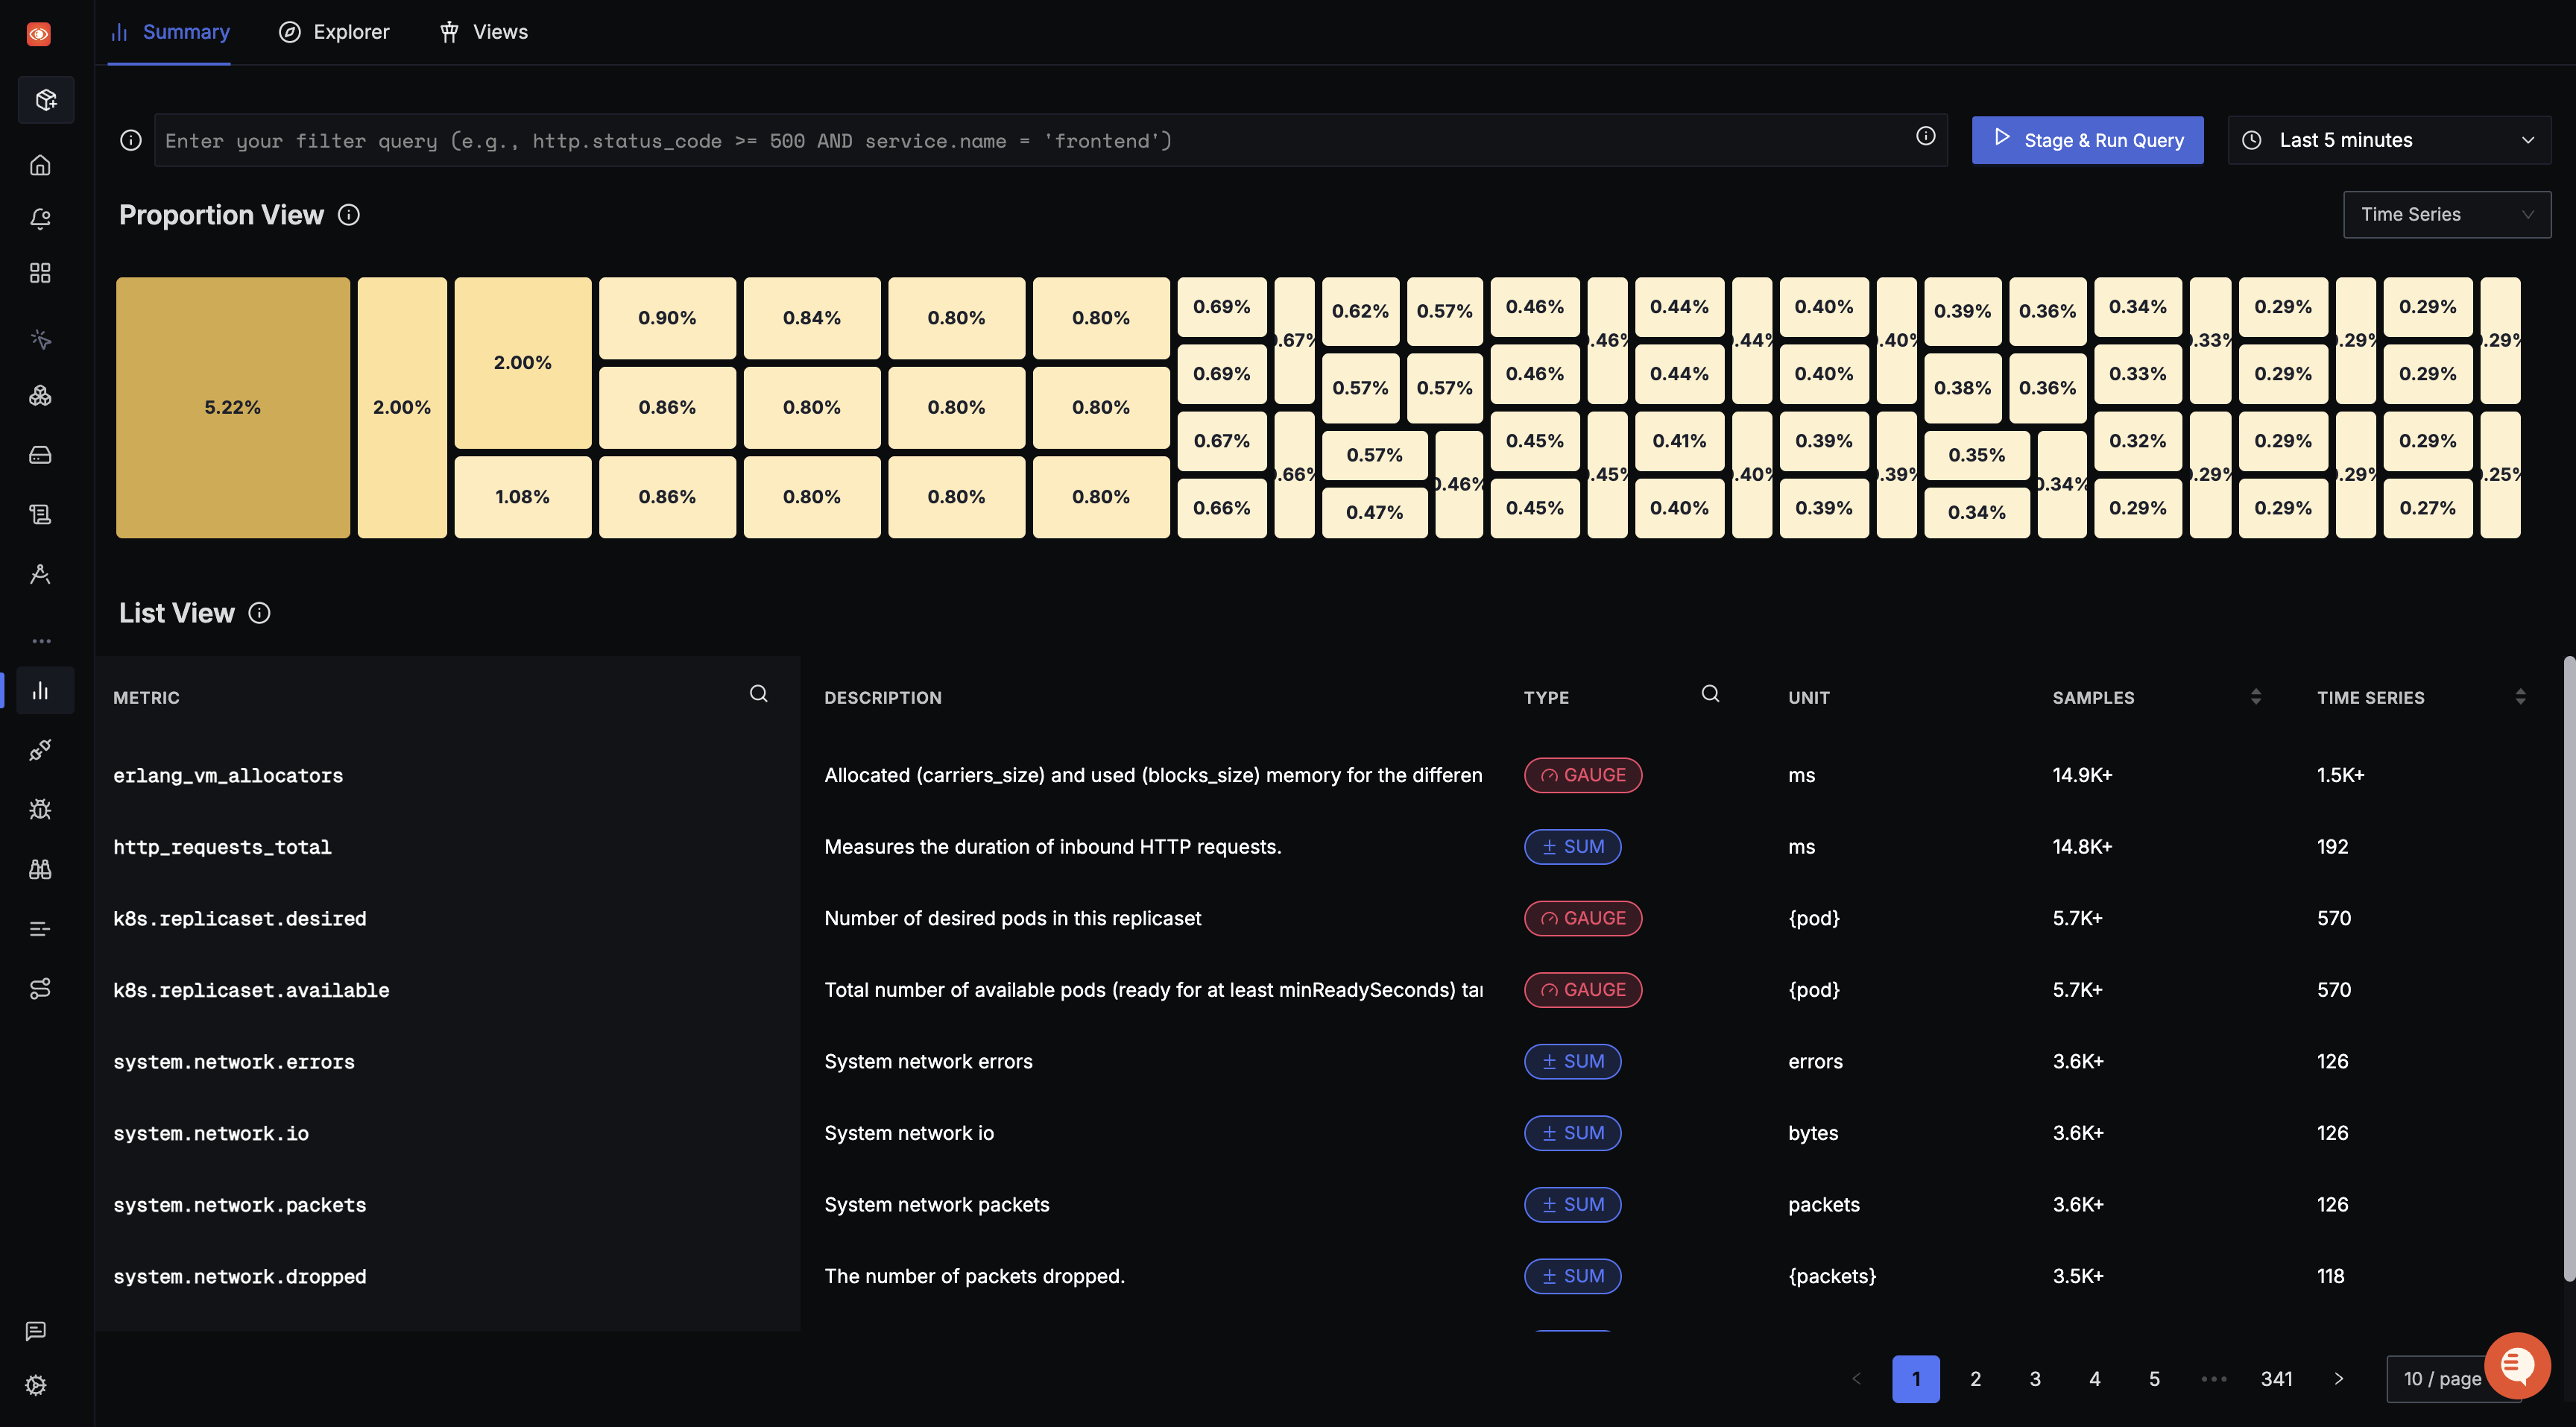
Step 5: Viewing Captured Metrics in SigNoz
The captured metrics can then be viewed in the Metrics Explorer.
Demo Application
Check out this Sample React Application that demonstrates sending metrics to SigNoz.
