Overview
This documentation provides a detailed walkthrough on how to set up a Google Cloud Function to send the traces to SigNoz.
Prerequisites
- Google Cloud account with administrative privilege or Cloud Functions Admin privilege.
- Access to a project in GCP
- Google Cloud Functions APIs enabled (follow this guide to see how to enable an API in Google Cloud)
Setup
Get started with Cloud Function Configuration
Follow these steps to create the Cloud Function:
Step 1: Go to your GCP console and search for Cloud Functions, go to Functions and click on CREATE FUNCTION.

GCP Cloud Functions
Step 2: Fill in the following details to create a Cloud Function:
- Environment: 2nd gen
- Function name: Name for the Cloud Function
- Region: Takes the default region of the GCP account
- Trigger: Defines how to trigger the Cloud Function
- Trigger Type: HTTPS - this allows us to trigger the Cloud Function using a URL
- Authentication: Choose whether you need authenticated or unauthenticated invocations. We have chosen an unauthenticated invocation for this demonstration.
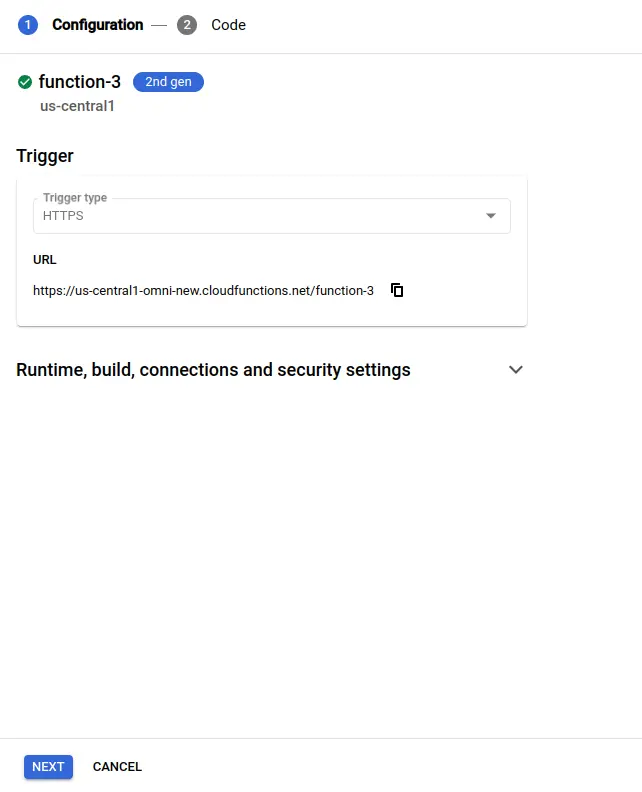
Create Cloud Function
Step 3: Expand the Runtime, build, connections, and security settings section, and under Runtime environment variables:
Add OTEL_EXPORTER_OTLP_HEADERS and OTEL_EXPORTER_OTLP_ENDPOINT with Ingestion Key and Ingestion URL respectively and add OTEL_EXPORTER_OTLP_PROTOCOL with grpc. You can get Ingestion Key and Ingestion URL.
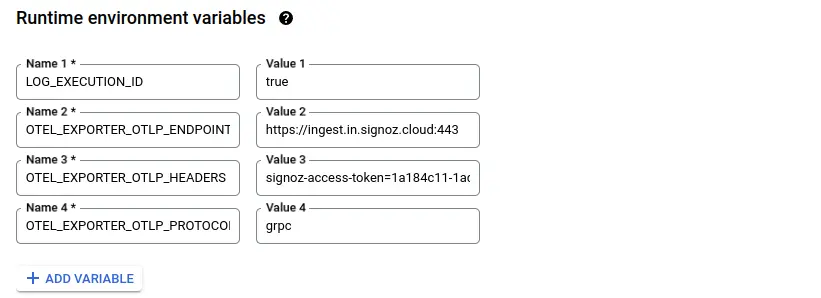
Set Cloud Function Runtime Environment Variables
Step 4: Click on the NEXT button, which will bring us to the page where we can add our code.
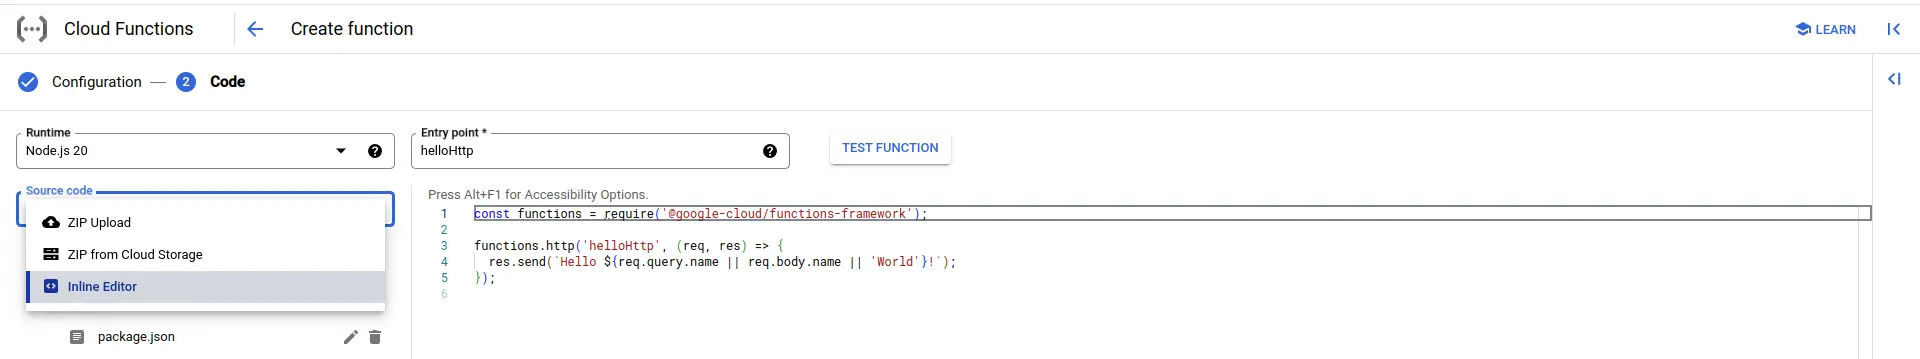
Set entrypoint and source code
Add code to the Google Cloud Function
For this demonstration, we will be using Node.js 20.
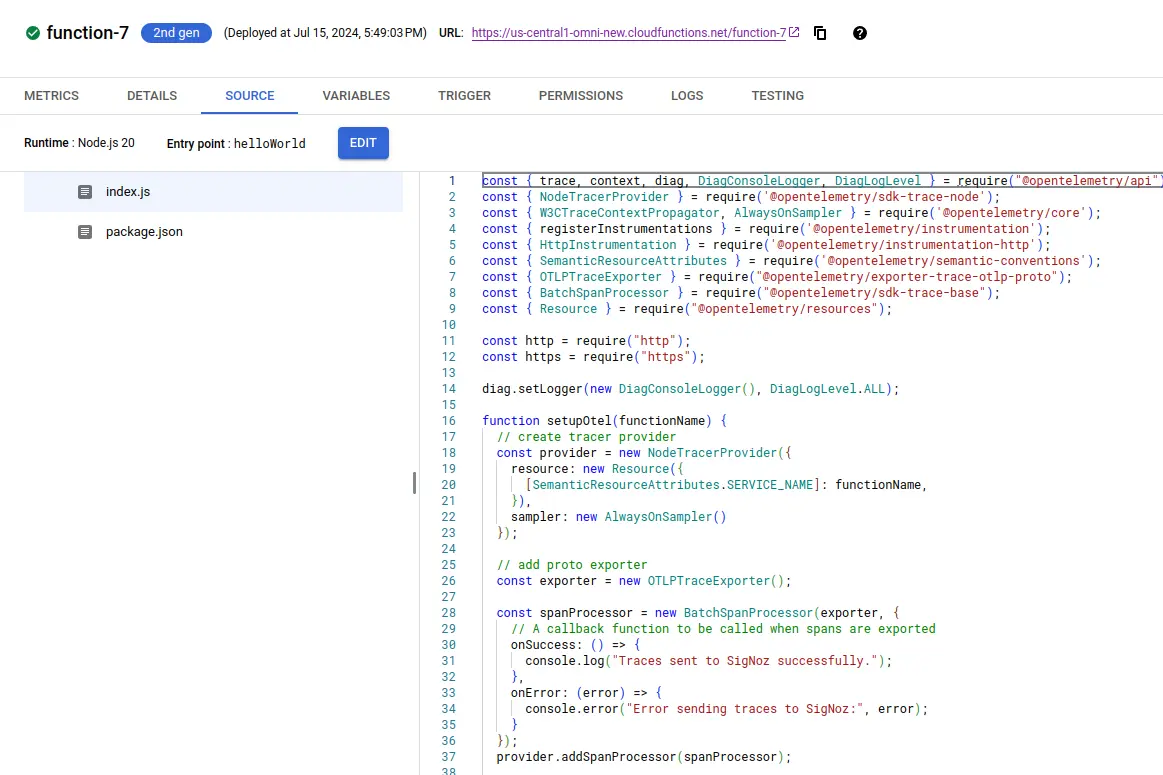
Below is the comprehensive code of the index.js file, followed by a high-level overview of what the code is doing.
const { trace, context, diag, DiagConsoleLogger, DiagLogLevel } = require("@opentelemetry/api");
const { NodeTracerProvider } = require('@opentelemetry/sdk-trace-node');
const { W3CTraceContextPropagator, AlwaysOnSampler } = require('@opentelemetry/core');
const { registerInstrumentations } = require('@opentelemetry/instrumentation');
const { HttpInstrumentation } = require('@opentelemetry/instrumentation-http');
const { SemanticResourceAttributes } = require('@opentelemetry/semantic-conventions');
const { OTLPTraceExporter } = require("@opentelemetry/exporter-trace-otlp-proto");
const { BatchSpanProcessor } = require("@opentelemetry/sdk-trace-base");
const { Resource } = require("@opentelemetry/resources");

const http = require("http");
const https = require("https");

diag.setLogger(new DiagConsoleLogger(), DiagLogLevel.ALL);

function initializeOtel(serviceIdentifier) {
 // create tracer provider
 const tracerProvider = new NodeTracerProvider({
   resource: new Resource({
     [SemanticResourceAttributes.SERVICE_NAME]: serviceIdentifier,
   }),
   sampler: new AlwaysOnSampler()
 });

 // add OTLP exporter
 const traceExporter = new OTLPTraceExporter();
  const spanProcessor = new BatchSpanProcessor(traceExporter, {
   onSuccess: () => {
     console.log("Traces sent successfully.");
   },
   onError: (error) => {
     console.error("Error sending traces:", error);
   }
 });
 tracerProvider.addSpanProcessor(spanProcessor);

 // register globally
 tracerProvider.register({
   propagator: new W3CTraceContextPropagator()
 });

 // add http automatic instrumentation
 registerInstrumentations({
   instrumentations: [
     new HttpInstrumentation()
   ],
 });

 return tracerProvider;
}

async function fetchUrl(url) {
 return new Promise((resolve, reject) => {
   const isHttps = url.startsWith("https://");
   const httpLib = isHttps ? https : http;
   const request = httpLib.get(url, (res) => {
     console.log(`${url} status code - ${res.statusCode}`);
     const responseData = [];
     res.on("error", (error) => {
       console.error(`${url} response error - ${error}`);
       reject(error);
     });
     res.on("data", (chunk) => {
       responseData.push(chunk);
     });
     res.on("end", () => {
       resolve({ statusCode: res.statusCode, data: responseData });
     });
   });

   request.on("error", error => {
     console.error(`${url} request error - ${error}`);
     reject(error);
   });
   request.end();
 });
}

async function handleRequest(req, res) {
 // Perform outgoing HTTP calls
 await fetchUrl('https://example.com');
 await fetchUrl('http://example.net');

 let message = req.query.message || req.body.message || 'Hello World!';
 res.status(200).send(message);
};

function setupHandler(handler, serviceName) {
 initializeOtel(serviceName);
 return (req, res) => {
   const span = trace.getSpan(context.active());

   if (span != null) {
     span.updateName(serviceName);
   }

   handler(req, res);
 };
}

exports.helloWorld = setupHandler(handleRequest, "helloWorld");

// Make sure the http(s) library is patched before the first call
require("http");
require("https");
Below is a high-level overview of the above code snippet:
Imports Modules: Imports OpenTelemetry modules and Node.js HTTP/HTTPS modules. Setup Logging: Configures diagnostic logging with DiagConsoleLogger.
Initialize OpenTelemetry:
- Creates
NodeTracerProviderwith service name. - Adds
OTLPTraceExporterandBatchSpanProcessor. - Registers
W3CTraceContextPropagatorand HTTP instrumentation.
HTTP GET Helper (fetchUrl):
- Performs HTTP/HTTPS GET requests.
- Logs status and handles response data and errors.
Request Handler (handleRequest):
- Performs outgoing HTTP requests.
- Extracts message from request and sends response.
Setup Handler (setupHandler):
- Initializes OpenTelemetry for the service.
- Wraps handler to update span name.
Export Handler: Exports the instrumented handler as welcometosignoz.
Patch HTTP/HTTPS: Ensures HTTP/HTTPS libraries are patched for tracing.
To install the required packages, add a package.json file to the source with the following content:
{
 "dependencies": {
   "@opentelemetry/api": "^1.0.4",
   "@opentelemetry/core": "^1.0.1",
   "@opentelemetry/exporter-trace-otlp-proto": "^0.27.0",
   "@opentelemetry/instrumentation": "^0.27.0",
   "@opentelemetry/instrumentation-http": "^0.27.0",
   "@opentelemetry/sdk-trace-node": "^1.0.1",
   "@opentelemetry/semantic-conventions": "^1.0.1"
 }
}
The package.json file should contain all the packages that your Cloud Function depends upon. This file is used by Google Cloud Function to create an environment with all the required packages.
Once you've finished writing your code, locate the DEPLOY button. After clicking the DEPLOY button, Google Cloud Function initiates deployment, starts provisioning the function according to the specified configuration, initializes the environment, handles dependencies, and makes the function ready to handle incoming requests.
Testing your cloud function
Step 1: After completing the deployment, navigate to the TRIGGER section to obtain the URL to invoke the function.
Deploying Cloud Function
Step 2: Hit the URL that you have obtained, you will see the function output.
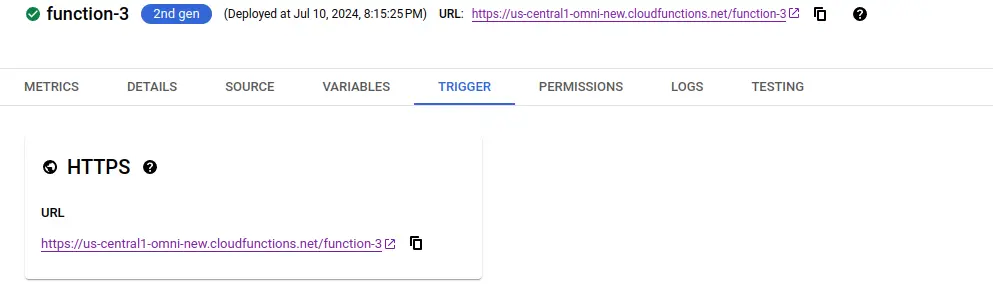
Cloud function URL.
Step 3: Click on the logs section in your Cloud Function to view the logs, indicating that the traces have been sent to SigNoz successfully.
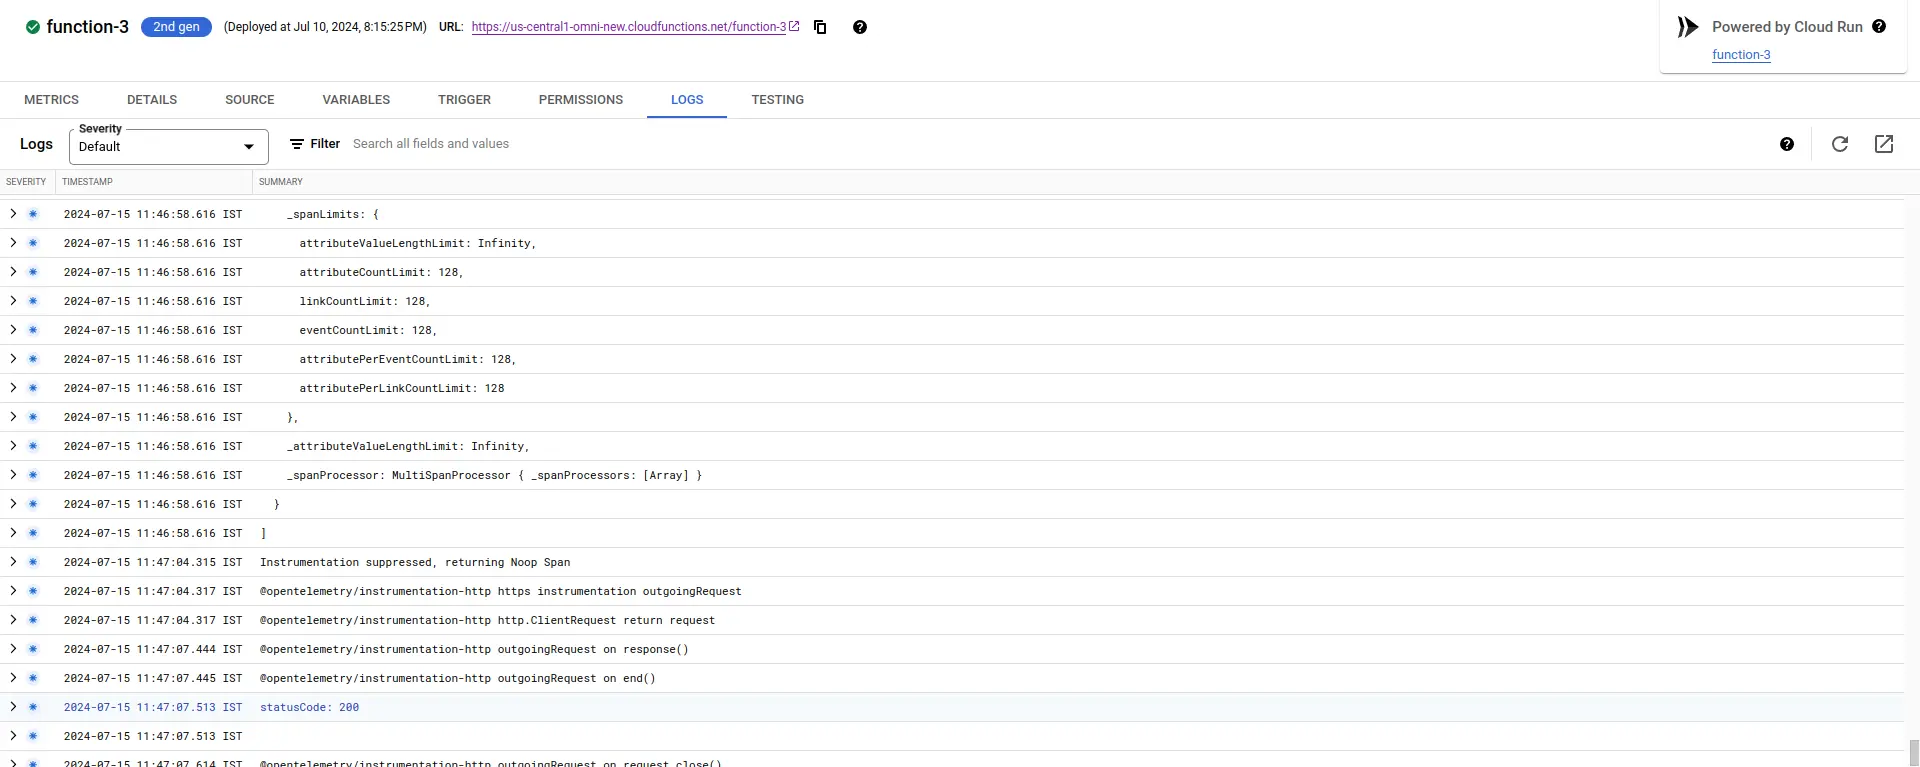
View Cloud Function Logs to verify traces being sent to SigNoz
Visualize the traces in SigNoz Cloud
Go to your SigNoz UI, and navigate to the SigNoz dashboard. Click on the traces section to view the traces.
Note: The default SigNoz dashboard endpoint would be http://<signoz-host-ip>:3301 in case of Self-Host installation, however, the URL can be different based on how you have set up the infrastructure.
Note: If you have multiple applications already sending traces to SigNoz, you can check by adding resource-type, resource-name, and resource-region filters in the Search filters field.

SigNoz Dashboard
That's it! You have successfully set up monitoring for your Cloud Function's traces with SigNoz Cloud.
Troubleshooting
If you encounter any issues while setting up monitoring for your Cloud Function's traces with SigNoz, here are a few troubleshooting steps you can try:
- Verify that your Cloud Function instance is running and accessible.
- Ensure that you have the necessary permissions to access the traces in your function.
- If you are using a SigNoz Cloud Account, check and mention the correct URL of the SigNoz Cloud account and the Ingestion(token) key.
By following this guide, you should be able to easily send the traces of your Google Cloud Function's system to SigNoz and gain valuable insights in case there is some issue.
Prerequisites
- Google Cloud account with administrative privilege or Cloud Functions Admin privilege.
- Access to a project in GCP
- Google Cloud Functions APIs enabled (follow this guide to see how to enable an API in Google Cloud)
Setup
Get started with Cloud Function Configuration
Follow these steps to create the Cloud Function:
Step 1: Go to your GCP console and search for Cloud Functions, go to Functions and click on CREATE FUNCTION.

GCP Cloud Functions
Step 2: Fill in the following details to create a Cloud Function:
- Environment: 2nd gen
- Function name: Name for the Cloud Function
- Region: Takes the default region of the GCP account
- Trigger: Defines how to trigger the Cloud Function
- Trigger Type: HTTPS - this allows us to trigger the Cloud Function using a URL
- Authentication: Choose whether you need authenticated or unauthenticated invocations. We have chosen an unauthenticated invocation for this demonstration.

Create Cloud Function
Step 3: Expand the Runtime, build, connections, and security settings section, and under Runtime environment variables:
Add OTEL_EXPORTER_OTLP_PROTOCOL with http. The Self-Hosted SigNoz endpoint would be http://<Self-Hosted SigNoz-host-ip>:4318.
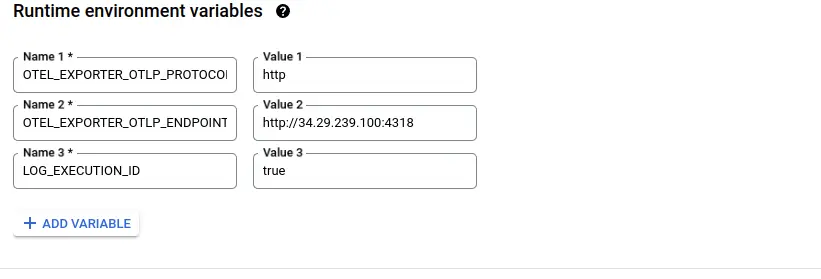
Set Cloud Function Runtime Environment Variables
Step 4: Click on the NEXT button, which will bring us to the page where we can add our code.

Set entrypoint and source code
Add code to the Google Cloud Function
For this demonstration, we will be using Node.js 20.
Below is the comprehensive code of the index.js file, followed by a high-level overview of what the code is doing.
const { trace, context, diag, DiagConsoleLogger, DiagLogLevel } = require("@opentelemetry/api");
const { NodeTracerProvider } = require('@opentelemetry/sdk-trace-node');
const { W3CTraceContextPropagator, AlwaysOnSampler } = require('@opentelemetry/core');
const { registerInstrumentations } = require('@opentelemetry/instrumentation');
const { HttpInstrumentation } = require('@opentelemetry/instrumentation-http');
const { SemanticResourceAttributes } = require('@opentelemetry/semantic-conventions');
const { OTLPTraceExporter } = require("@opentelemetry/exporter-trace-otlp-proto");
const { BatchSpanProcessor } = require("@opentelemetry/sdk-trace-base");
const { Resource } = require("@opentelemetry/resources");

const http = require("http");
const https = require("https");

diag.setLogger(new DiagConsoleLogger(), DiagLogLevel.ALL);

function initializeOtel(serviceIdentifier) {
 // create tracer provider
 const tracerProvider = new NodeTracerProvider({
   resource: new Resource({
     [SemanticResourceAttributes.SERVICE_NAME]: serviceIdentifier,
   }),
   sampler: new AlwaysOnSampler()
 });

 // add OTLP exporter
 const traceExporter = new OTLPTraceExporter();
  const spanProcessor = new BatchSpanProcessor(traceExporter, {
   onSuccess: () => {
     console.log("Traces sent successfully.");
   },
   onError: (error) => {
     console.error("Error sending traces:", error);
   }
 });
 tracerProvider.addSpanProcessor(spanProcessor);

 // register globally
 tracerProvider.register({
   propagator: new W3CTraceContextPropagator()
 });

 // add http automatic instrumentation
 registerInstrumentations({
   instrumentations: [
     new HttpInstrumentation()
   ],
 });

 return tracerProvider;
}

async function fetchUrl(url) {
 return new Promise((resolve, reject) => {
   const isHttps = url.startsWith("https://");
   const httpLib = isHttps ? https : http;
   const request = httpLib.get(url, (res) => {
     console.log(`${url} status code - ${res.statusCode}`);
     const responseData = [];
     res.on("error", (error) => {
       console.error(`${url} response error - ${error}`);
       reject(error);
     });
     res.on("data", (chunk) => {
       responseData.push(chunk);
     });
     res.on("end", () => {
       resolve({ statusCode: res.statusCode, data: responseData });
     });
   });

   request.on("error", error => {
     console.error(`${url} request error - ${error}`);
     reject(error);
   });
   request.end();
 });
}

async function handleRequest(req, res) {
 // Perform outgoing HTTP calls
 await fetchUrl('https://example.com');
 await fetchUrl('http://example.net');

 let message = req.query.message || req.body.message || 'Hello World!';
 res.status(200).send(message);
};

function setupHandler(handler, serviceName) {
 initializeOtel(serviceName);
 return (req, res) => {
   const span = trace.getSpan(context.active());

   if (span != null) {
     span.updateName(serviceName);
   }

   handler(req, res);
 };
}

exports.helloWorld = setupHandler(handleRequest, "helloWorld");

// Make sure the http(s) library is patched before the first call
require("http");
require("https");
Below is a high-level overview of the above code snippet:
Imports Modules: Imports OpenTelemetry modules and Node.js HTTP/HTTPS modules.
Setup Logging: Configures diagnostic logging with DiagConsoleLogger.
Initialize OpenTelemetry:
- Creates
NodeTracerProviderwith service name. - Adds
OTLPTraceExporterandBatchSpanProcessor. - Registers
W3CTraceContextPropagatorand HTTP instrumentation.
HTTP GET Helper (fetchUrl):
- Performs HTTP/HTTPS GET requests.
- Logs status and handles response data and errors.
Request Handler (handleRequest):
- Performs outgoing HTTP requests.
- Extracts message from request and sends response.
Setup Handler (setupHandler):
- Initializes OpenTelemetry for the service.
- Wraps handler to update span name.
Export Handler: Exports the instrumented handler as welcometoSelf-Hosted SigNoz.
Patch HTTP/HTTPS: Ensures HTTP/HTTPS libraries are patched for tracing.
To install the required packages, add a package.json file to the source with the following content:
{
 "dependencies": {
   "@opentelemetry/api": "^1.0.4",
   "@opentelemetry/core": "^1.0.1",
   "@opentelemetry/exporter-trace-otlp-proto": "^0.27.0",
   "@opentelemetry/instrumentation": "^0.27.0",
   "@opentelemetry/instrumentation-http": "^0.27.0",
   "@opentelemetry/sdk-trace-node": "^1.0.1",
   "@opentelemetry/semantic-conventions": "^1.0.1"
 }
}
The package.json file should contain all the packages that your Cloud Function depends upon. This file is used by Google Cloud Function to create an environment with all the required packages.
Once you've finished writing your code, locate the DEPLOY button. After clicking the DEPLOY button, Google Cloud Function initiates deployment, starts provisioning the function according to the specified configuration, initializes the environment, handles dependencies, and makes the function ready to handle incoming requests.
Testing your cloud function
Step 1: After completing the deployment, navigate to the TRIGGER section to obtain the URL to invoke the function.

Deploying Cloud Function
Step 2: Hit the URL that you have obtained, you will see the function output.

Cloud function URL.
Step 3: Click on the logs section in your Cloud Function to view the logs, indicating that the traces have been sent to Self-Hosted SigNoz successfully.

View Cloud Function Logs to verify traces being sent to SigNoz
Visualize the traces in Self-Hosted SigNoz
Go to your Self-Hosted SigNoz UI, and navigate to the Self-Hosted SigNoz dashboard. Click on the traces section to view the traces.
Note: The default Self-Hosted SigNoz dashboard endpoint would be http://<Self-Hosted SigNoz-host-ip>:3301, however, the URL can be different based on how you have set up the infrastructure.
Note: If you have multiple applications already sending traces to Self-Hosted SigNoz, you can check by adding resource-type, resource-name, and resource-region filters in the Search filters field.
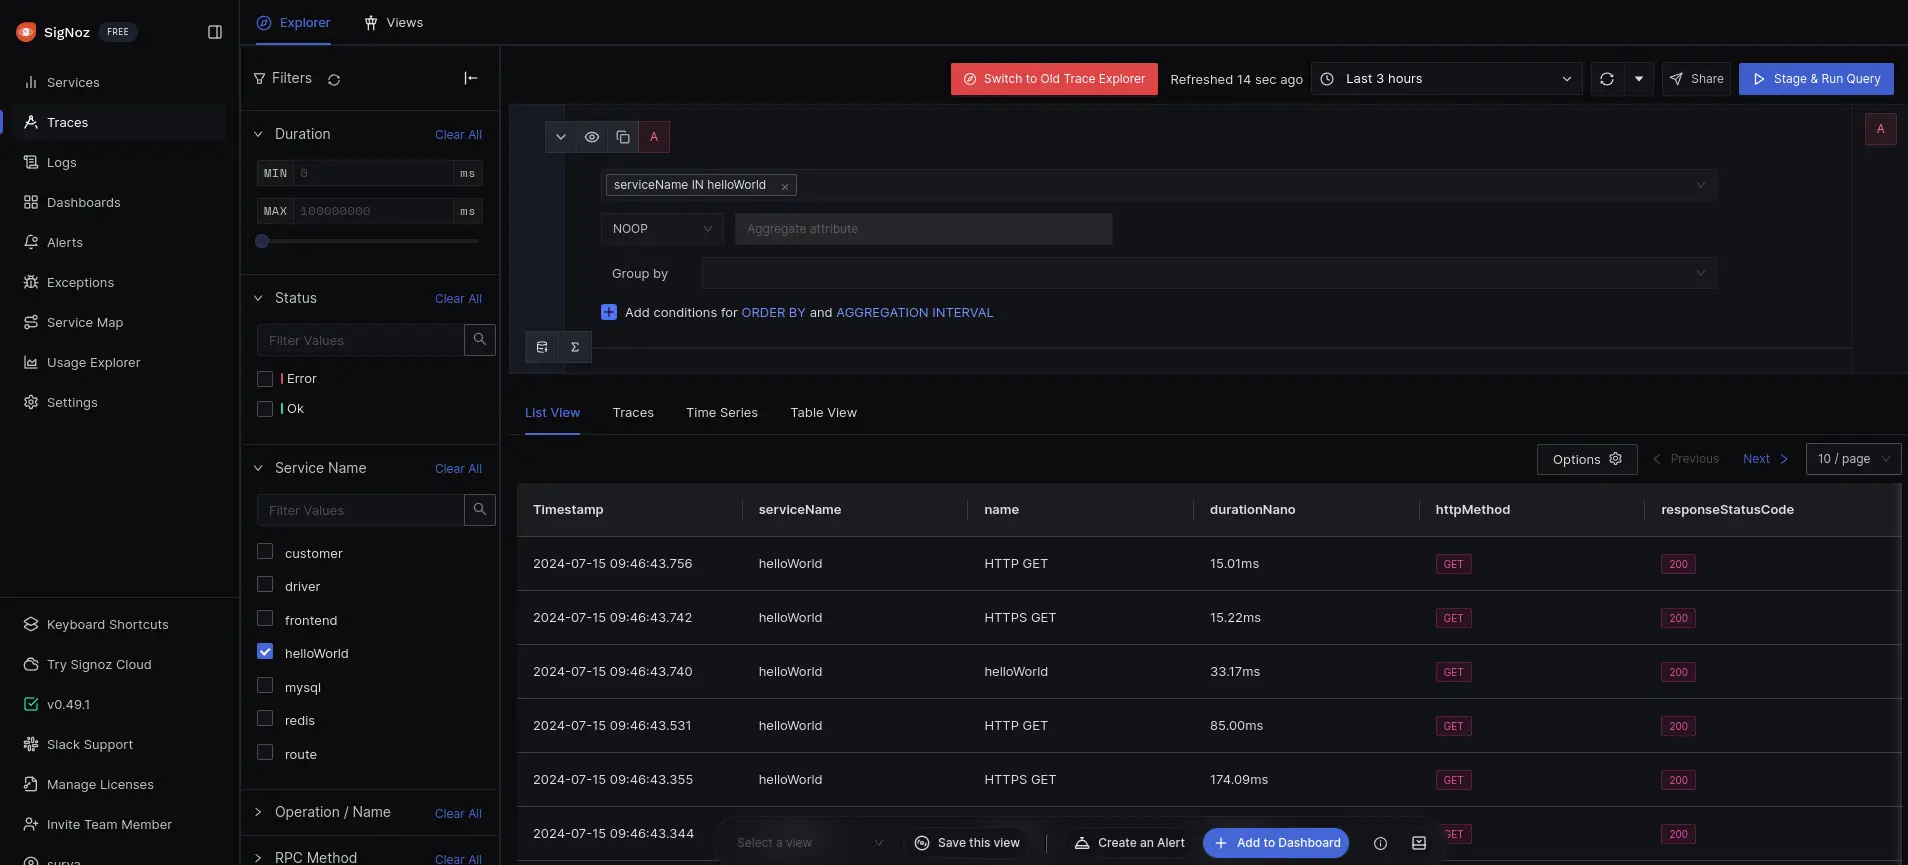
SigNoz Dashboard
That's it! You have successfully set up monitoring for your Cloud Function's traces with Self-Hosted SigNoz Cloud.
Troubleshooting
If you encounter any issues while setting up monitoring for your Cloud Function's traces with Self-Hosted SigNoz, here are a few troubleshooting steps you can try:
- Verify that your Cloud Function instance is running and accessible.
- Ensure that you have the necessary permissions to access the traces in your function.
- Check and mention the correct
OTEL_EXPORTER_OTLP_ENDPOINT and OTEL_EXPORTER_OTLP_PROTOCOLof the Self-Hosted SigNoz, OTEL configuration, and routing.
By following this guide, you should be able to easily send the traces of your Google Cloud Function's system to Self-Hosted SigNoz and gain valuable insights in case there is some issue.
