What is Hermes Monitoring?
Hermes monitoring gives you full visibility into your AI coding agent's behavior. This guide walks you through setting up Hermes monitoring and observability using OpenTelemetry and exporting traces, metrics, and logs to SigNoz. With this integration, you can observe and track your Hermes AI agent sessions, LLM calls, tool invocations, and more.
With full Hermes monitoring in SigNoz, you can correlate traces, logs, and metrics in unified dashboards, set alerts on latency and errors, and improve the reliability of your AI coding workflows. This end to end Hermes observability gives you actionable insight into every agent session, LLM call, and tool invocation.
Prerequisites
- A SigNoz Cloud account with an active ingestion key or Self Hosted SigNoz instance
- A Hermes instance. Follow the Hermes quickstart guide to get set up
Instrument Hermes Monitoring with OpenTelemetry
For more information on instrumenting Hermes with OpenTelemetry, refer to the hermes-otel plugin documentation.
Step 1: Install Hermes Agent
curl -fsSL https://hermes-agent.nousresearch.com/install.sh | bash
Restart your shell or source your shell config if hermes is not immediately available.
Verify:
hermes --version
Run the setup wizard if this is a fresh Hermes install:
hermes setup
Step 2: Install the OpenTelemetry plugin
hermes plugins install briancaffey/hermes-otel --enable
The plugin is installed to:
~/.hermes/plugins/hermes_otel/
Install the plugin runtime dependencies into the Hermes Agent virtual environment:
~/.hermes/hermes-agent/venv/bin/pip install -e ~/.hermes/plugins/hermes_otel
If that path does not exist, find the Hermes venv and run its pip instead:
find ~/.hermes -path '*/venv/bin/pip' -print
/path/that/was/printed/bin/pip install -e ~/.hermes/plugins/hermes_otel
Verify the plugin is enabled:
hermes plugins list --plain --no-bundled | grep hermes_otel
hermes_otel is listed as enabled.
Step 3: Add SigNoz environment variables
Edit Hermes' environment file at ~/.hermes/.env and add these values:
OTEL_SIGNOZ_ENDPOINT=https://ingest.<region>.signoz.cloud:443/v1/traces
OTEL_SIGNOZ_INGESTION_KEY=<your-ingestion-key>
OTEL_PROJECT_NAME=hermes-agent
<region>: Your SigNoz Cloud region<your-ingestion-key>: Your SigNoz ingestion keyOTEL_PROJECT_NAMEis the resource name you will see in SigNoz.
Step 4: Configure traces, metrics, and logs
Create or edit the plugin config:
mkdir -p ~/.hermes/plugins/hermes_otel
${EDITOR:-nano} ~/.hermes/plugins/hermes_otel/config.yaml
Use this minimal config:
# Enable the plugin.
enabled: true

# Capture input/output previews on spans. Set false if you do not want prompt,
# tool, or response previews sent to SigNoz.
capture_previews: true

# Enable Python logging export through OpenTelemetry.
capture_logs: true
log_level: INFO
log_attach_logger: null

# Optional: metrics export interval. Lower values show metrics faster but send
# more requests.
flush_interval_ms: 60000

# Explicit SigNoz backend. This is the recommended reproducible config for
# traces + metrics + logs.
backends:
  - type: signoz
    endpoint: https://ingest.us.signoz.cloud:443/v1/traces
    ingestion_key_env: OTEL_SIGNOZ_INGESTION_KEY
    traces: true
    metrics: true
    logs: true
If your endpoint is not SigNoz Cloud US, replace the endpoint: value with your SigNoz OTLP HTTP traces endpoint.
Using an explicit backends: entry makes the setup reproducible, enables all three signals (traces, metrics, and logs), and keeps secrets in .env via ingestion_key_env rather than hardcoding them in YAML.
Step 5: Restart Hermes
Config is read at process startup. For the gateway service:
hermes gateway restart
For CLI/TUI use, quit Hermes and start it again:
hermes
Step 6: Generate telemetry
Run a simple Hermes interaction:
hermes chat -q "Say hello and list the current working directory using a tool."
This produces an agent root span, LLM/API spans, tool spans if tools are used, Hermes metrics, and Python log records.
Step 7: Verify locally
Check plugin startup logs:
grep -Ei 'hermes-otel|signoz|Logs' ~/.hermes/logs/*.log | tail -80
Healthy output should include lines like:
[hermes-otel] ✓ SigNoz at https://ingest.us.signoz.cloud:443/v1/traces
[hermes-otel] ✓ Logs → 1 backend(s) (attached to root, level=INFO)
[hermes-otel] Registered 8 hooks
You can also verify config resolution without exposing secrets:
PYTHONPATH=$HOME/.hermes/plugins python - <<'PY'
from hermes_otel.plugin_config import load_config
from hermes_otel.backends import resolve

cfg = load_config()
print('capture_logs:', cfg.capture_logs)
print('backends_configured:', len(cfg.backends or ()))
for bc in cfg.backends or ():
    b = resolve(bc)
    print(f'backend={b.display_name} type={b.type} traces={b.supports_traces} metrics={b.supports_metrics} logs={b.supports_logs}')
    print('endpoint:', b.endpoint)
PY
Expected output:
capture_logs: True
backends_configured: 1
backend=SigNoz type=signoz traces=True metrics=True logs=True
endpoint: https://ingest.us.signoz.cloud:443/v1/traces
View Hermes Traces, Logs, and Metrics in SigNoz
Once configured, your Hermes application automatically emits traces, metrics, and logs. In SigNoz, look for a service named hermes-agent.
Hermes traces are available in SigNoz under the Traces tab:

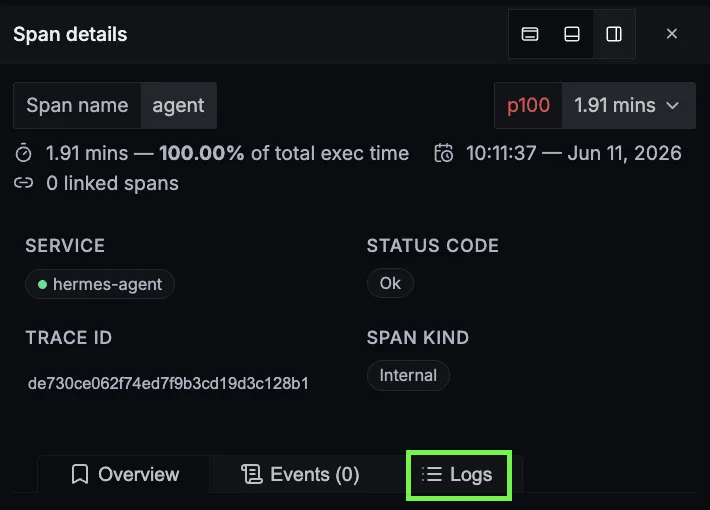
When you click on a trace in SigNoz, you'll see a detailed view of the trace, including all associated spans, along with their events and attributes.

Hermes logs are available in SigNoz under the Logs tab. You can also view logs by clicking on the “Logs" section in the trace view to see correlated logs:

When you click on any of these logs in SigNoz, you'll see a detailed view of the log, including attributes:

Hermes related metrics are available in SigNoz under the Metrics tab:

When you click on any of these metrics in SigNoz, you'll see a detailed view of the metric, including attributes:

Hermes Monitoring Dashboard
You can also check out our custom Hermes Agent dashboard which provides specialized visualizations for monitoring your Hermes usage. The dashboard includes pre-built charts specifically tailored for LLM usage, along with import instructions to get started quickly.

Troubleshooting Hermes Monitoring
hermes_otel is not listed
Install and enable the plugin again:
hermes plugins install briancaffey/hermes-otel --enable
Logs do not appear, but traces do
Make sure all of these are present in ~/.hermes/plugins/hermes_otel/config.yaml:
capture_logs: true
backends:
  - type: signoz
    logs: true
Then restart Hermes. Healthy startup should include:
[hermes-otel] ✓ Logs → 1 backend(s)
If you see the following warning, the logs pipeline is not configured correctly:
capture_logs=true but no configured backend accepts OTLP logs
Use the explicit backends: config shown in Step 4.
No data in SigNoz
Check the plugin list and logs for errors:
hermes plugins list --plain --no-bundled
grep -Ei 'hermes-otel|opentelemetry|signoz|error|warning' ~/.hermes/logs/*.log | tail -120
Common causes:
- Wrong SigNoz endpoint - verify it ends with
/v1/tracesand matches your SigNoz region - Wrong or missing
OTEL_SIGNOZ_INGESTION_KEYin~/.hermes/.env - Hermes was not restarted after changing
.envorconfig.yaml - Plugin dependencies were not installed into the Hermes virtual environment (see Step 2)
Setup OpenTelemetry Collector (Optional)
What is the OpenTelemetry Collector?
Think of the OTel Collector as a middleman between your app and SigNoz. Instead of your application sending data directly to SigNoz, it sends everything to the Collector first, which then forwards it along.
Why use it?
- Cleaning up data - Filter out noisy traces you don't care about, or remove sensitive info before it leaves your servers.
- Keeping your app lightweight - Let the Collector handle batching, retries, and compression instead of your application code.
- Adding context automatically - The Collector can tag your data with useful info like which Kubernetes pod or cloud region it came from.
- Future flexibility - Want to send data to multiple backends later? The Collector makes that easy without changing your app.
See Switch from direct export to Collector for step-by-step instructions to convert your setup.
For more details, see Why use the OpenTelemetry Collector? and the Collector configuration guide.
Additional resources:
- Set up alerts for high latency or error rates
- Learn more about querying traces
- Explore log correlation
