SigNoz Infrastructure Monitoring gives you a unified view of host and Kubernetes performance, traces, and logs. Use it to understand how infrastructure health impacts your applications and quickly drill from high-level lists into a single host, node, or pod.

Start monitoring your infrastructure in 3 simple steps: First, choose your infrastructure data source (Host or Kubernetes). Then, configure OpenTelemetry Collector with our templates. Finally, visualize your infrastructure data in our comprehensive dashboards.
Overview
Infrastructure Monitoring includes two main views:
- Hosts – monitor physical or virtual machines with CPU, memory, disk, and network metrics, plus correlated traces and logs.
- Kubernetes – monitor clusters, nodes, namespaces, deployments, and pods with resource utilization and workload health.
Both views share common controls for time range, filtering, and navigation so you can move between metrics, traces, logs, and events without losing context.
Explore infrastructure views
Host List View
The main screen of the Host interface displays a list of all monitored hosts in your infrastructure along with some key metrics in a tabular format.
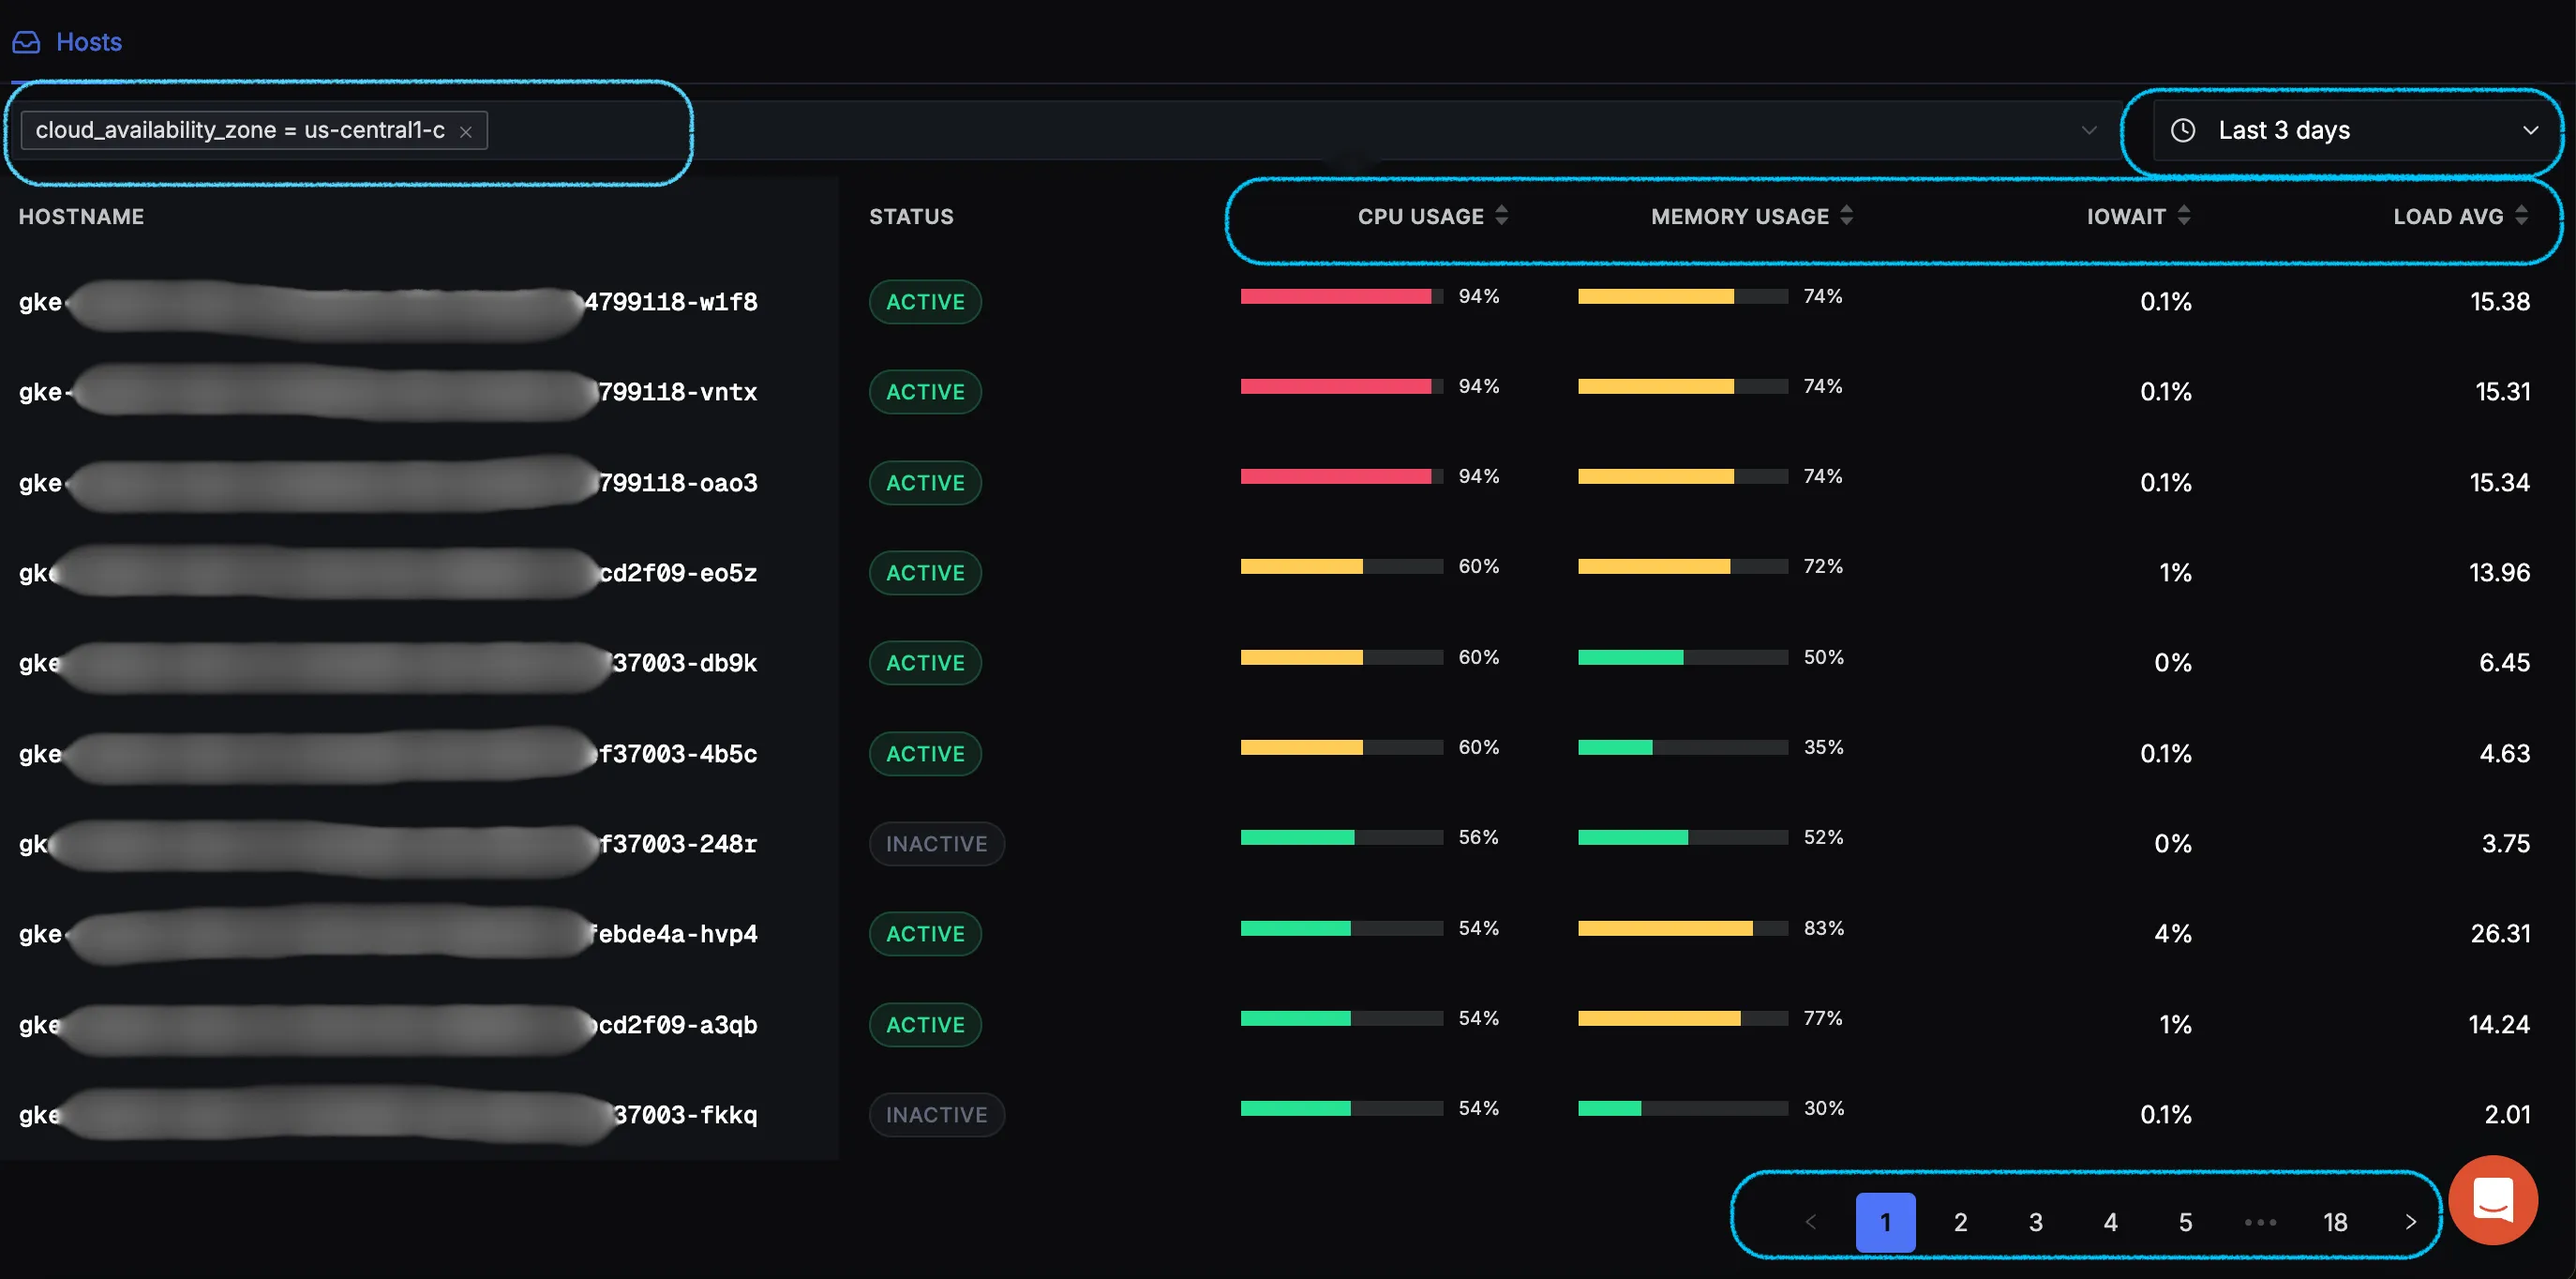
Table Columns
- Host Name: System hostname or identifier
- Status: Current operational status of the host -
ACTIVEorINACTIVE - CPU: CPU utilization percentage
- Memory: Memory usage percentage
- IOWait: Percentage of time CPU is waiting for I/O operations to complete
- Load Average: System load average value
Features:
- A search functionality to quickly locate specific hosts using different attributes
- Paginated results for efficient navigation through large host sets
- Sortable columns for easy comparison
- Real-time metric updates
Host Details
Selecting a host opens a detailed view with three main sections: Metrics, Traces, and Logs.
Metrics Tab
Monitor host performance metrics across customizable time periods.
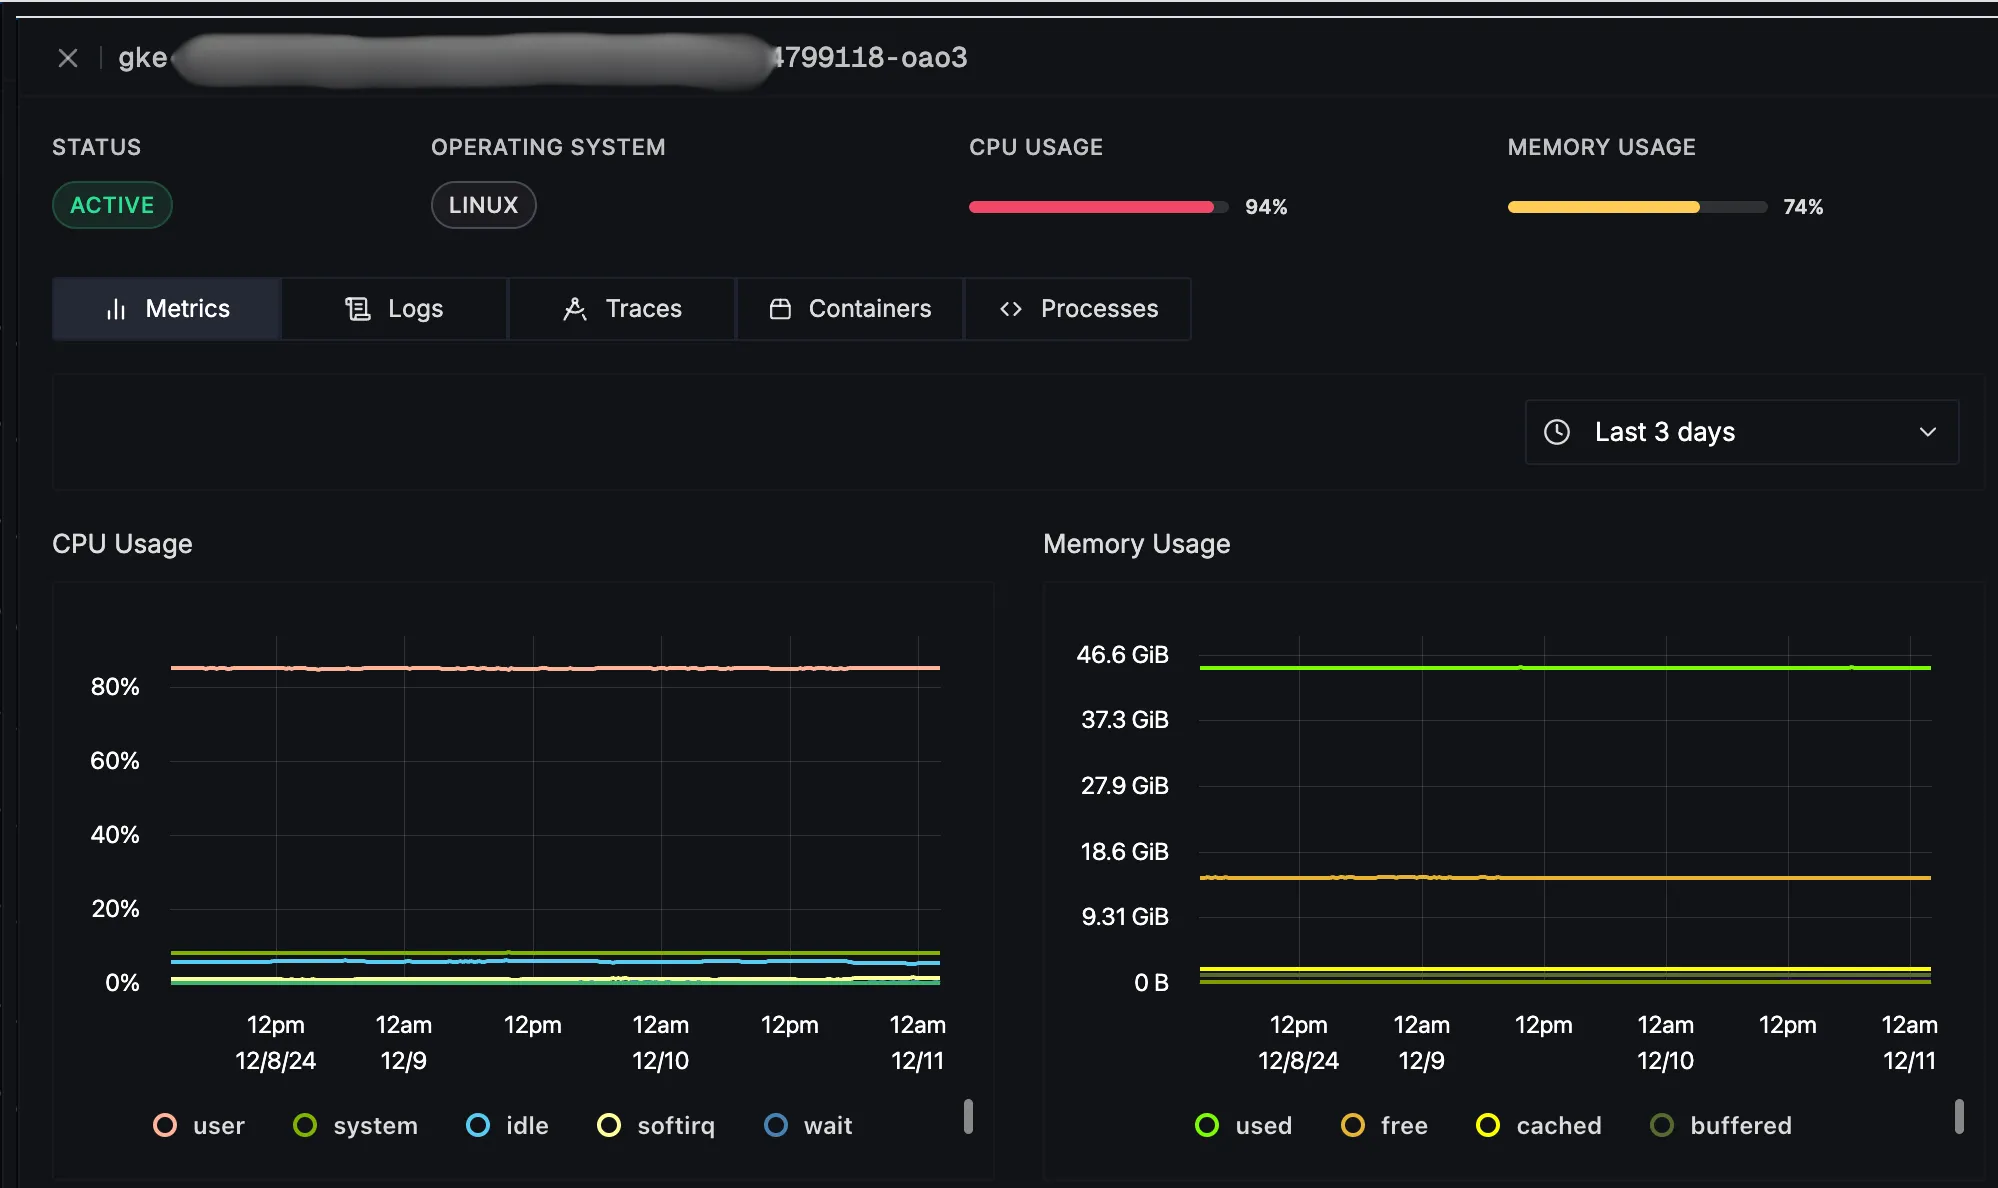
Available Metrics:
System Performance
- CPU Usage: Overall CPU utilization percentage
- Memory Usage: Physical memory consumption percentage
- System Load Average: Average system load over time
- Queue Size: Number of processes waiting for CPU time
Network Performance
- Network Usage (Bytes): Inbound and outbound network traffic in bytes
- Network Usage (Packets/s): Packet rate for network interfaces
- Network Errors: Count of network interface errors
- Network Drops: Number of dropped network packets
- Network Connections: Active network connection count
Disk Performance
- System Disk I/O (Bytes): Total bytes read/written to disk
- System Disk Operations/s: Rate of read/write operations
- Disk Operations Time: Average time taken for disk operations
Time Range Selection:
- Choose from preset time ranges (e.g., last hour, last 24 hours)
- Set custom time ranges using the date-time picker
- Change your timezone according to your preference
Traces Tab
View and analyze distributed traces associated with the selected host.
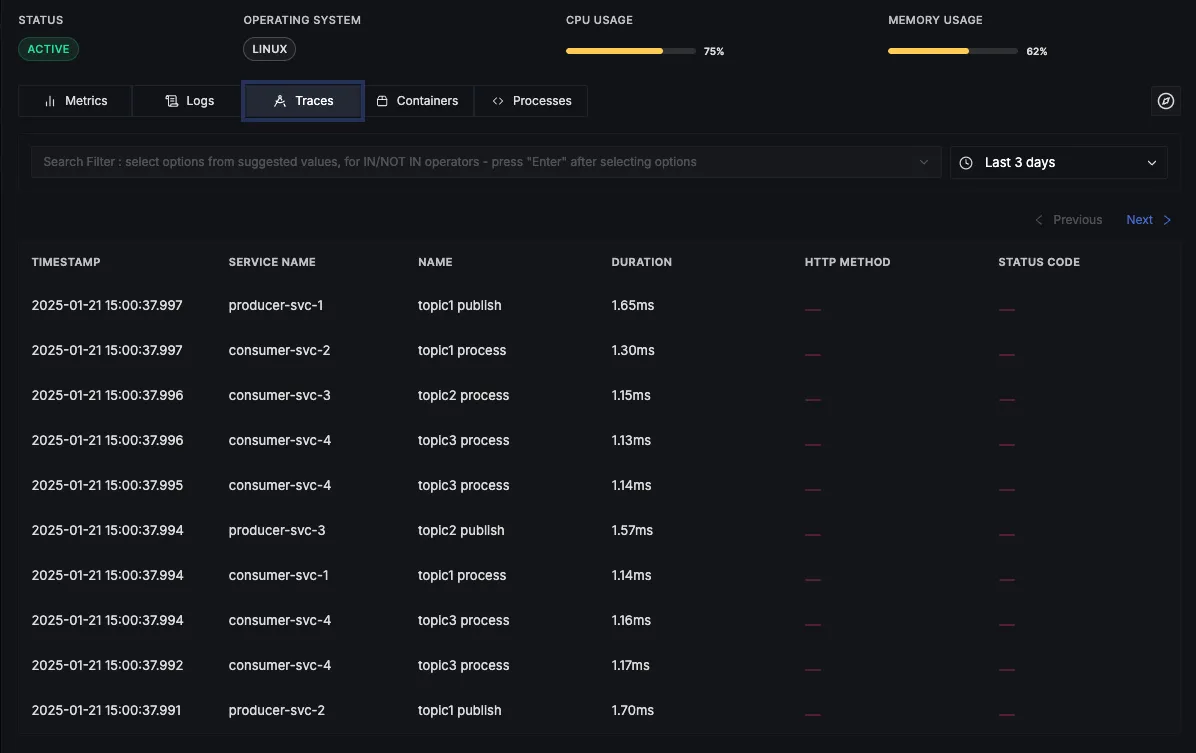
Features:
- Adjustable time range selection for trace analysis
- Advanced filtering capabilities to focus on specific trace attributes
- Direct integration with the Traces Explorer feature for deeper analysis
- The "Explore in Traces Explorer" button opens the trace in the full interface, retaining time ranges and filters
Filter Options:
- Service name: Focus on traces from specific services
- Operation type: Filter by specific operations or endpoints (e.g., GET, POST)
- Status/Error codes: Identify traces with specific success or error statuses
- Custom attributes: Refine traces using user-defined tags or metadata
Logs Tab
Access and search through host logs with powerful filtering capabilities.
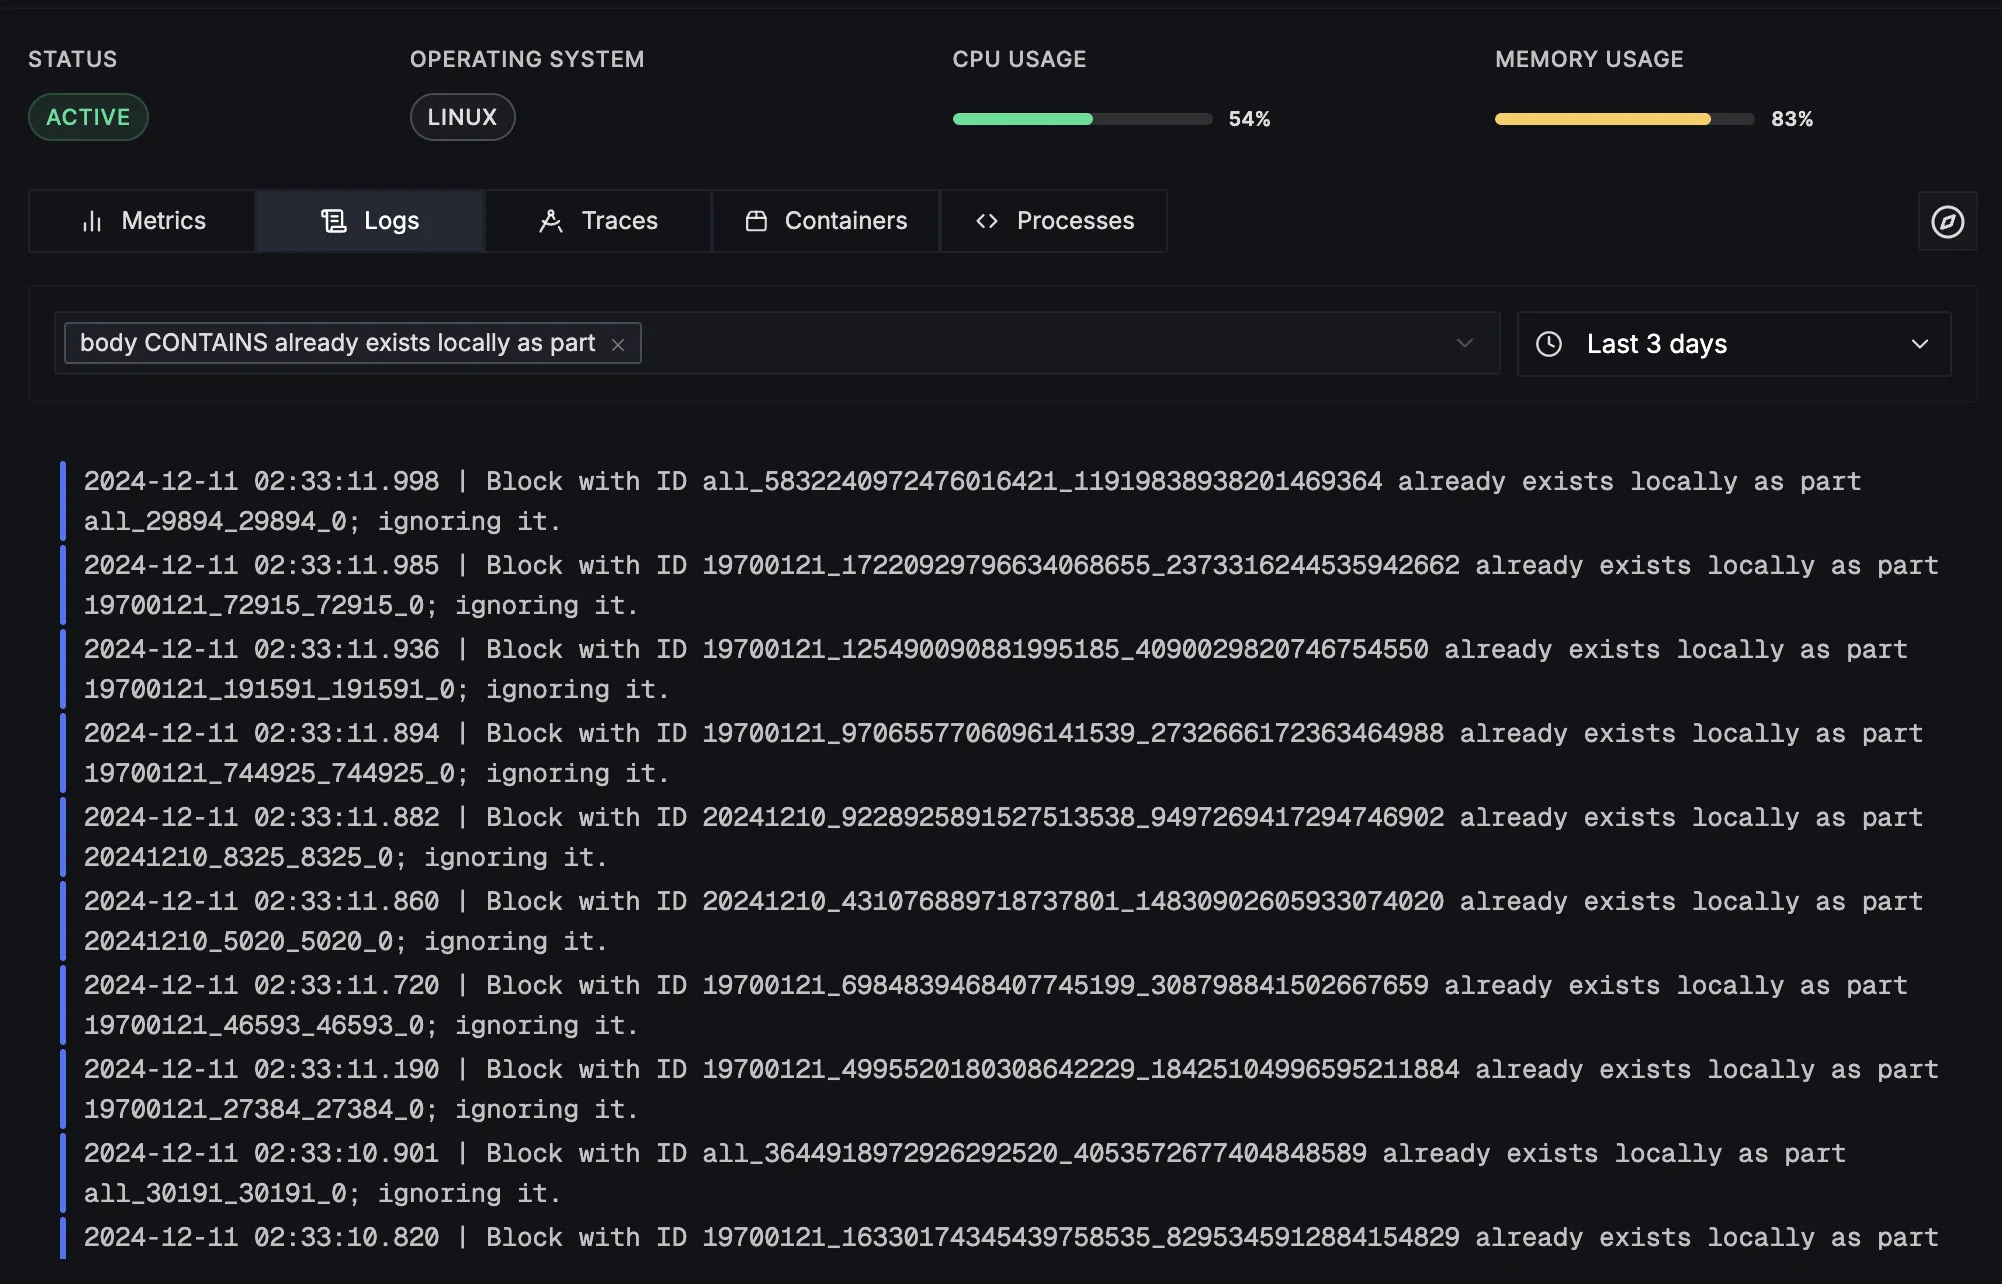
Features:
- Configurable time range selection for log analysis.
- Comprehensive filtering system.
- Seamless integration with the Logs Explorer feature.
- The "Explore in Logs Explorer" button opens the full logs interface, keeping time ranges and filters.
- Highlighted warning and error messages.
Filter Categories:
- Log Levels: Filter logs by severity (e.g., INFO, WARN, ERROR).
- Service Components: Focus on specific services or application components generating the logs.
- Message Content: Search for specific keywords or patterns in log messages.
- Custom Fields: Apply filters based on user-defined metadata fields for more tailored insights.
Kubernetes Cluster View
The Kubernetes monitoring interface provides real-time visibility into your Kubernetes cluster, tracking Pods, Nodes, Namespaces, Clusters, and Deployments along with their performance metrics.
Kubernetes Monitoring Views
The Kubernetes monitoring interface offers multiple views to analyze different aspects of your Kubernetes cluster. Users can switch between:
- Pods View (Default): Displays all active pods and their resource consumption.
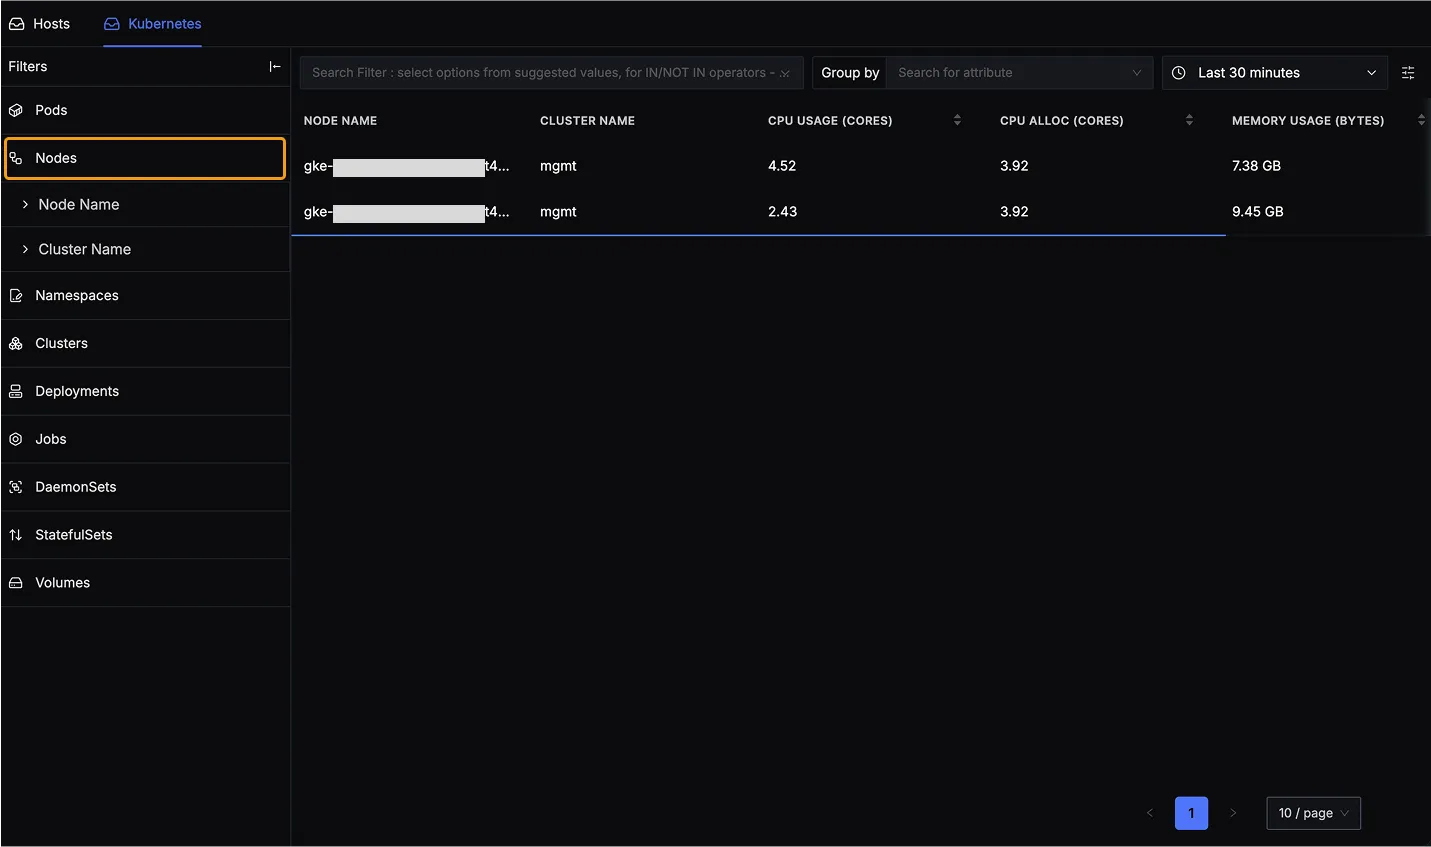
- Nodes View: Provides insights into the performance of individual nodes.
- Namespaces View: Allows monitoring of resource usage per namespace.
- Clusters View: Offers an overview of resource allocation across different clusters.
- Deployments View: Tracks deployment statuses, availability, and resource consumption.
- Jobs, DaemonSets, StatefulSets, and Volumes Views: Enable monitoring of specific Kubernetes workloads.
By default, the Pods View is selected, offering a detailed breakdown of pod-level resource utilization.
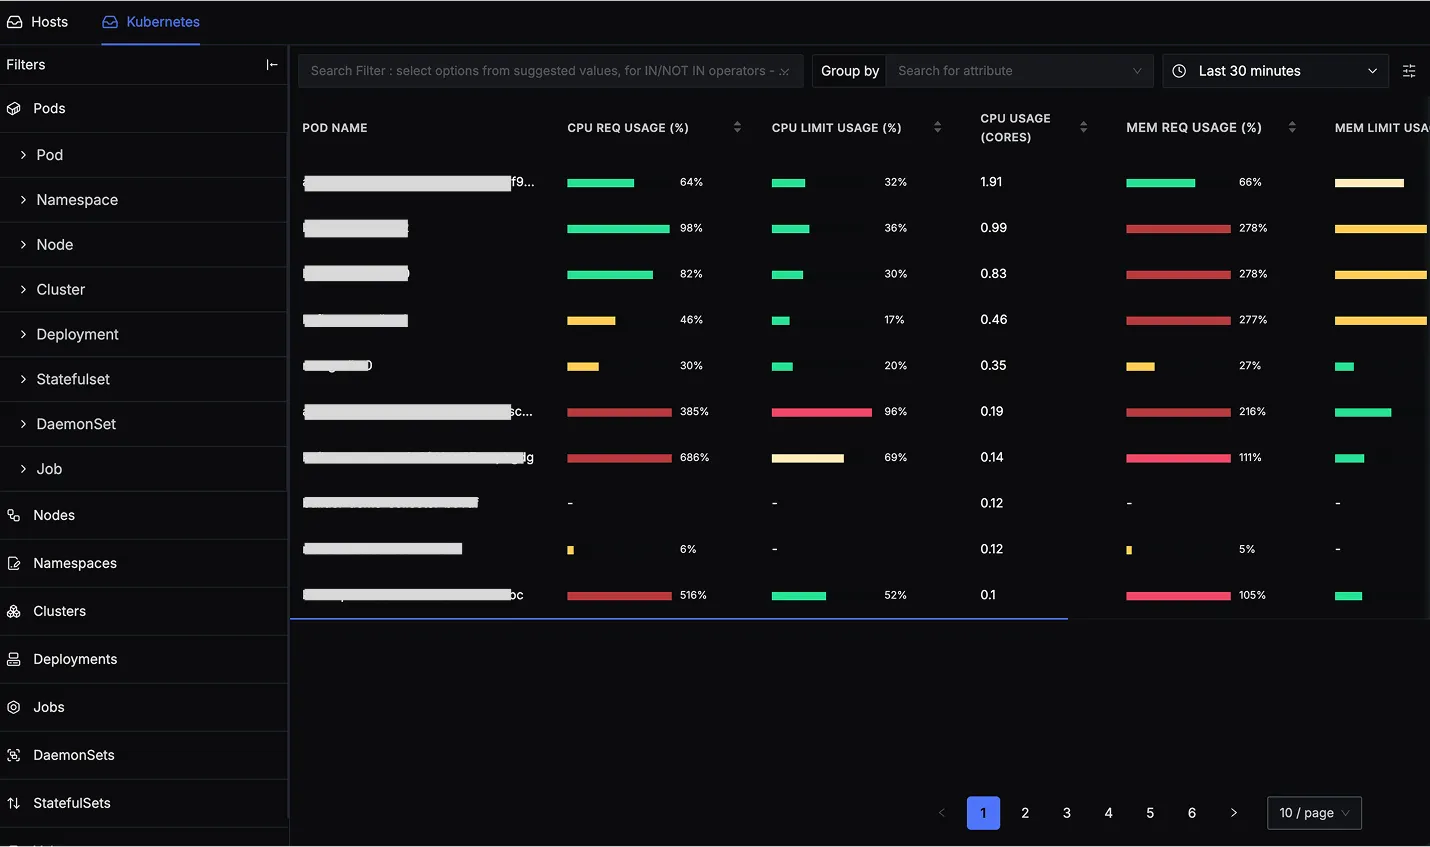
Pods View: Monitoring Kubernetes Pods
The Pods View provides real-time visibility into pod resource utilization, enabling users to track CPU, memory, and network performance.
Table Columns
- Pod Name: Name of the Kubernetes pod.
- Available: Number of available pod replicas.
- Desired: Desired number of pod replicas.
- CPU Request Usage (%): Percentage of requested CPU being utilized.
- CPU Limit Usage (%): Percentage of CPU limit being used.
- CPU Usage (Cores): Actual CPU consumption in cores.
- Memory Request Usage (%): Percentage of requested memory being used.
- Memory Limit Usage (%): Percentage of allocated memory limit being used.
- Memory Usage: Total memory consumption in bytes.
- Namespace Name: The namespace where the pod is running.
Features:
- Search & Filtering: Quickly locate specific pods using various filters.
- Group By Attribute: Group pods by Namespace, Node, or Deployment.
- Sortable Metrics: Sort columns for better trend analysis.
Filtering and Selection Panel
The left-side Filters Panel allows users to navigate through different Kubernetes resources, applying filters to refine their view.
Available Filters:
- Pods: View and filter by active Kubernetes pods.
- Nodes: Monitor resource utilization for different Kubernetes nodes.
- Namespaces: Filter metrics based on Kubernetes namespaces.
- Clusters: Select and monitor specific clusters.
- Deployments: Track resource utilization and availability at the deployment level.
- Jobs: Monitor Kubernetes jobs and their execution status.
- DaemonSets: Analyze DaemonSet performance metrics.
- StatefulSets: Monitor StatefulSets and their associated workloads.
- Volumes: Track storage usage and volume allocations.
Metrics Tab: Pod Performance Monitoring
The Metrics Tab provides an in-depth visualization of CPU, memory, and network performance for a selected pod. Users can analyze historical trends and identify resource bottlenecks over a custom time range.
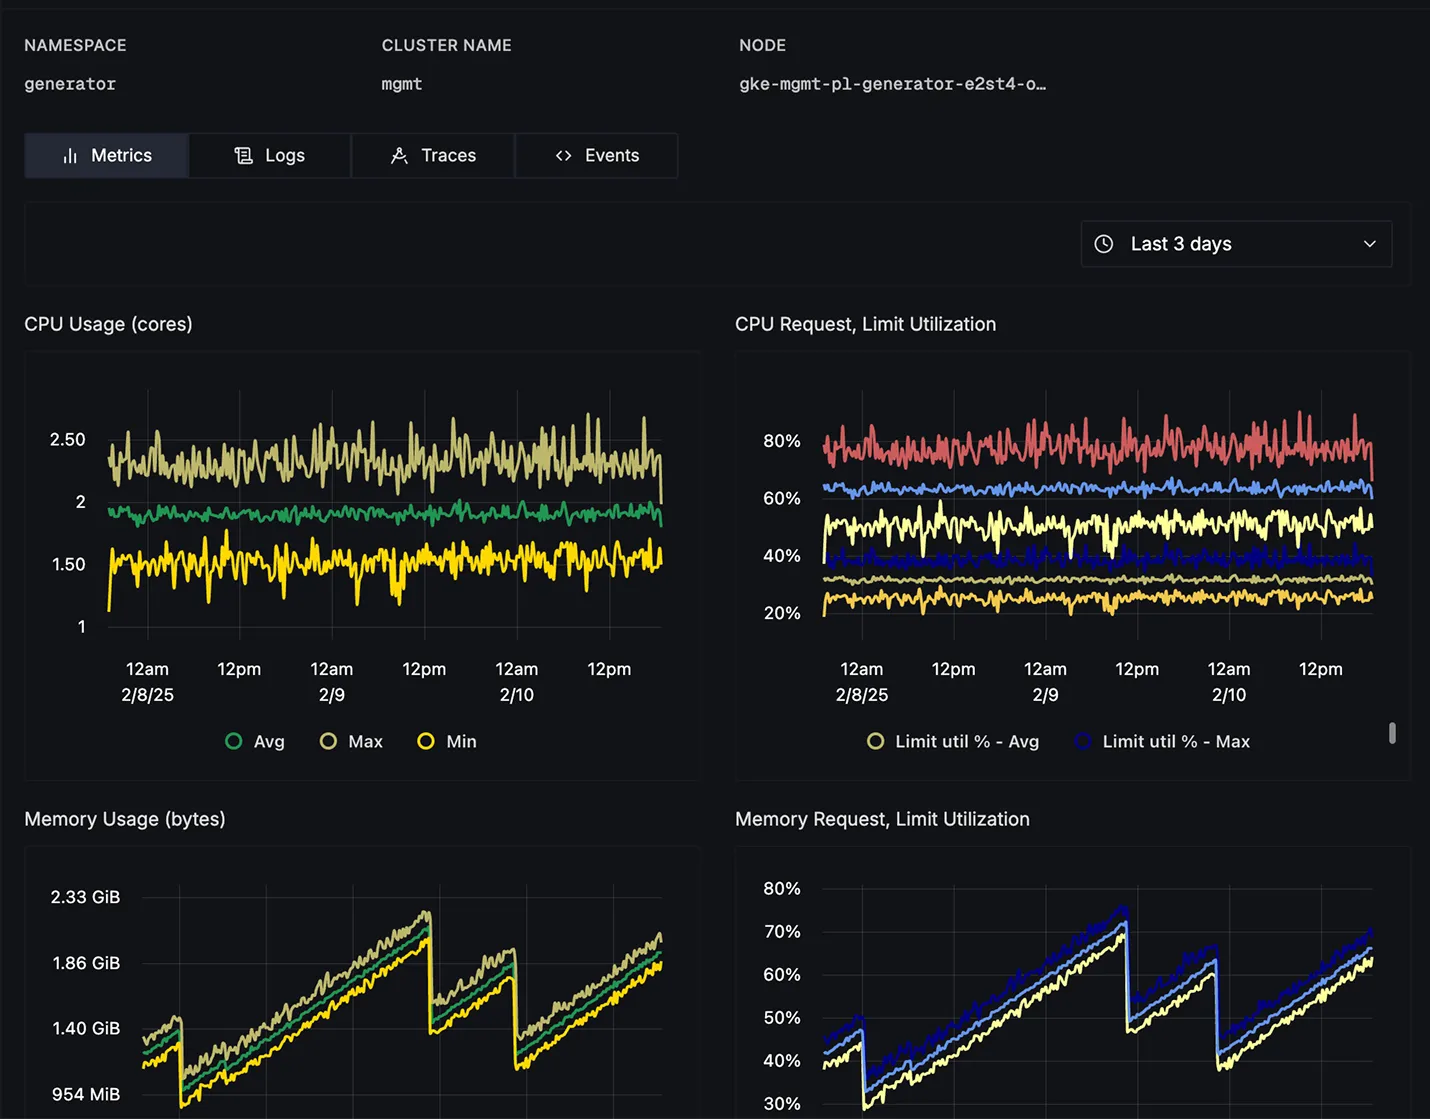
Available Metrics
CPU Metrics
- CPU Usage (Cores): Displays real-time and historical CPU consumption using min, avg, and max values.
- CPU Request, Limit Utilization (%): Tracks CPU requests vs. limits to prevent over-allocation.
Memory Metrics
- Memory Usage (Bytes): Shows real-time memory consumption trends.
- Memory Request, Limit Utilization (%): Highlights memory utilization compared to requests and limits.
- Memory by State: Differentiates memory into RSS memory, working set memory, and cache memory.
- Memory Major Page Faults: Tracks page faults affecting performance.
Container-Specific Metrics
- CPU Usage by Container: Displays CPU utilization at the container level within the pod.
- CPU Request, Limit Utilization by Container: Monitors container-level CPU constraints.
- Memory Usage by Container: Tracks memory usage for each container in the pod.
- Memory Request, Limit Utilization by Container: Ensures container memory efficiency.
Network Metrics
- Network Rate (Bytes/s): Monitors network traffic sent (
transmit) and received (receive). - Network Errors: Tracks network-related failures at the interface level.
File System Metrics
- File System Usage (Bytes): Displays disk space usage over time.
Time Range Selection:
- Choose from preset time ranges (e.g., last 30 minutes, last 24 hours).
- Customize time ranges using the date-time picker.
- Change your timezone according to your preference.
Traces Tab: Pod Performance Monitoring
The Traces Tab provides a detailed view of distributed traces for requests processed by a selected pod. It helps users analyze request latency, identify slow operations, and debug microservices performance.
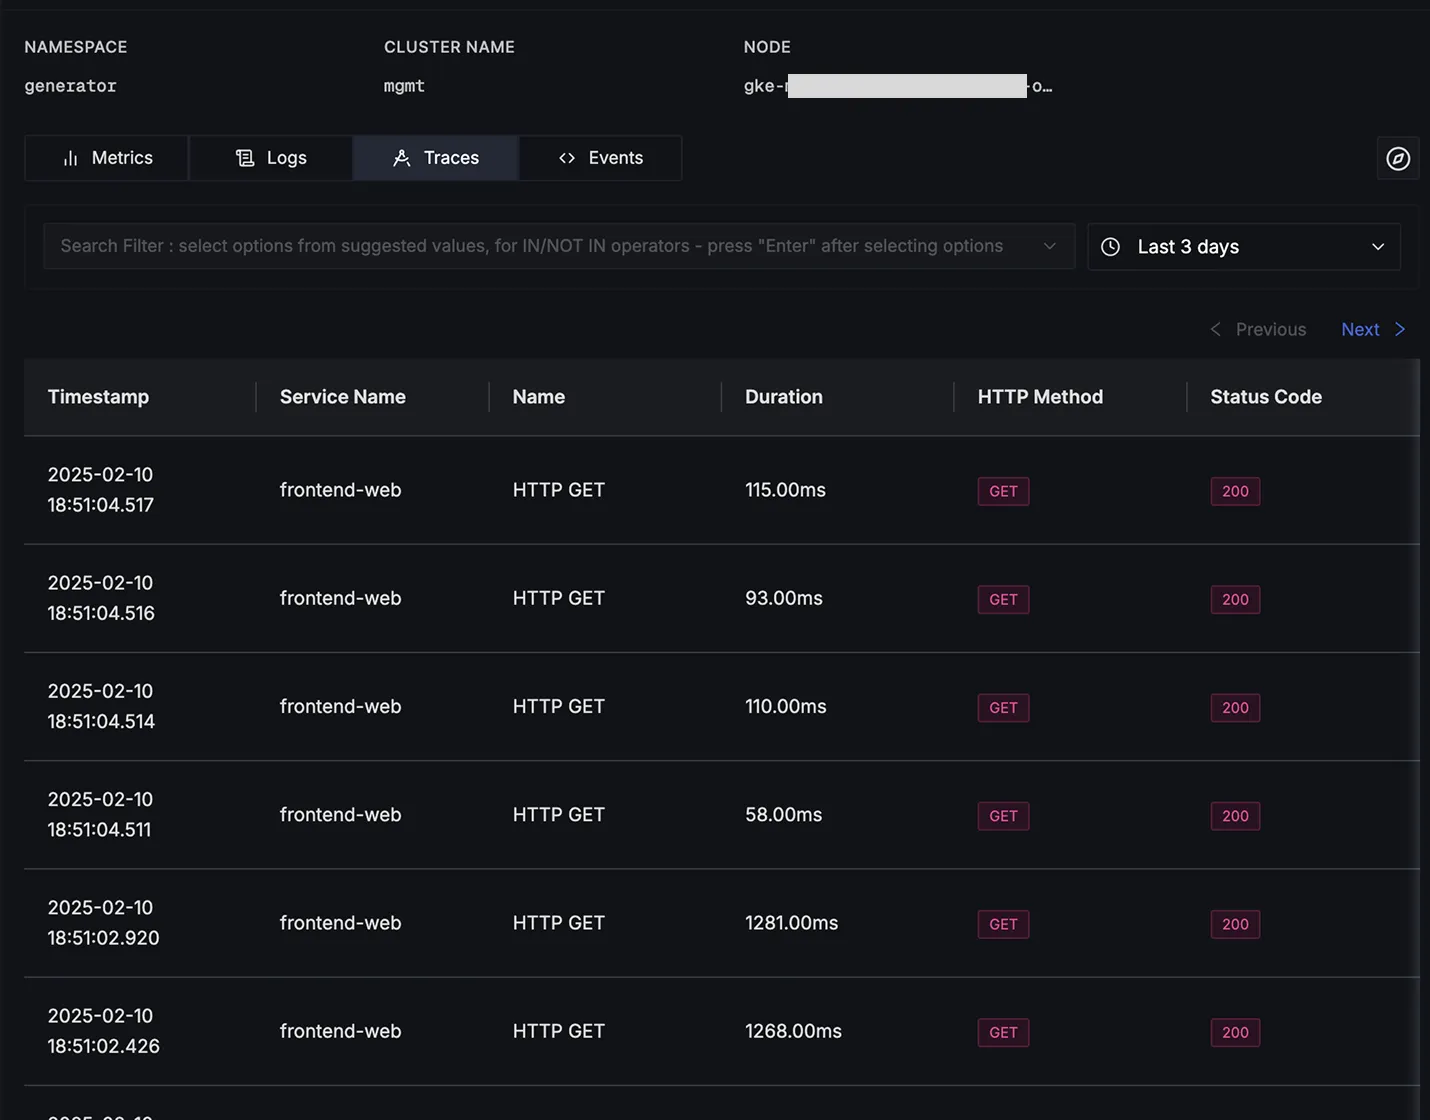
Features
- Adjustable time range selection for trace analysis
- Advanced filtering capabilities to focus on specific trace attributes
- Direct integration with the Traces Explorer feature for deeper analysis
- The "Explore in Traces Explorer" button opens the trace in the full interface, retaining time ranges and filters
Filter Options
Users can apply various filters to refine trace analysis:
- Service name: Focus on traces from specific services
- Operation type: Filter by specific operations or endpoints (e.g., GET, POST)
- Status/Error codes: Identify traces with specific success or error statuses
- Custom attributes: Refine traces using user-defined tags or metadata
Logs Tab: Pod Performance Monitoring
The Logs tab provides real-time logs from selected Kubernetes pods, helping to debug issues and monitor system events.
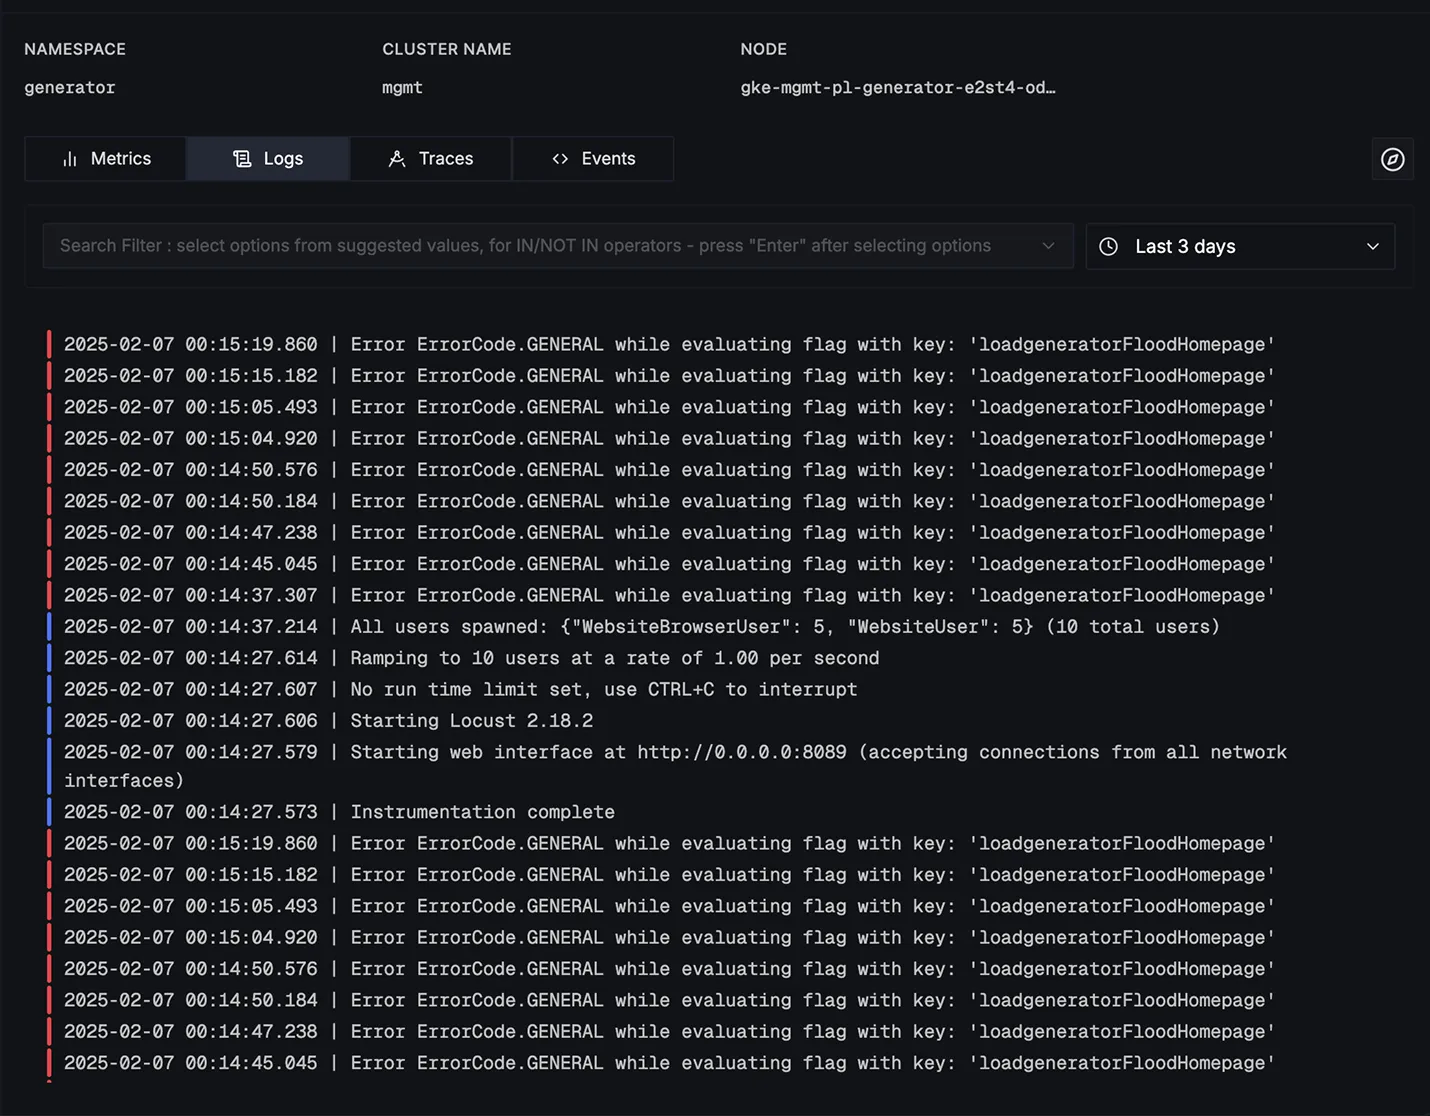
Features:
- Configurable time range selection for log analysis.
- Comprehensive filtering system.
- Seamless integration with the Logs Explorer feature.
- The "Explore in Logs Explorer" button opens the full logs interface, keeping time ranges and filters.
- Highlighted warning and error messages.
Consistent Monitoring Across Views
Each Kubernetes View—Pods, Nodes, Namespaces, Clusters, Deployments, and more includes Metrics, Logs, Traces and Events tabs for performance monitoring and debugging.
Next steps
To get the most value from Infrastructure Monitoring:
- Send host metrics to SigNoz to populate the Hosts view.
- Configure Kubernetes metrics collection to power the Kubernetes views.
