SigNoz APM uses OpenTelemetry to instrument your applications, providing service dependency maps, latency and error-rate dashboards, and full trace-level visibility to pinpoint performance bottlenecks.
Quick Start
Get started with SigNoz Cloud's guided onboarding, no local install. You'll instrument your app and see your first traces in minutes.
Step 1: Instrument Your Application
Select your language or framework to add OpenTelemetry instrumentation and start sending traces to SigNoz:
Step 2: Explore Your Data in SigNoz
Once traces are flowing, use SigNoz to monitor and debug your applications:
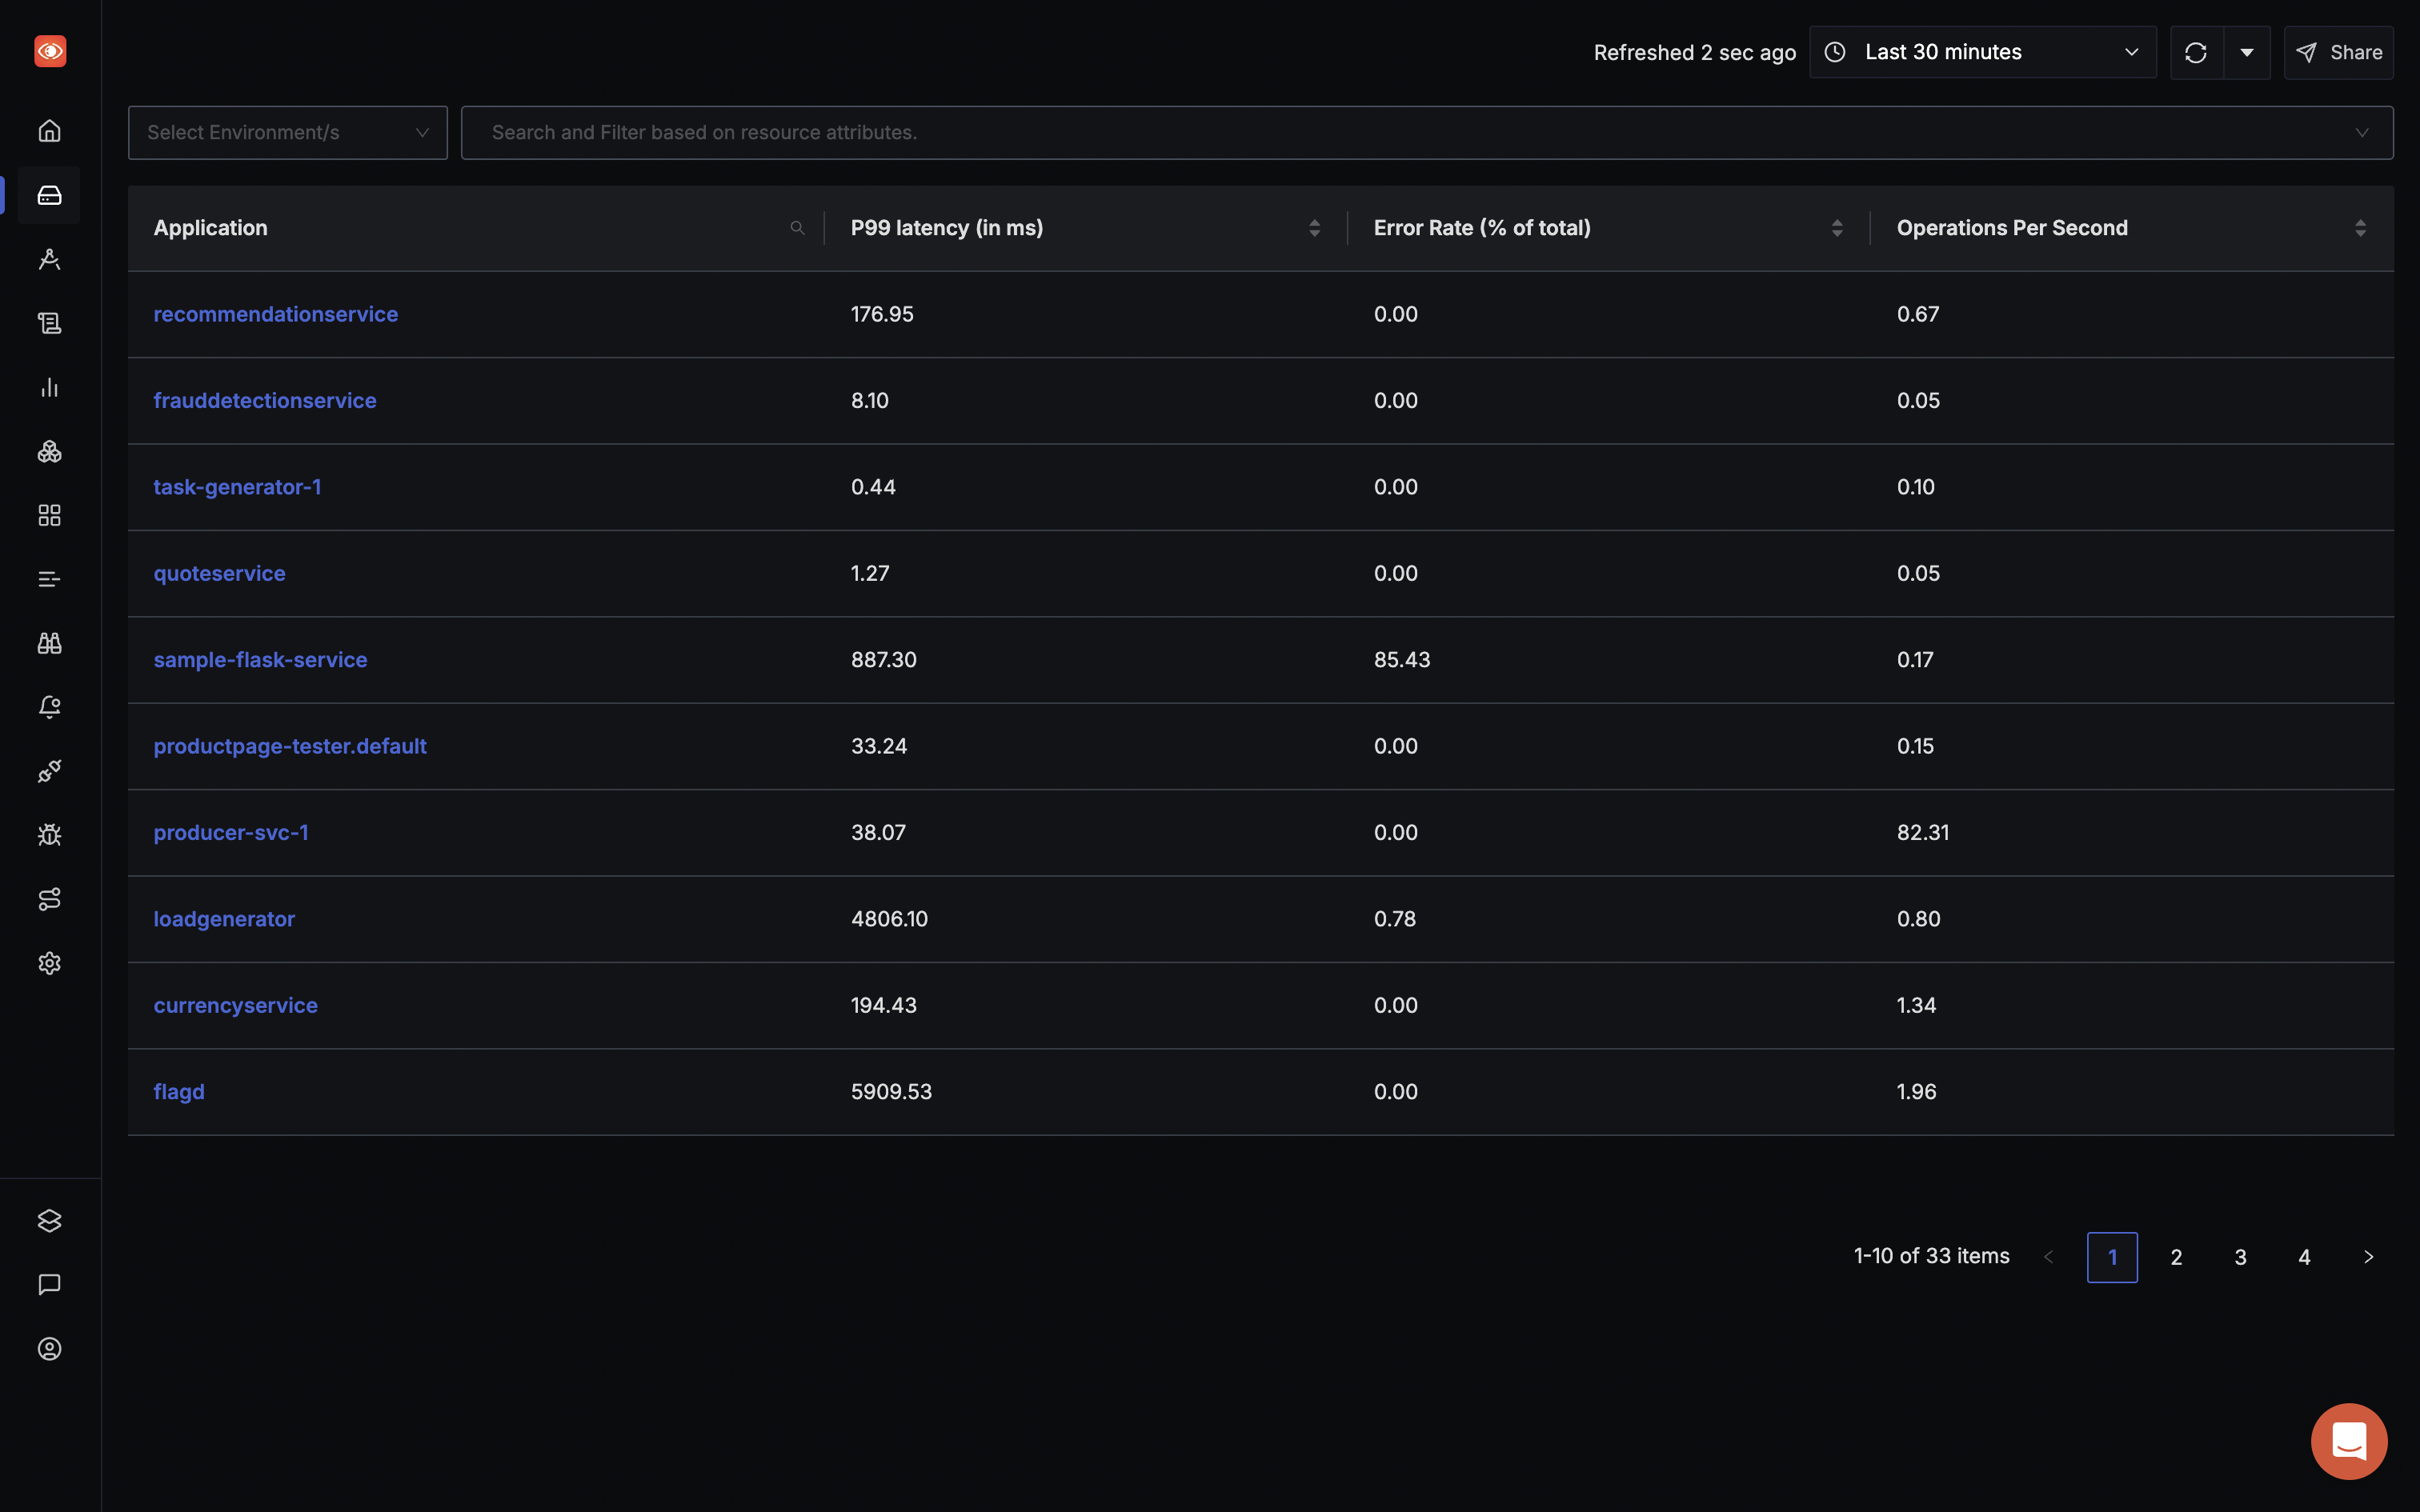
Services View
See all instrumented services with real-time throughput, latency, and error rate metrics. The service dependency map shows how services interact. Learn more →
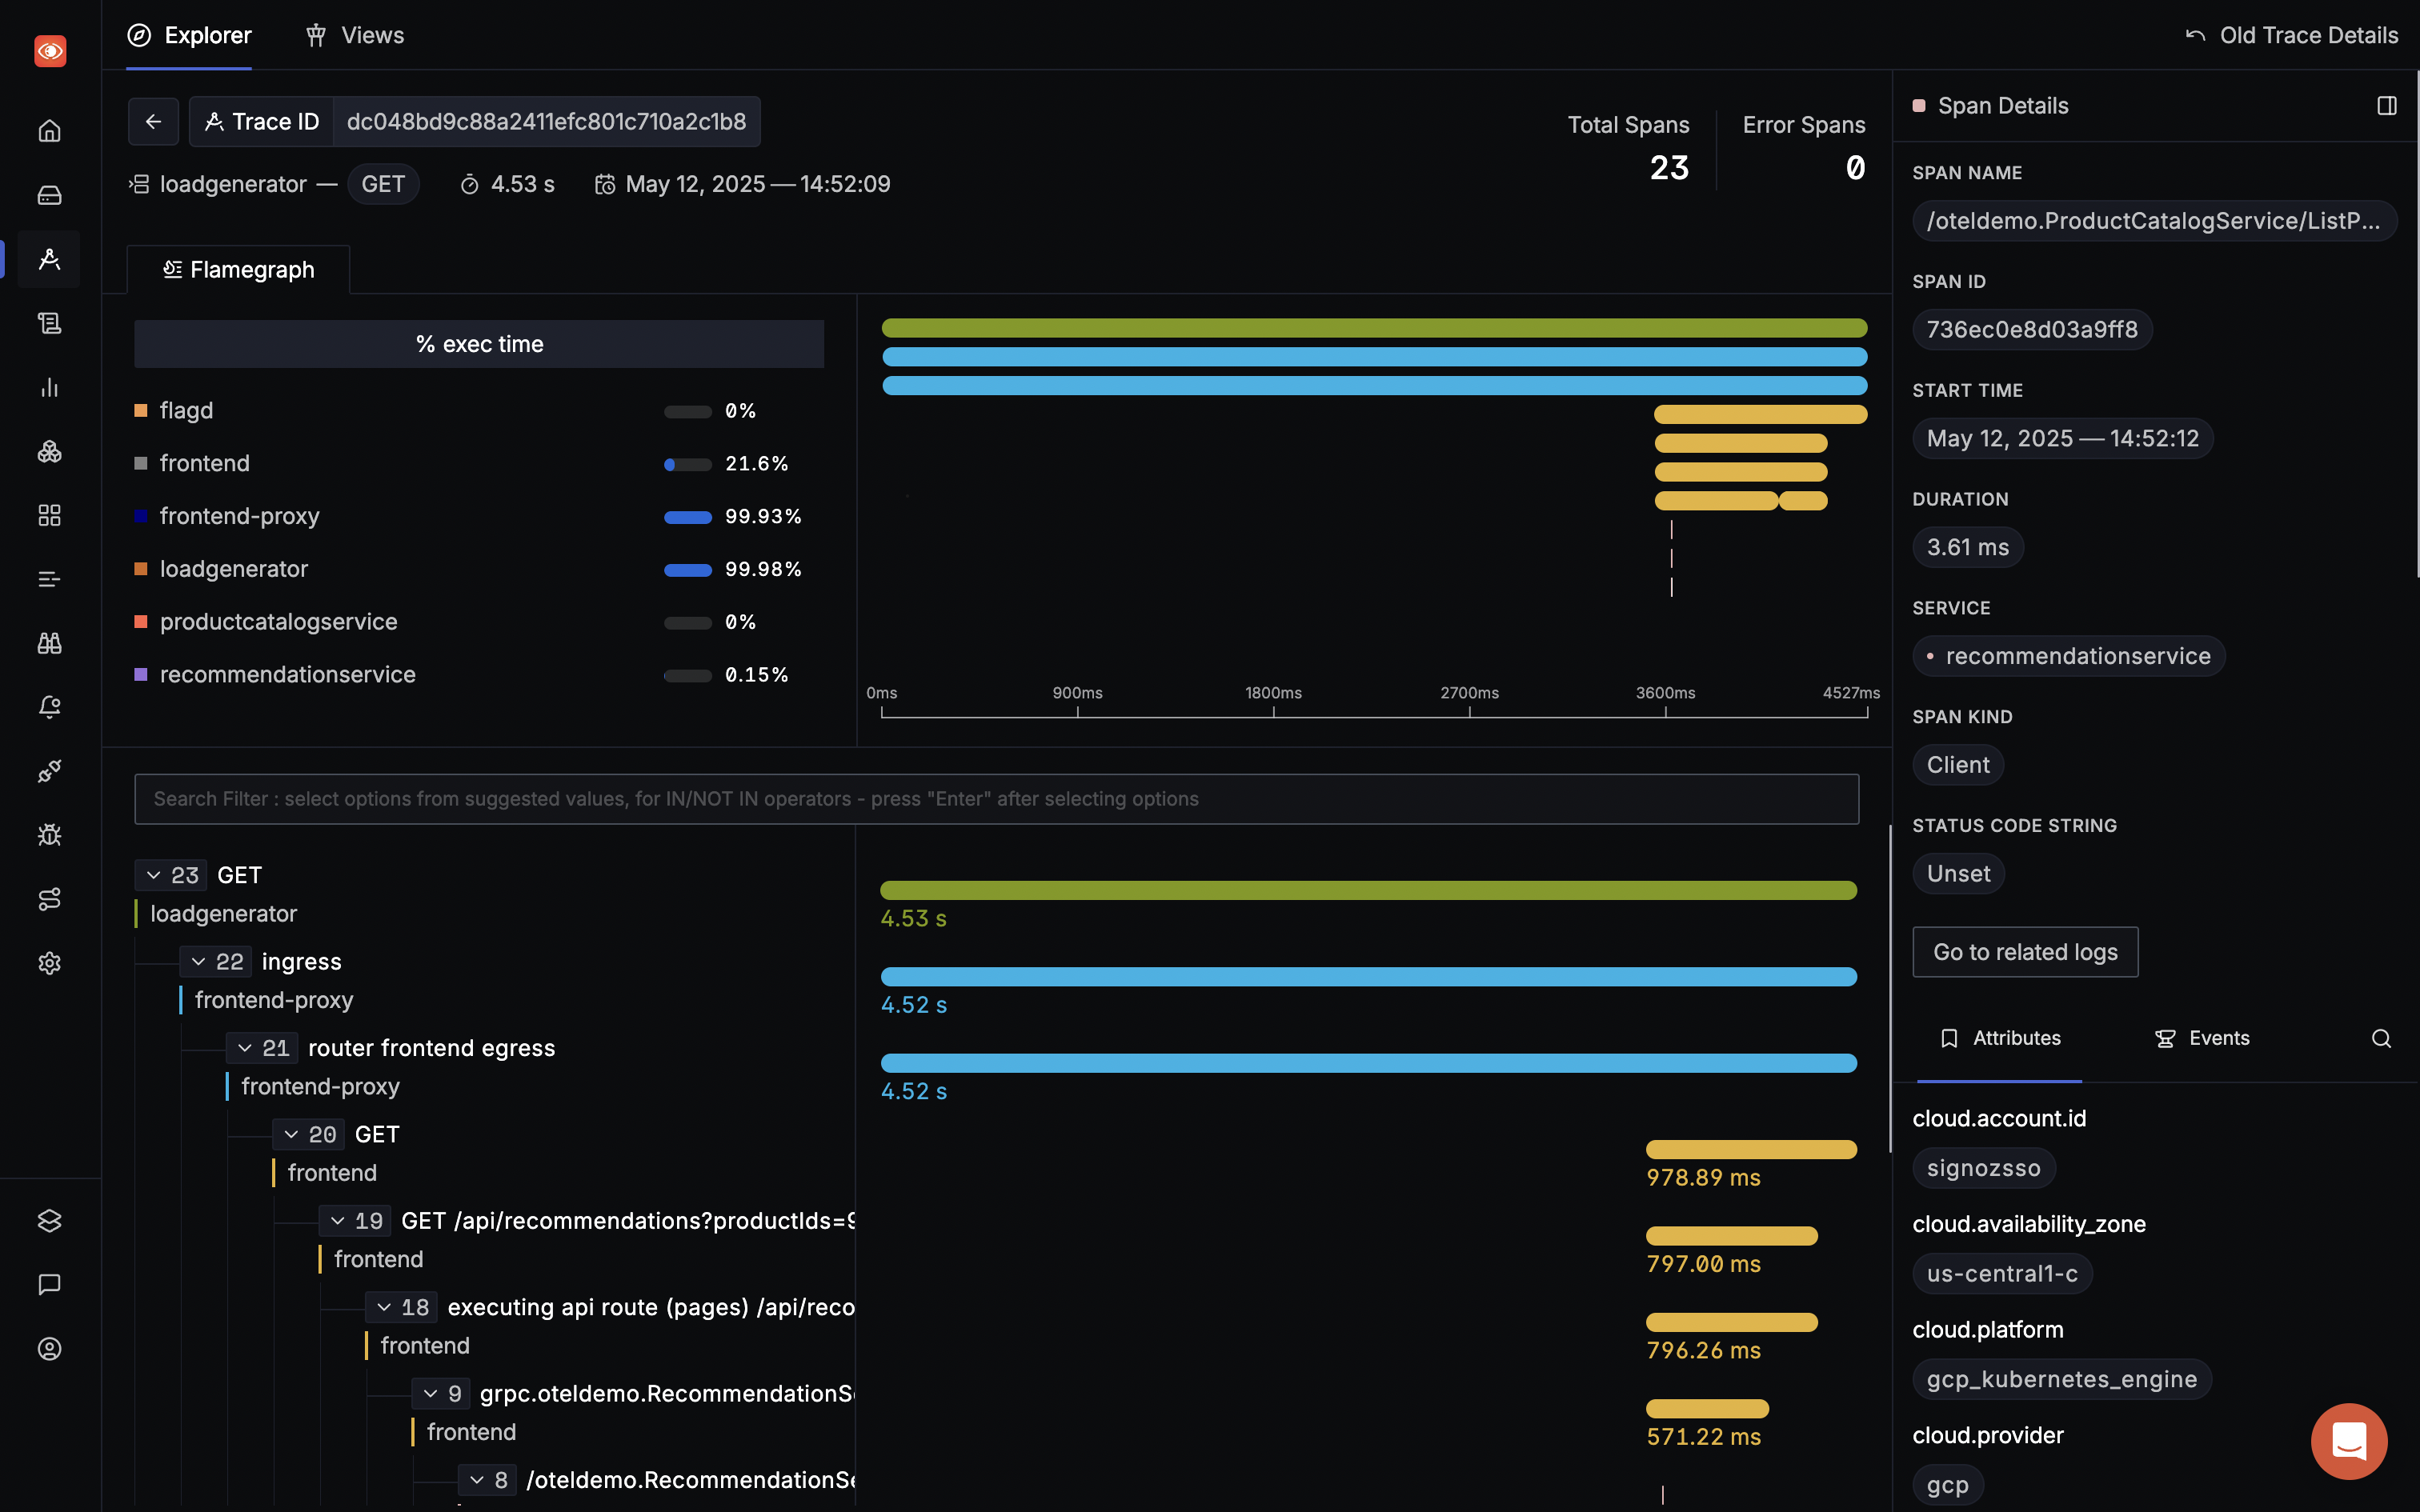
Traces Explorer
Filter and search traces by service, operation, status, duration, or any span attribute. Drill into individual traces to see flamegraphs and Gantt charts. Learn more →
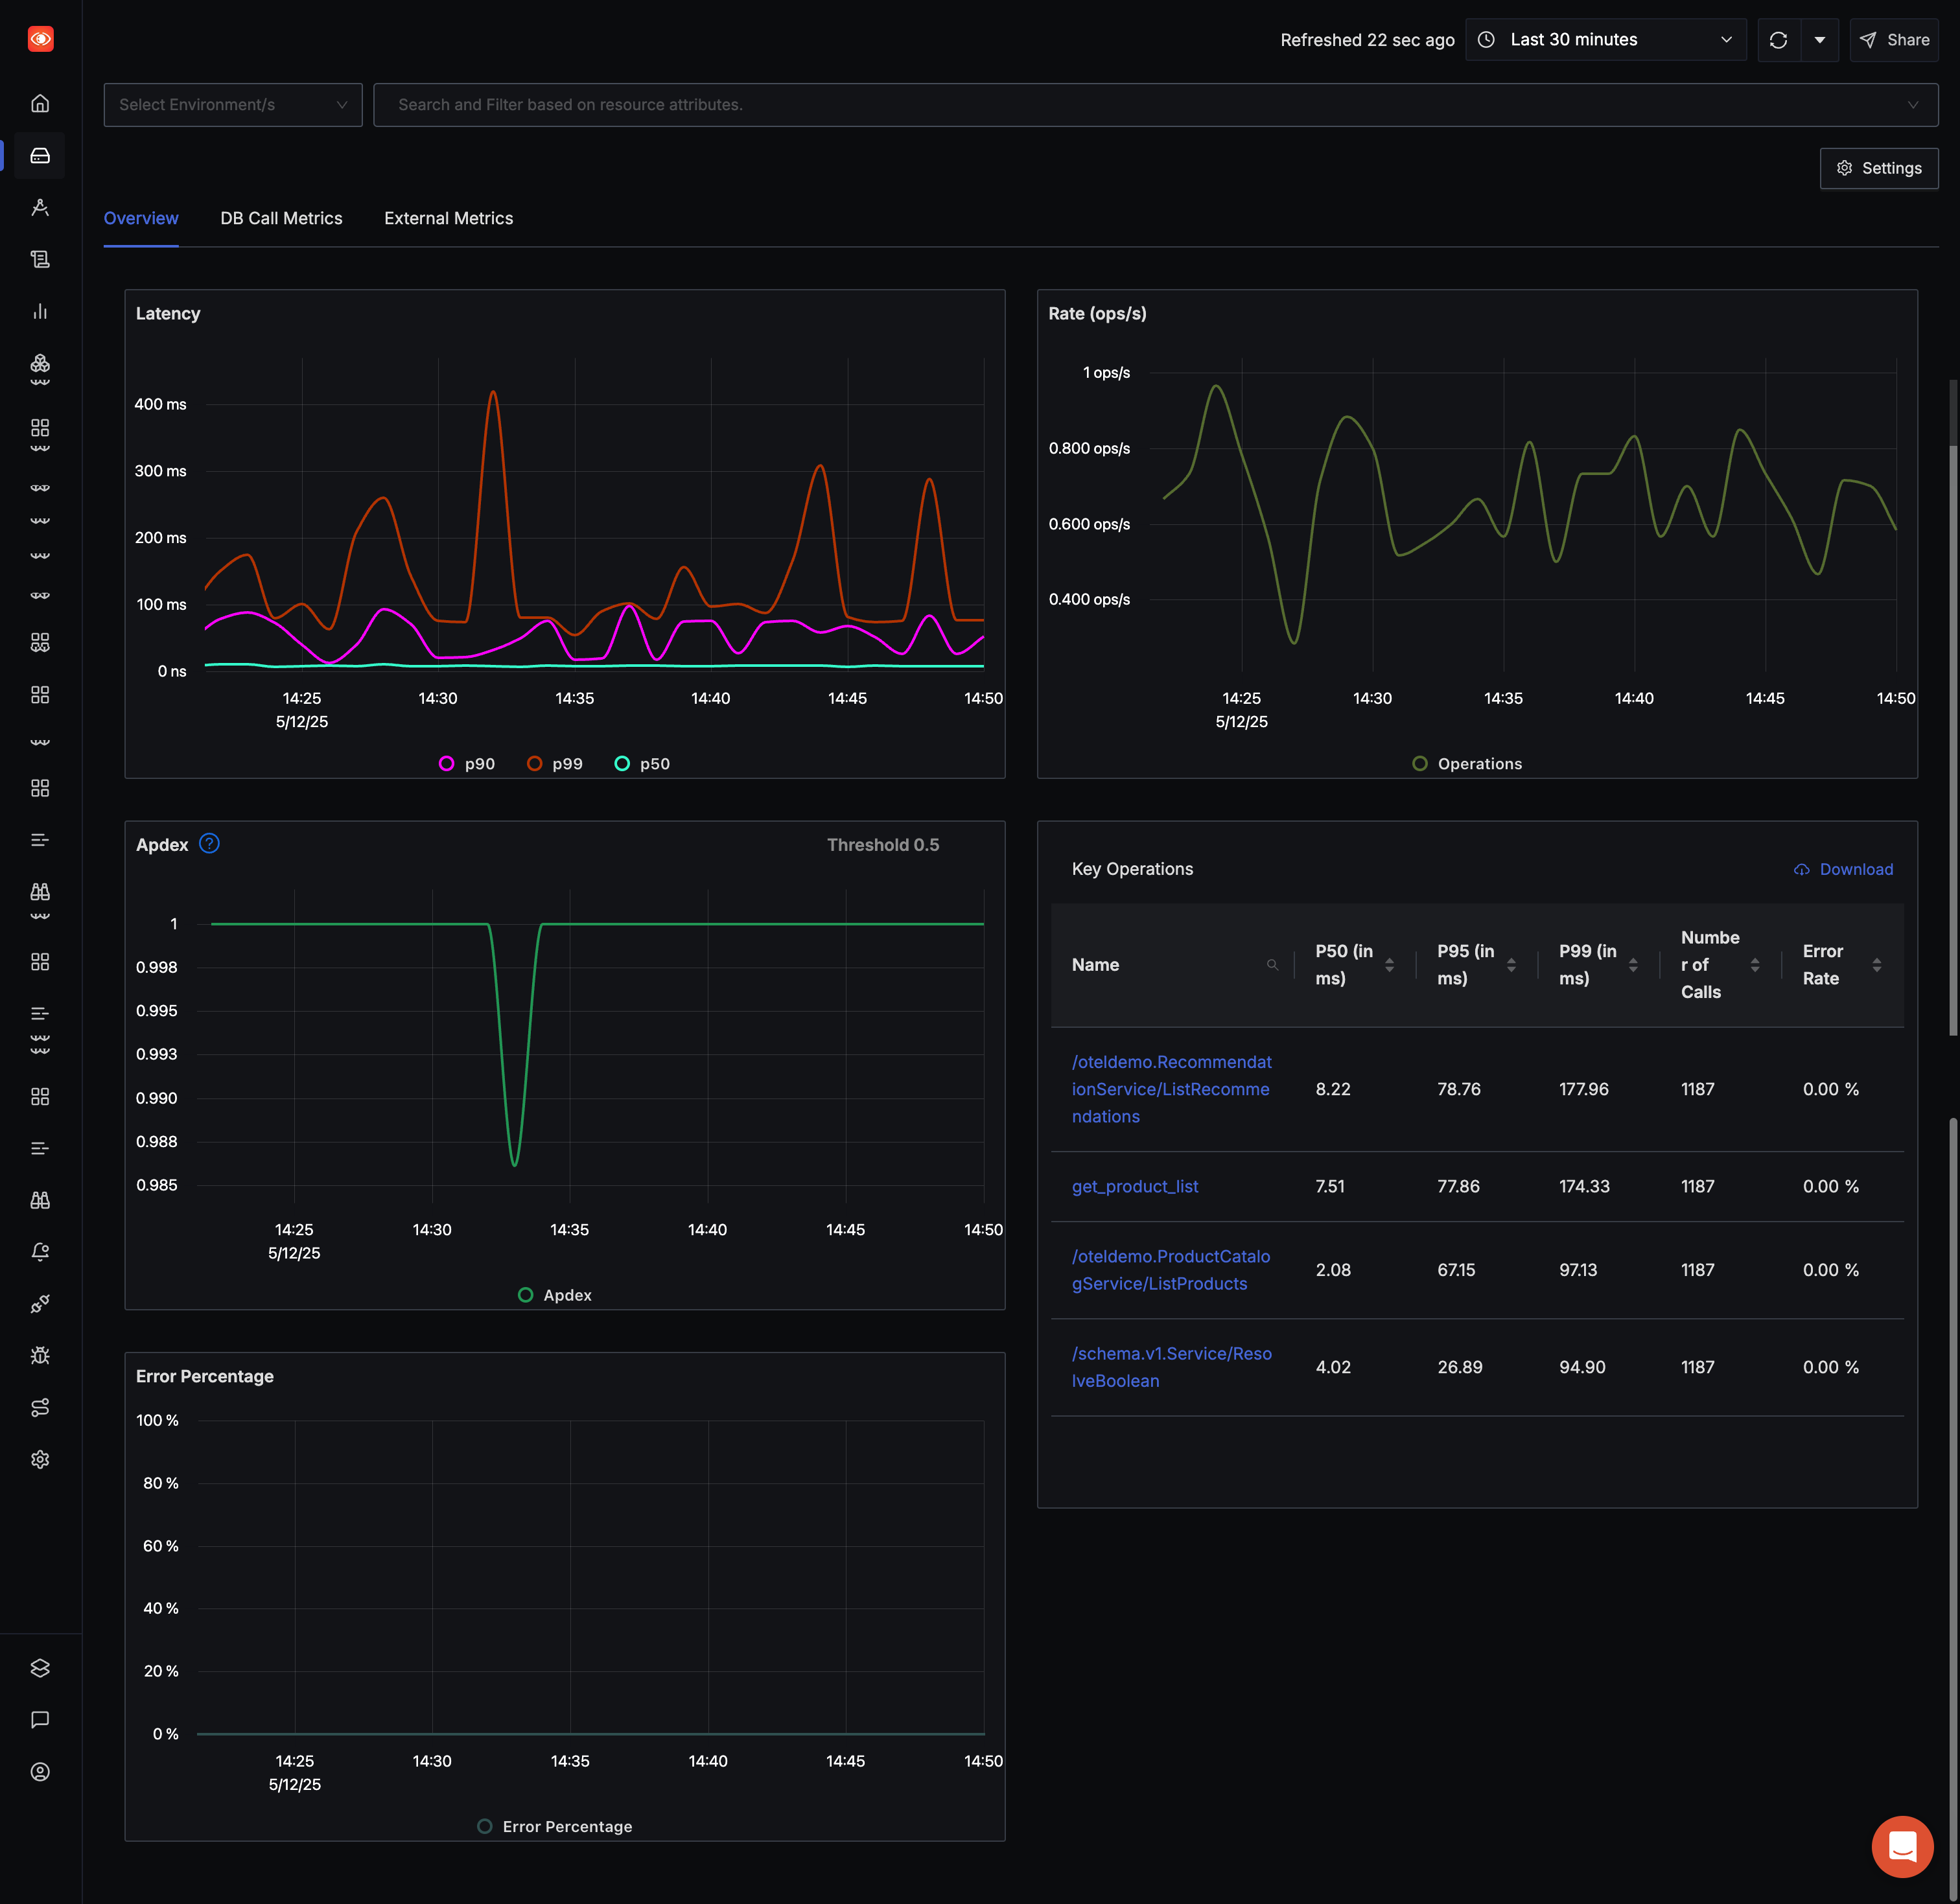
APM Dashboards
Pre-built dashboards show p99 latency, error rates, Apdex scores, and throughput based on Traces.
Next Steps
Learn how to get the most out of SigNoz with guides on API monitoring, APM metrics, trace volume control, PII scrubbing, and more.
Use trace API to fetch traces from SigNoz
Inspect spans with flamegraphs and Gantt charts
Use auto-generated APM metrics for dashboards and alerts
