Overview
This integration helps you to monitor key Snowflake metrics, and view them with an out-of-the-box dashboard.
Prerequisites
Before you begin, ensure you have:
- A Snowflake account
- An OpenTelemetry (OTEL) Collector with access to Snowflake
- Install the OTEL Collector(v0.88.0 or newer) if not done already
- Ensure you can provide config files and set environment variables for the collector
Setup
Step 1: Create the Collector Config File
Create a file named snowflake-metrics-collection-config.yaml with the following content:
snowflake-metrics-collection-config.yaml
receivers:
  snowflake:
    account: ${env:SNOWFLAKE_ACCOUNT}
    username: ${env:SNOWFLAKE_USERNAME}
    password: ${env:SNOWFLAKE_PASSWORD}
    warehouse: ${env:SNOWFLAKE_WAREHOUSE}
    collection_interval: 5m
    metrics:
      snowflake.database.bytes_scanned.avg:
        enabled: true
      snowflake.query.bytes_deleted.avg:
        enabled: true

processors:
  # enriches the data with additional host information
  # see https://github.com/open-telemetry/opentelemetry-collector-contrib/tree/main/processor/resourcedetectionprocessor#resource-detection-processor
  resourcedetection/system:
    # add additional detectors if needed
    detectors: ["system"]

exporters:
  # export to SigNoz cloud
  otlp/snowflake:
    endpoint: "${env:OTLP_DESTINATION_ENDPOINT}"
    tls:
      insecure: false
    headers:
      "signoz-ingestion-key": "${env:SIGNOZ_INGESTION_KEY}"

  # export to local collector
  # otlp/snowflake:
  #   endpoint: "localhost:4317"
  #   tls:
  #     insecure: true

service:
  pipelines:
    metrics/snowflake:
      receivers: [snowflake]
      processors: [resourcedetection/system]
      exporters: [otlp/snowflake]
All the available Snowflake receiver configurations can be found here.
Step 2: Set Environment Variables
Set the following environment variables:
# Snowflake account from where the metrics need to be collected
export SNOWFLAKE_ACCOUNT="<organization>-<account-name>"

# Snowflake username used while logging in into the Snowflake account
export SNOWFLAKE_USERNAME="<snowflake-username>"

# Password for the corresponding Snowflake user used while logging in into the Snowflake account
export SNOWFLAKE_PASSWORD="<snowflake-password>"

# Snowflake warehouse
export SNOWFLAKE_WAREHOUSE="<snowflake-warehouse>"

# region specific SigNoz cloud ingestion endpoint
export OTLP_DESTINATION_ENDPOINT="ingest.<region>.signoz.cloud:443"

# your SigNoz ingestion key
export SIGNOZ_INGESTION_KEY="<your-ingestion-key>"
<region>: Your SigNoz Cloud region<your-ingestion-key>: Your SigNoz ingestion key
Step 3: Use the Collector Config File
Add the following flag to your collector run command:
--config snowflake-metrics-collection-config.yaml
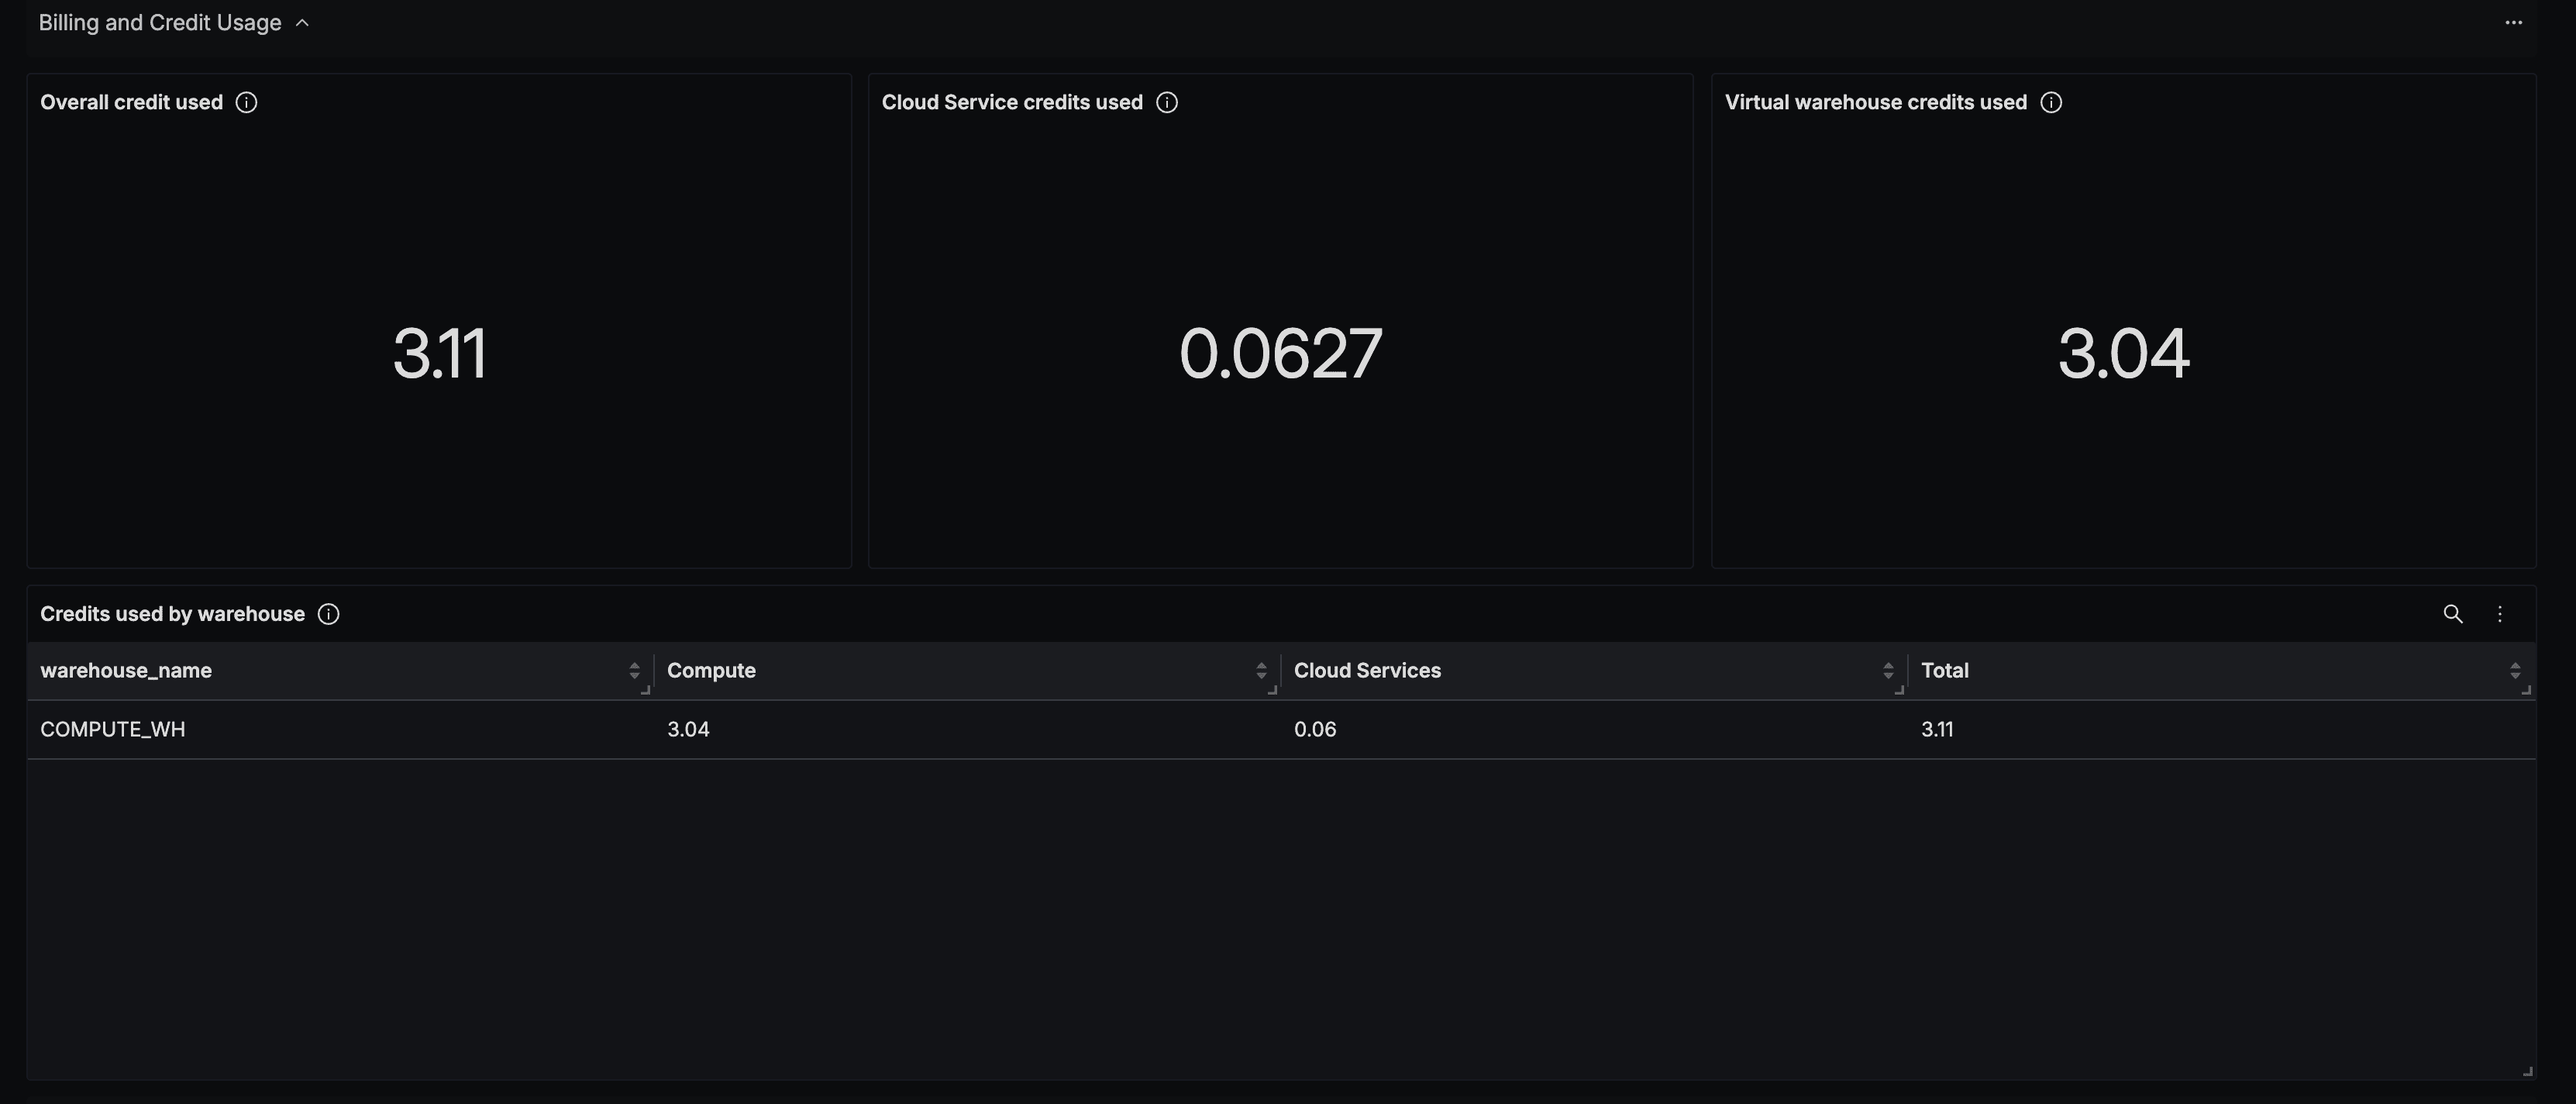
Snowflake Dashboard
You can import the Snowflake dashboard.
Go to Dashboards => New Dashboard => Import JSON
Download JSON from link.
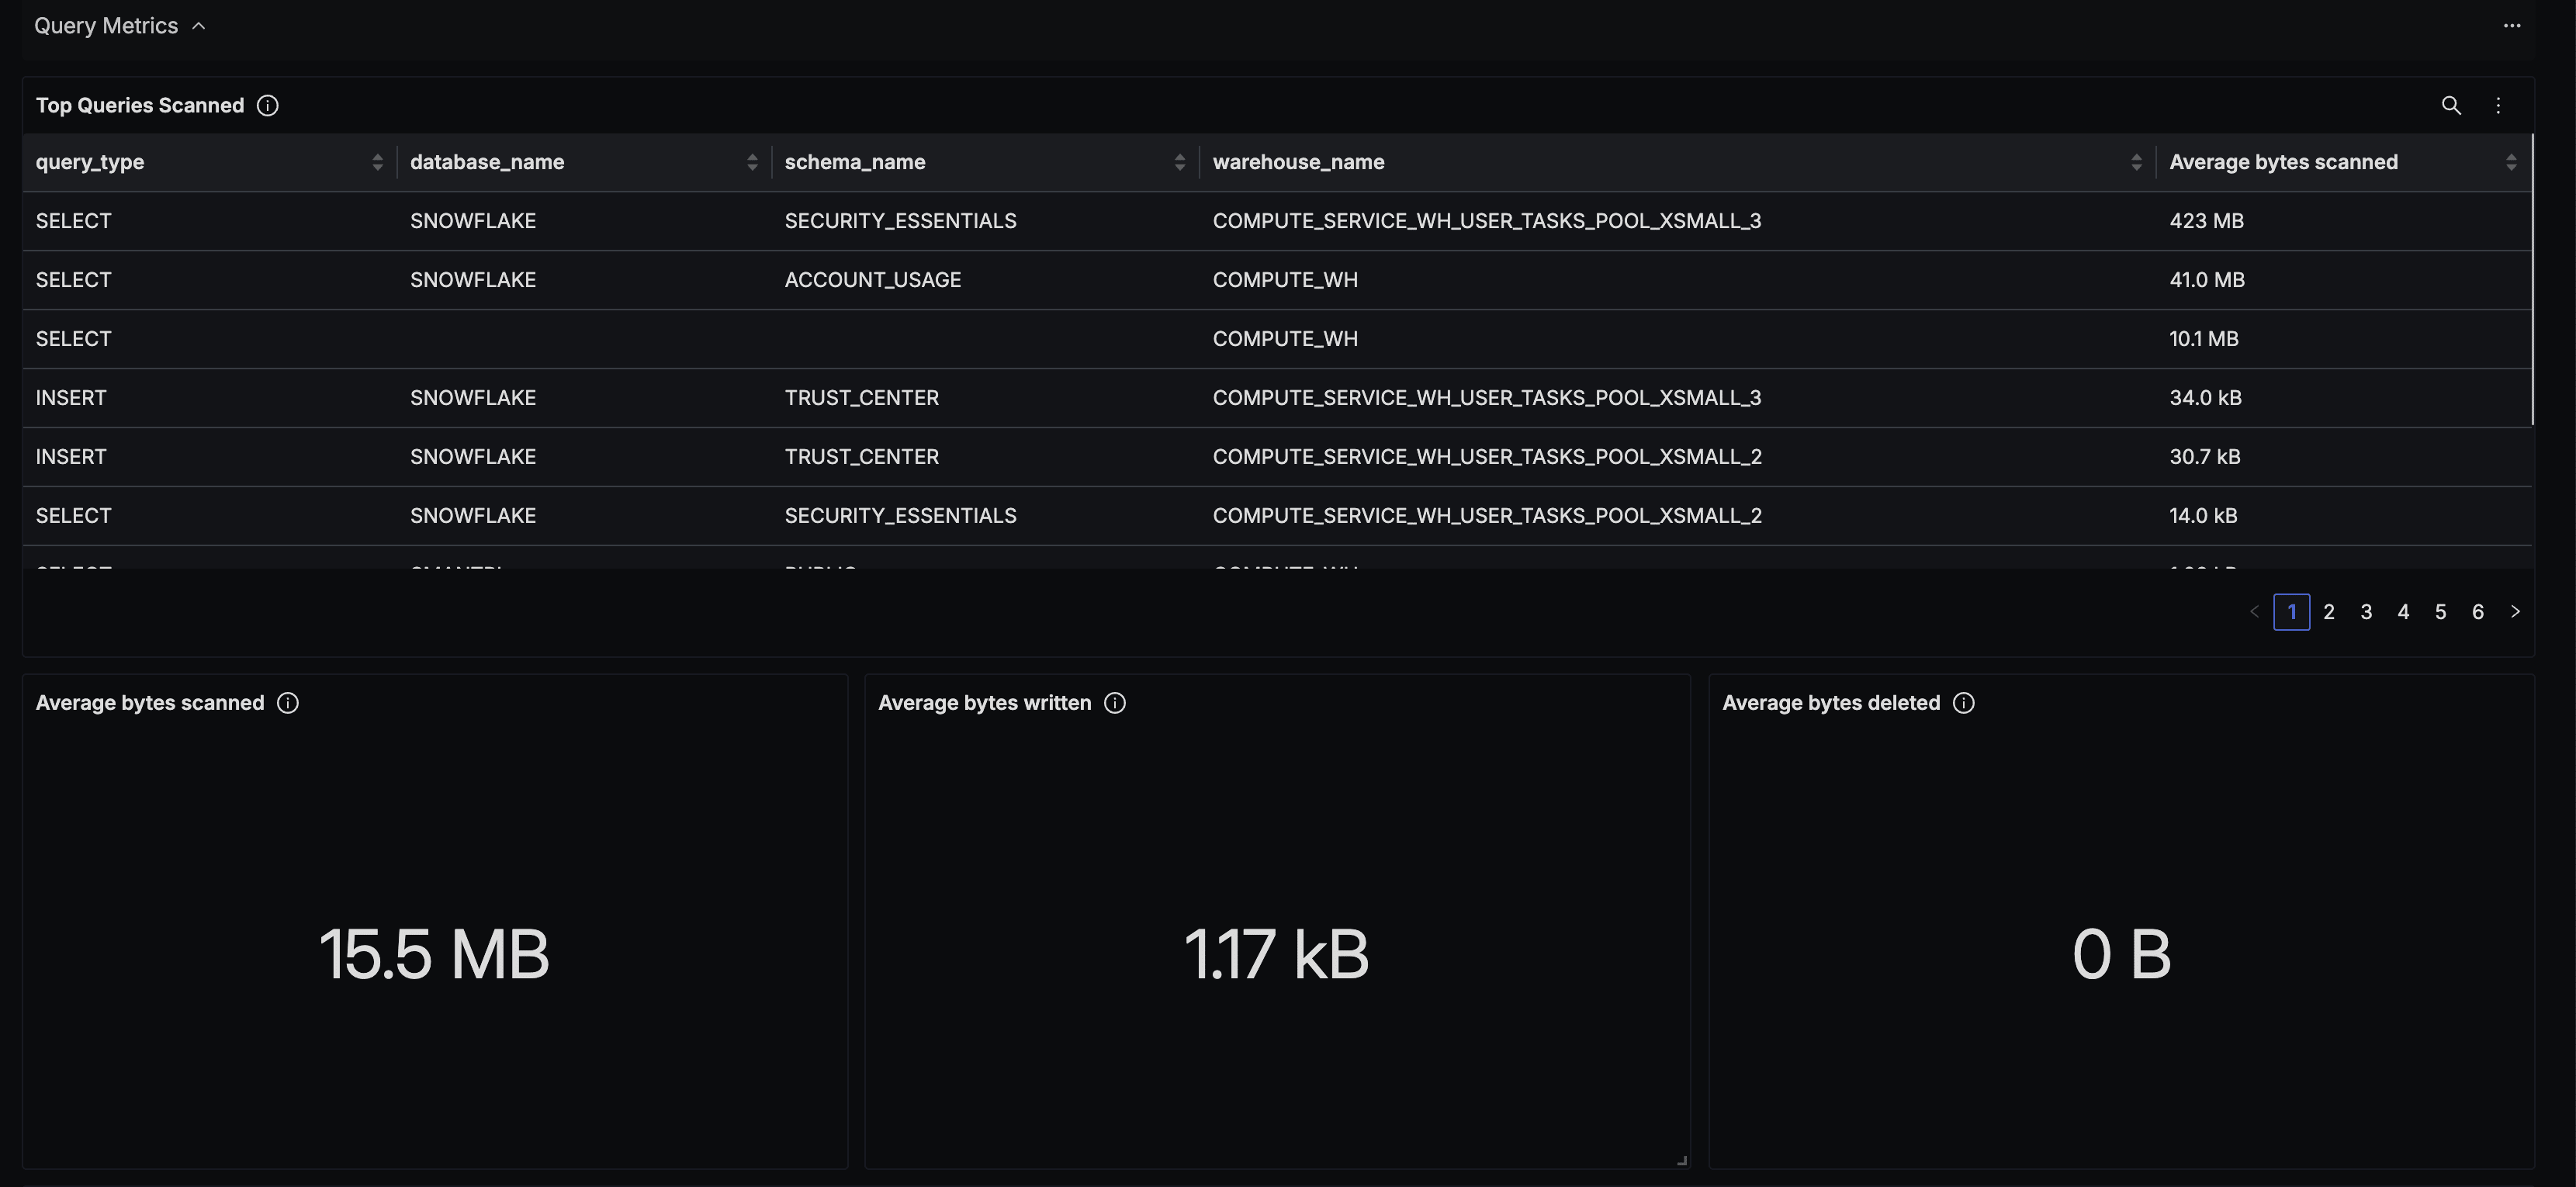
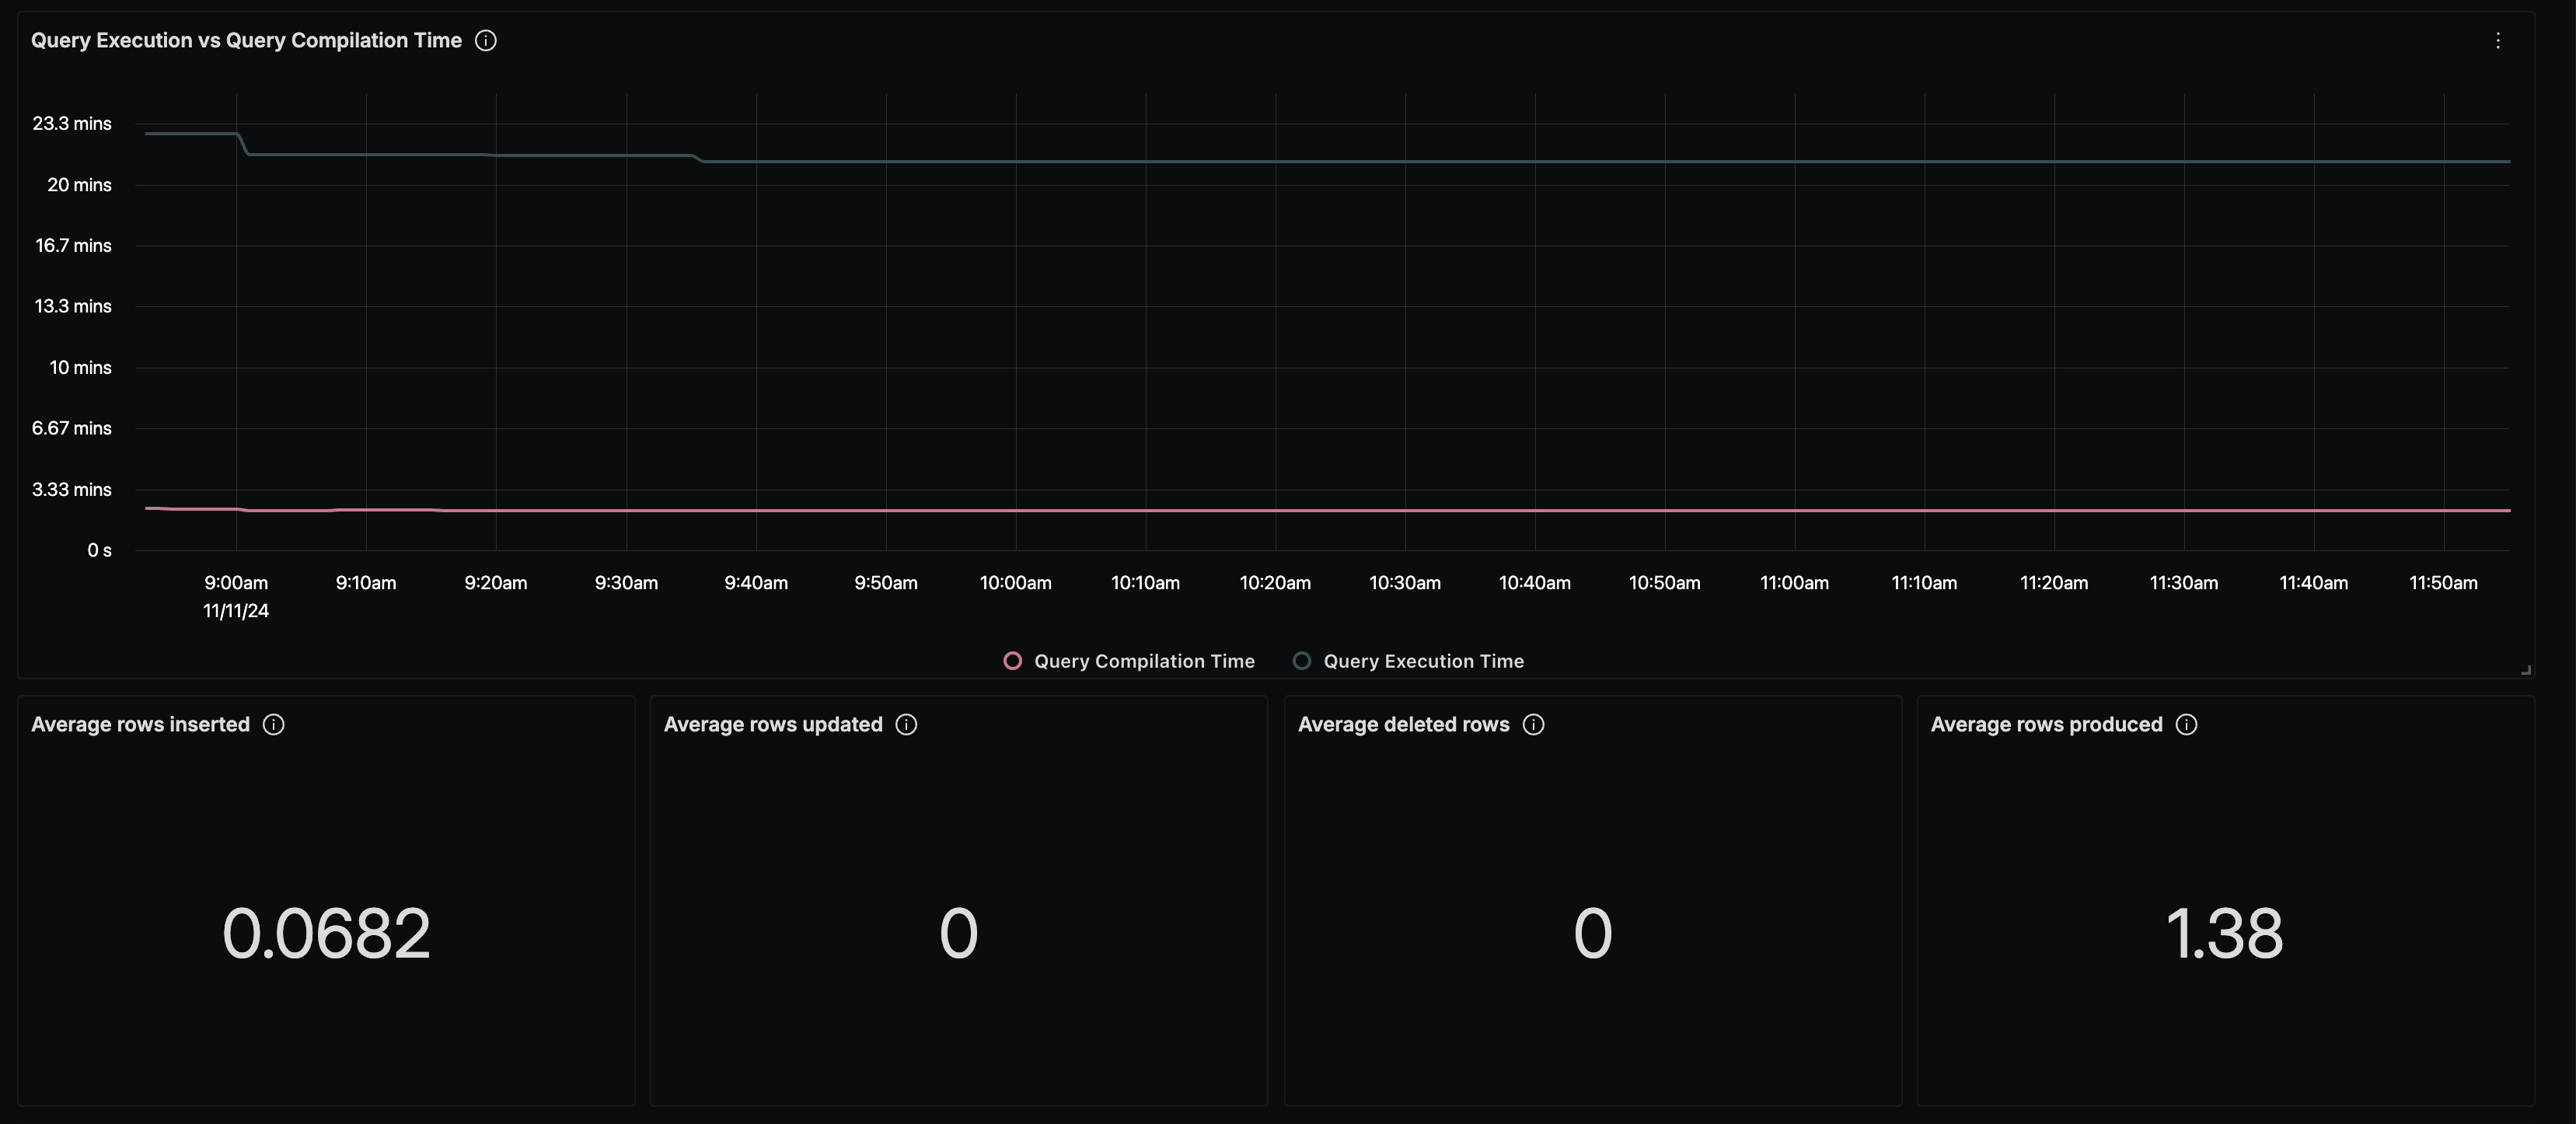
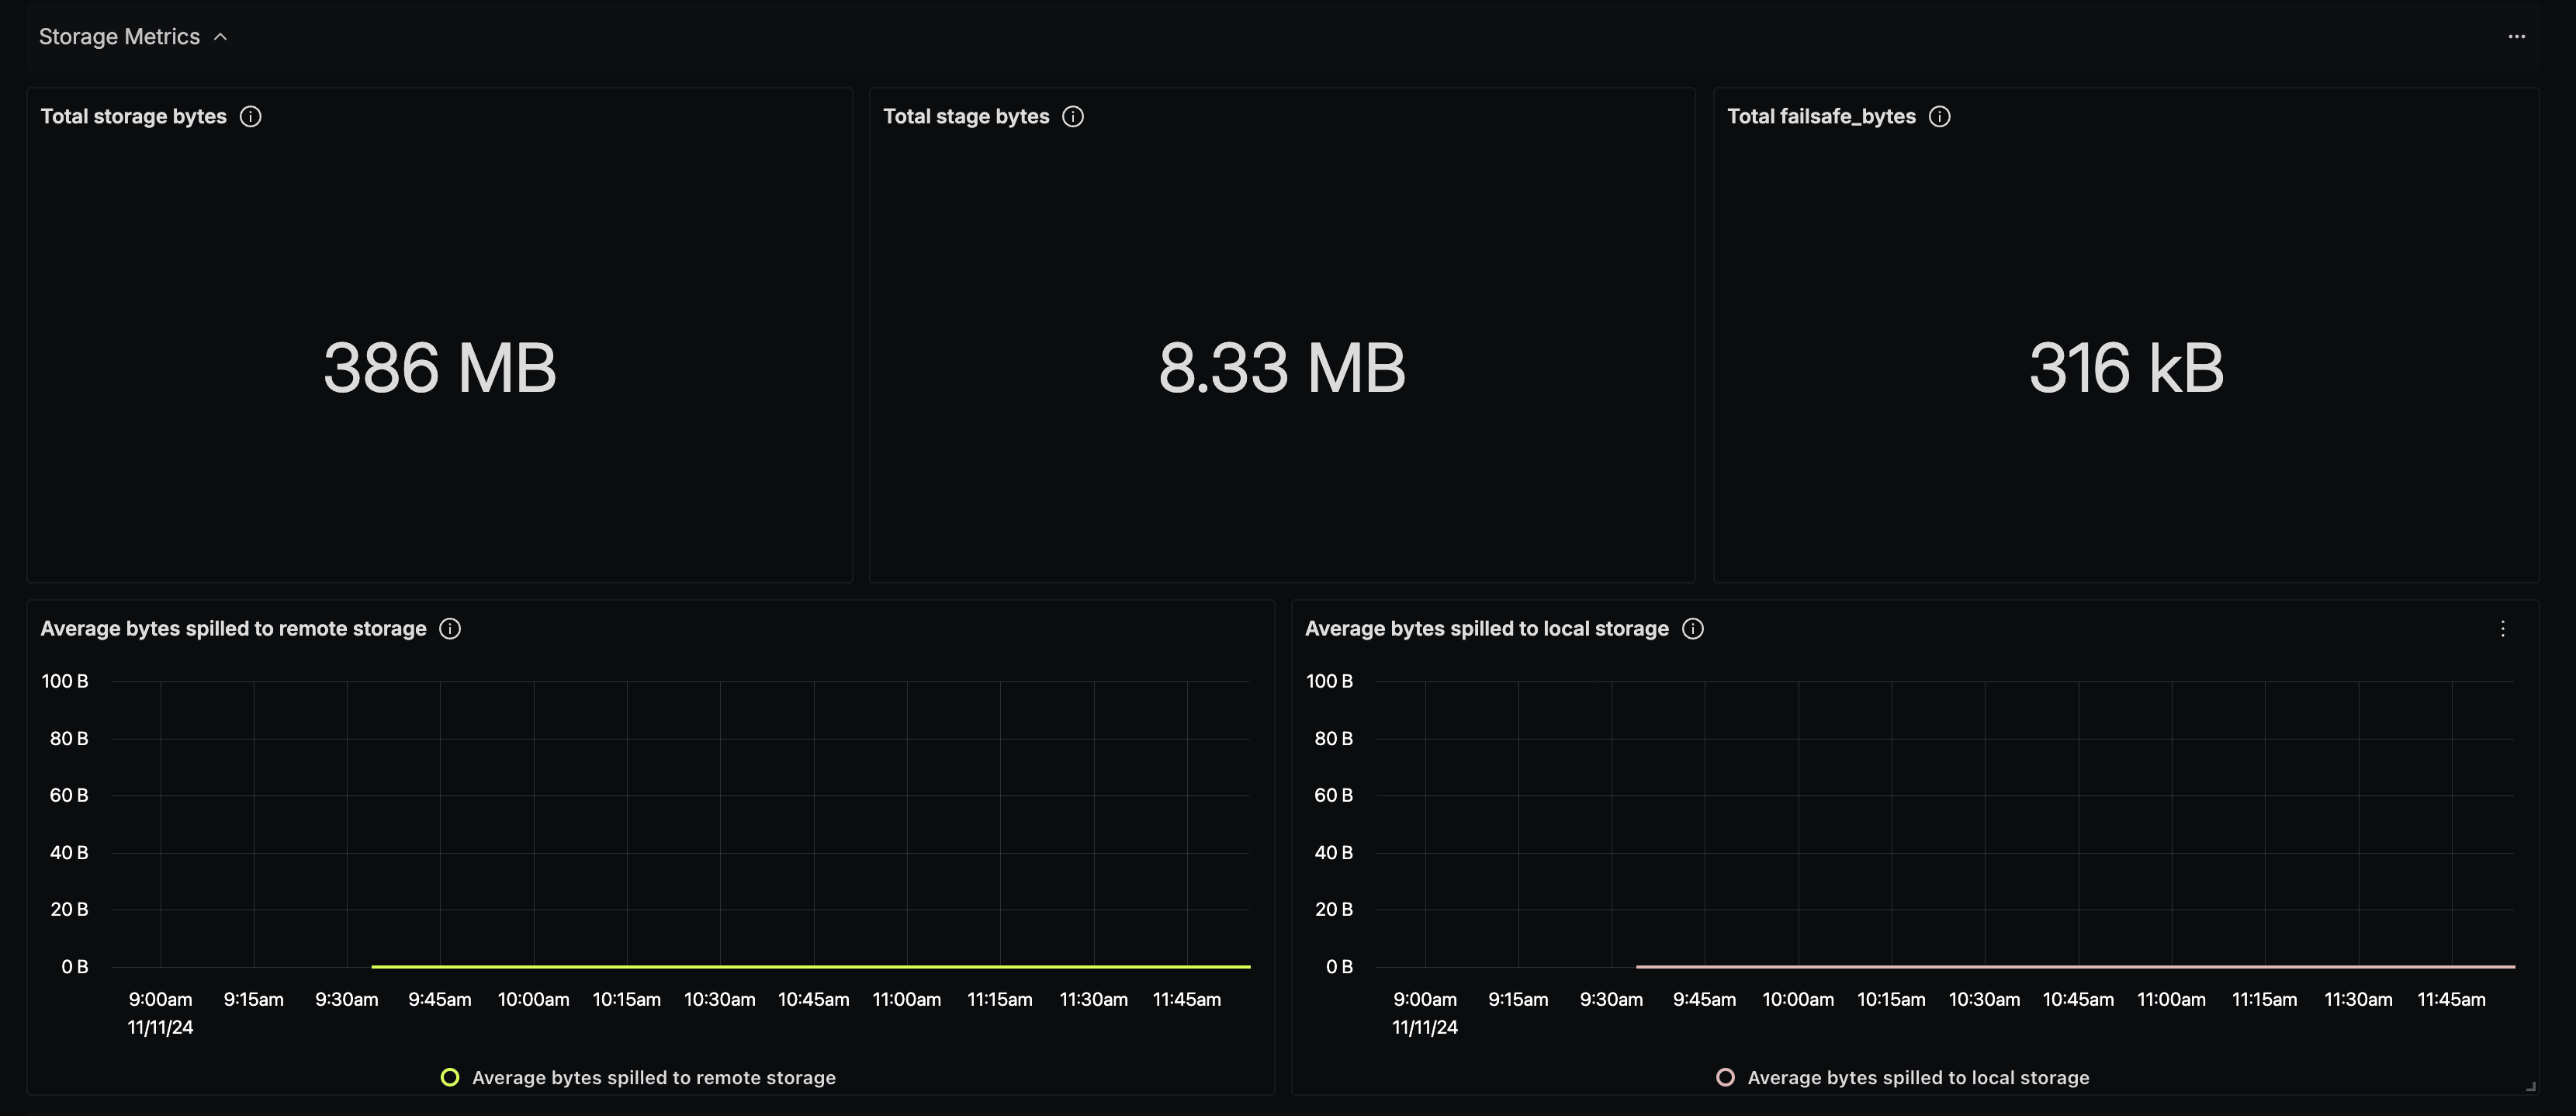
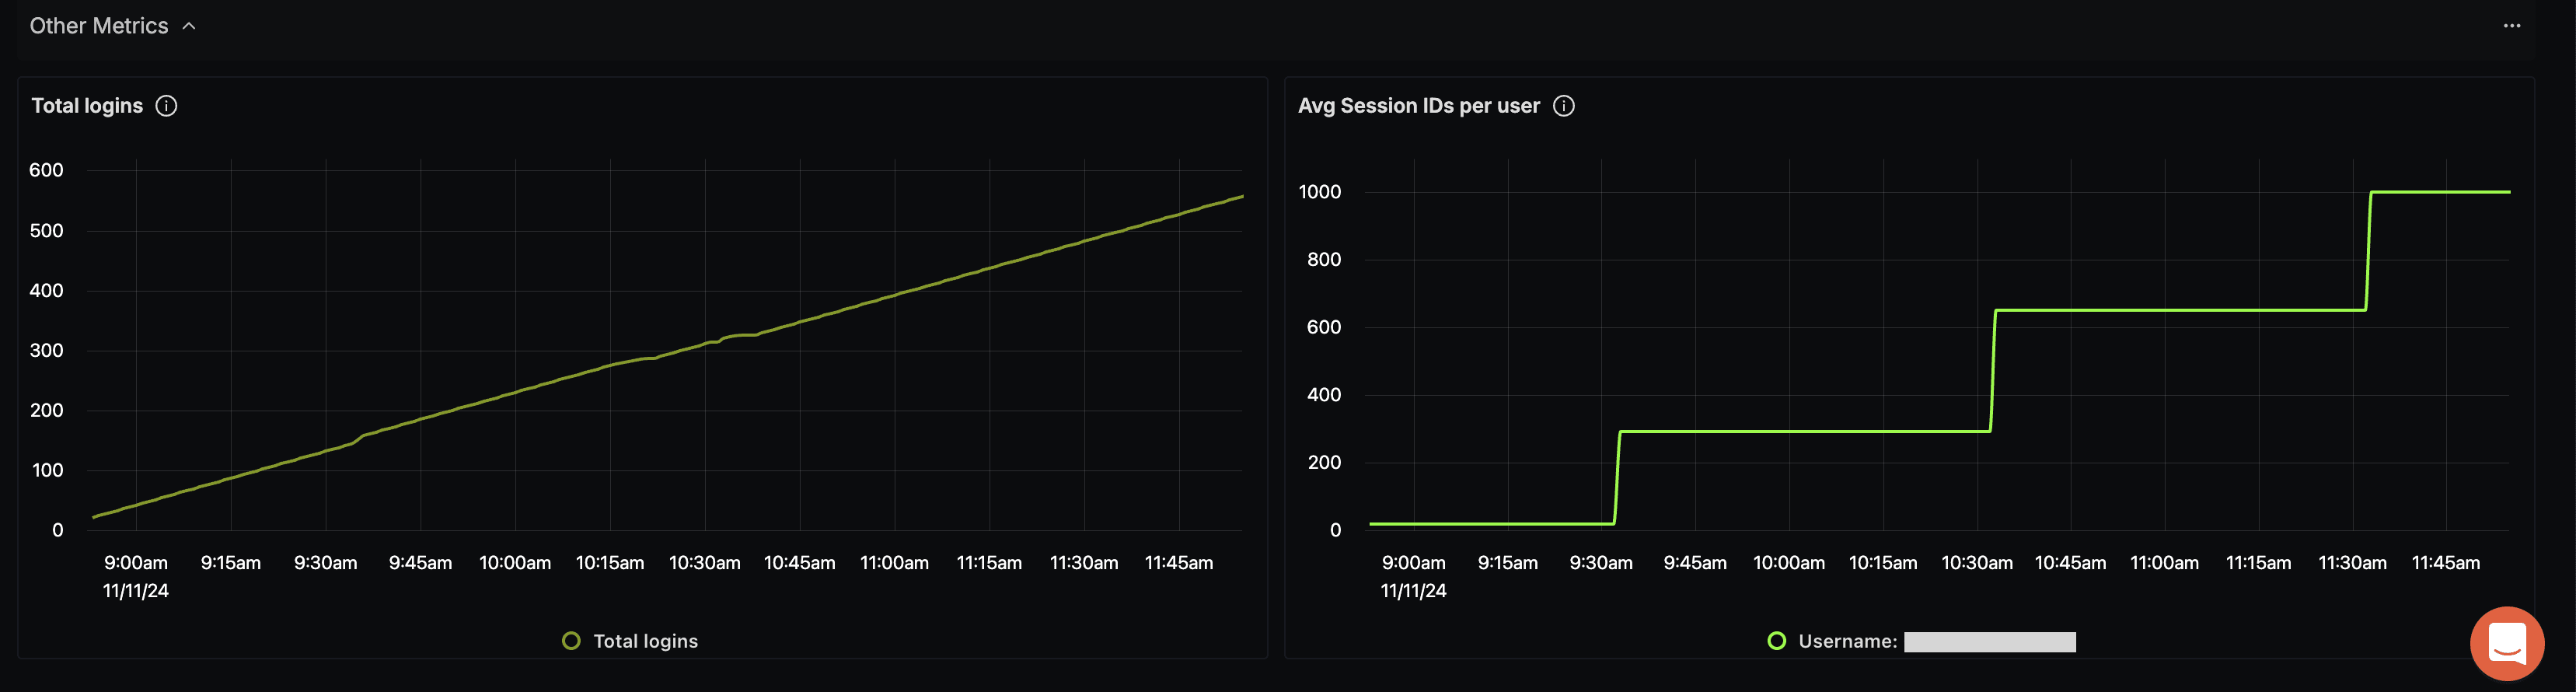
Here are sample screenshots from the dashboard:
Complete list of Snowflake metrics
- Name: The name of the metric.
- Type: The type of the metric (e.g., Sum, Gauge).
- Unit: The unit of measurement for the metric.
- Description: A brief description of what the metric represents.
| Name | Type | Unit | Description |
|---|---|---|---|
| snowflake_database_bytes_scanned_avg | Gauge | Bytes | Average bytes scanned in a database over the last 24 hour window |
| snowflake_database_query_count | Gauge | number | Total query count for database over the last 24 hour window |
| snowflake_query_blocked | Gauge | double | Blocked query count for warehouse over the last 24 hour window |
| snowflake_query_bytes_deleted_avg | Gauge | Bytes | Average bytes deleted in database over the last 24 hour window |
| snowflake_query_bytes_written_avg | Gauge | Bytes | Average bytes written by database over the last 24 hour window |
| snowflake_query_compilation_time_avg | Gauge | seconds | Average time taken to compile query over the last 24 hour window |
| snowflake_query_executed | Gauge | double | Executed query count for warehouse over the last 24 hour window |
| snowflake_query_execution_time_avg | Gauge | seconds | Average time spent executing queries in database over the last 24 hour window |
| snowflake_query_queued_overload | Gauge | double | Overloaded query count for warehouse over the last 24 hour window |
| snowflake_query_queued_provision | Gauge | double | Number of compute resources queued for provisioning over the last 24 hour window |
| snowflake_queued_overload_time_avg | Gauge | seconds | Average time spent in warehouse queue due to warehouse being overloaded over the last 24 hour window |
| snowflake_queued_provisioning_time_avg | Gauge | seconds | Average time spent in warehouse queue waiting for resources to provision over the last 24 hour window |
| snowflake_queued_repair_time_avg | Gauge | seconds | Average time spent in warehouse queue waiting for compute resources to be repaired over the last 24 hour window |
| snowflake_storage_stage_bytes_total | Gauge | Bytes | Number of bytes of stage storage used by files in all internal stages (named, table, user) |
| snowflake_storage_storage_bytes_total | Gauge | Bytes | Number of bytes of table storage used, including bytes for data currently in Time Travel |
| snowflake_total_elapsed_time_avg | Gauge | seconds | Average elapsed time over the last 24 hour window |
| snowflake_billing_cloud_service_total | Guage | credits | Reported total credits used in the cloud service over the last 24 hour window |
| snowflake_billing_total_credit_total | Gauge | credits | Reported total credits used across account over the last 24 hour window |
| snowflake_billing_virtual_warehouse_total | Gauge | credits | Reported total credits used by virtual warehouse service over the last 24 hour window |
| snowflake_billing_warehouse_cloud_service_total | Gauge | credits | Credits used across cloud service for given warehouse over the last 24 hour window |
| snowflake_billing_warehouse_total_credit_total | Gauge | credits | Total credits used associated with given warehouse over the last 24 hour window |
| snowflake_billing_warehouse_virtual_warehouse_total | Gauge | credits | Total credits used by virtual warehouse service for given warehouse over the last 24 hour window |
| snowflake_logins_total | Guage | number | Total login attempts for account over the last 24 hour window |
| snowflake_pipe_credits_used_total | Gauge | credits | Snow pipe credits contotaled over the last 24 hour window |
| snowflake_query_bytes_spilled_local_avg | Gauge | Bytes | Average bytes spilled (intermediate results do not fit in memory) by local storage over the last 24 hour window |
| snowflake_query_bytes_spilled_remote_avg | Gauge | Bytes | Average bytes spilled (intermediate results do not fit in memory) by remote storage over the last 24 hour window |
| snowflake_query_data_scanned_cache_avg | Gauge | double | Average percentage of data scanned from cache over the last 24 hour window |
| snowflake_query_partitions_scanned_avg | Gauge | double | Number of partitions scanned during query so far over the last 24 hour window |
| snowflake_rows_deleted_avg | Gauge | number | Number of rows deleted from a table (or tables) over the last 24 hour window |
| snowflake_rows_inserted_avg | Gauge | number | Number of rows inserted into a table (or tables) over the last 24 hour window |
| snowflake_rows_produced_avg | Gauge | number | Average number of rows produced by statement over the last 24 hour window |
| snowflake_rows_unloaded_avg | Gauge | number | Average number of rows unloaded during data export over the last 24 hour window |
| snowflake_rows_updated_avg | Gauge | number | Average number of rows updated in a table over the last 24 hour window |
| snowflake_session_id_count | Gauge | number | Distinct session id's associated with snowflake username over the last 24 hour window |
| snowflake_storage_failsafe_bytes_total | Gauge | Bytes | Number of bytes of data in Fail-safe |
You can refer this page for more details about the Snowflake metrics.
