

Overview
This guide walks you through enabling observability and monitoring for your Python-based LlamaIndex application and streaming telemetry data to SigNoz Cloud using OpenTelemetry. By the end of this setup, you'll be able to monitor AI-specific operations such as document ingestion, document retrieval, user querying, text generation, and user feedback within LlamaIndex, with detailed spans capturing request durations, node and query inputs, model outputs, retrieval scores, metadata, and intermediate steps throughout the pipeline.
Instrumenting your RAG workflows with telemetry enables full observability across the retrieval and generation pipeline. This is especially valuable when building production-grade developer-facing tools, where insight into model behavior, latency bottlenecks, and retrieval accuracy is essential. With SigNoz, you can trace each user question end-to-end, from prompt to response, and continuously improve performance and reliability.
To get started, check out our example LlamaIndex RAG Q&A bot, complete with OpenTelemetry-based monitoring (via OpenInference). View the full repository here.
Prerequisites
- A Python application using Python 3.8+
- LlamaIndex integrated into your app, with document ingestion and query interfaces set up
- Basic understanding of RAG (Retrieval-Augmented Generation) workflows
- SigNoz setup (choose one):
- SigNoz Cloud account with an active ingestion key
- Self-hosted SigNoz instance
pipinstalled for managing Python packages- Internet access to send telemetry data to SigNoz Cloud
- (Optional but recommended) A Python virtual environment to isolate dependencies
Instrument your LlamaIndex application
To capture detailed telemetry from LlamaIndex without modifying your core application logic, we use OpenInference, a community-driven standard that provides pre-built instrumentation for popular AI frameworks like LlamaIndex, built on top of OpenTelemetry. This allows you to trace your LlamaIndex application with minimal configuration.
Check out detailed instructions on how to set up OpenInference instrumentation in your LlamaIndex application over here.
No-code auto-instrumentation is recommended for quick setup with minimal code changes. It's ideal when you want to get observability up and running without modifying your application code and are leveraging standard instrumentor libraries.
Step 1: Install the necessary packages in your Python environment.
pip install \
  opentelemetry-distro \
  opentelemetry-exporter-otlp \
  opentelemetry-instrumentation-httpx \
  opentelemetry-instrumentation-system-metrics \
  llama-index \
  openinference-instrumentation-llama-index
Step 2: Add Automatic Instrumentation
opentelemetry-bootstrap --action=install
Step 3: Configure logging level
To ensure logs are properly captured and exported, configure the root logger to emit logs at the INFO level or higher:
import logging

logging.getLogger().setLevel(logging.INFO)
This sets the minimum log level for the root logger to INFO, which ensures that logger.info() calls and higher severity logs (WARNING, ERROR, CRITICAL) are captured by the OpenTelemetry logging auto-instrumentation and sent to SigNoz.
Step 4: Run an example
from llama_index.llms.openai import OpenAI

llm = OpenAI(model="gpt-4o")

response = llm.complete("Hello, world!")
print(response)
📌 Note: Ensure that the
OPENAI_API_KEYenvironment variable is properly defined with your API key before running the code.
Step 5: Run your application with auto-instrumentation
OTEL_RESOURCE_ATTRIBUTES="service.name=<service_name>" \
OTEL_EXPORTER_OTLP_ENDPOINT="https://ingest.<region>.signoz.cloud:443" \
OTEL_EXPORTER_OTLP_HEADERS="signoz-ingestion-key=<your-ingestion-key>" \
OTEL_EXPORTER_OTLP_PROTOCOL=grpc \
OTEL_TRACES_EXPORTER=otlp \
OTEL_METRICS_EXPORTER=otlp \
OTEL_LOGS_EXPORTER=otlp \
OTEL_PYTHON_LOG_CORRELATION=true \
OTEL_PYTHON_LOGGING_AUTO_INSTRUMENTATION_ENABLED=true \
opentelemetry-instrument <your_run_command>
<service_name>is the name of your service<region>: Your SigNoz Cloud region<your-ingestion-key>: Your SigNoz ingestion key- Replace
<your_run_command>with the actual command you would use to run your application. For example:python main.py
Using self-hosted SigNoz? Most steps are identical. To adapt this guide, update the endpoint and remove the ingestion key header as shown in Cloud → Self-Hosted.
Code-based instrumentation gives you fine-grained control over your telemetry configuration. Use this approach when you need to customize resource attributes, sampling strategies, or integrate with existing observability infrastructure.
Step 1: Install OpenInference and OpenTelemetry related packages
pip install openinference-instrumentation-llama-index \
opentelemetry-exporter-otlp \
opentelemetry-sdk \
llama-index
Step 2: Import the necessary modules in your Python application
from opentelemetry.exporter.otlp.proto.http.trace_exporter import OTLPSpanExporter
from opentelemetry.sdk.trace import TracerProvider
from opentelemetry.sdk.trace.export import BatchSpanProcessor
from opentelemetry.sdk.resources import Resource
from openinference.instrumentation.llama_index import LlamaIndexInstrumentor
Step 3: Set up the OpenTelemetry Tracer Provider to send traces directly to SigNoz Cloud
resource = Resource.create({"service.name": "<service_name>"})
provider = TracerProvider(resource=resource)
span_exporter = OTLPSpanExporter(
    endpoint="https://ingest.<region>.signoz.cloud:443/v1/traces",
    headers={"signoz-ingestion-key": "<your-ingestion-key>"},
)
provider.add_span_processor(BatchSpanProcessor(span_exporter))
<service_name>is the name of your service<region>: Your SigNoz Cloud region<your-ingestion-key>: Your SigNoz ingestion key
Using self-hosted SigNoz? Most steps are identical. To adapt this guide, update the endpoint and remove the ingestion key header as shown in Cloud → Self-Hosted.
Step 4: Instrument LlamaIndex using OpenInference and the configured Tracer Provider
Use the LlamaIndexInstrumentor from OpenInference to automatically trace LlamaIndex operations with your OpenTelemetry setup:
LlamaIndexInstrumentor().instrument(tracer_provider=provider)
📌 Important: Place this code at the start of your application logic — before any LlamaIndex functions are called or used — to ensure telemetry is correctly captured.
Step 5: Run an example
from llama_index.llms.openai import OpenAI

llm = OpenAI(model="gpt-4o")

response = llm.complete("Hello, world!")
print(response)
📌 Note: Ensure that the
OPENAI_API_KEYenvironment variable is properly defined with your API key before running the code.
Your LlamaIndex commands should now automatically emit traces, spans, and attributes.
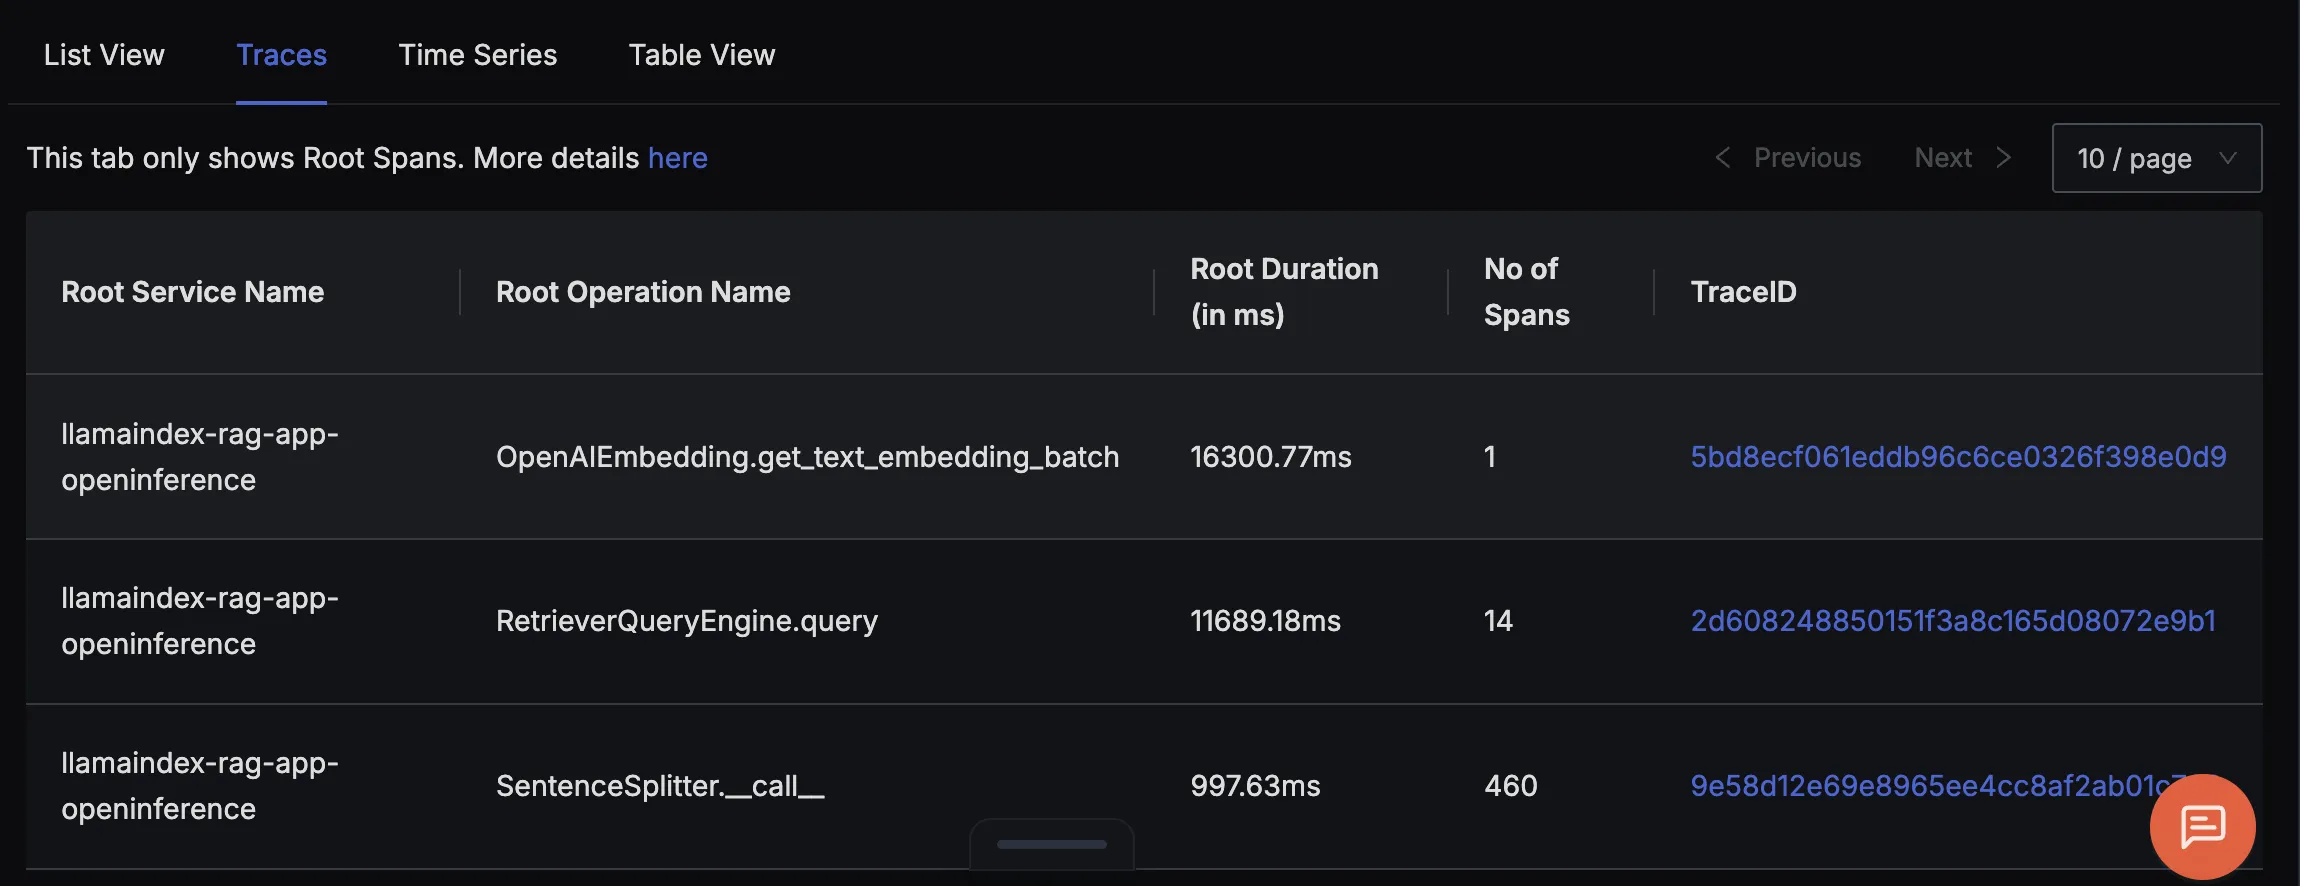
Finally, you should be able to view this data in Signoz Cloud under the traces tab:
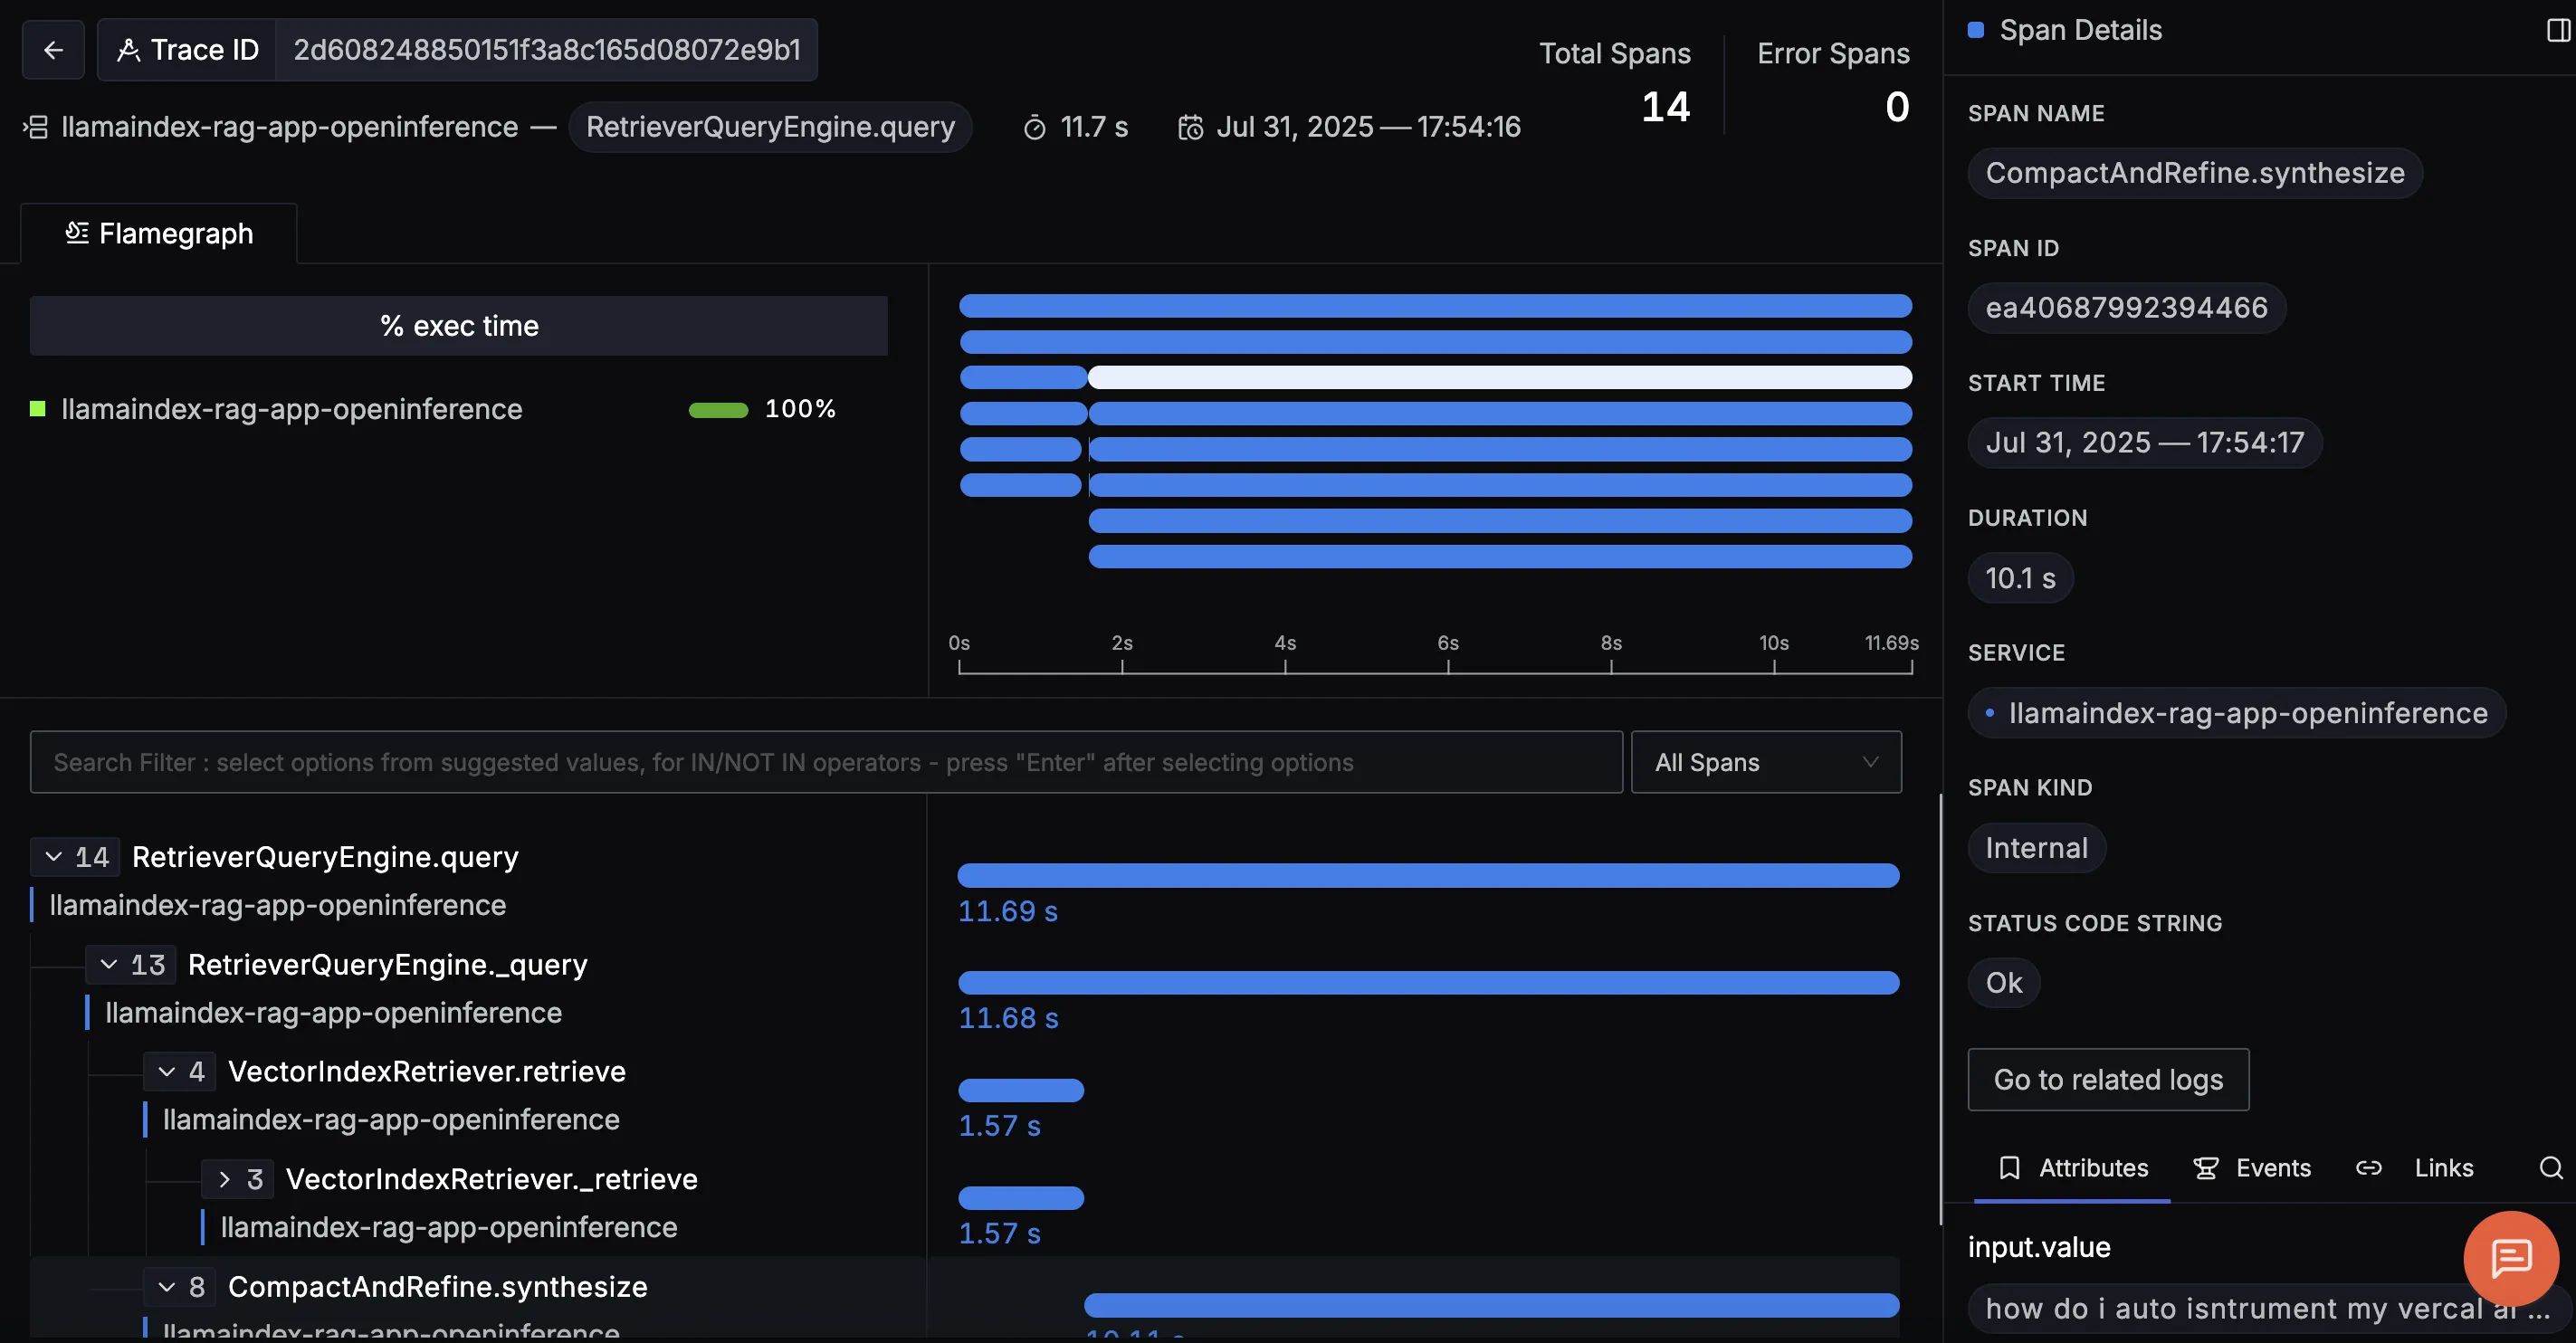
When you click on a trace ID in SigNoz, you'll see a detailed view of the trace, including all associated spans, along with their events and attributes.