This document contains instructions on how to set up OpenTelemetry instrumentation for monitoring and observability of your OpenAI applications and view your application traces, logs, and metrics in SigNoz.
Requirements
- Python 3.8 or newer
- OpenAI Python library (
openai >= 1.0.0) - Valid OpenAI API key
- SigNoz setup (choose one):
- SigNoz Cloud account with an active ingestion key
- Self-hosted SigNoz instance
Setup
Step 1. Create a virtual environment
python3 -m venv .venv
source .venv/bin/activate
Step 2. Install the OpenTelemetry dependencies
pip install opentelemetry-distro~=0.51b0
pip install opentelemetry-exporter-otlp~=1.30.0
pip install opentelemetry-instrumentation-openai-v2
Step 3. Add automatic instrumentation
opentelemetry-bootstrap --action=install
Step 4. Run your application
OTEL_SERVICE_NAME=<service-name> \
OTEL_EXPORTER_OTLP_ENDPOINT="https://ingest.<region>.signoz.cloud:443" \
OTEL_EXPORTER_OTLP_HEADERS="signoz-ingestion-key=<your-ingestion-key>" \
OTEL_EXPORTER_OTLP_PROTOCOL=grpc \
OTEL_PYTHON_LOGGING_AUTO_INSTRUMENTATION_ENABLED=true \
OTEL_INSTRUMENTATION_GENAI_CAPTURE_MESSAGE_CONTENT=true \
OPENAI_API_KEY=<your-openai-key> \
opentelemetry-instrument <your_run_command>
Environment Variables Explained:
OTEL_PYTHON_LOGGING_AUTO_INSTRUMENTATION_ENABLED- Enables automatic logging instrumentationOTEL_INSTRUMENTATION_GENAI_CAPTURE_MESSAGE_CONTENT- Captures prompts and completions as logs<region>: Your SigNoz Cloud region<your-ingestion-key>: Your SigNoz ingestion keyReplace
<service-name>with the name of your serviceReplace
<your-openai-key>with your OpenAI API key
Using self-hosted SigNoz? Most steps are identical. To adapt this guide, update the endpoint and remove the ingestion key header as shown in Cloud → Self-Hosted.
Requirements
- Java 8 or newer
- OpenAI Java SDK (
openai-java >= 1.1.0) - Valid OpenAI API key
- SigNoz setup (choose one):
- SigNoz Cloud account with an active ingestion key
- Self-hosted SigNoz instance
Setup
Step 1. Add dependencies
For Gradle (build.gradle.kts):
dependencies {
    implementation("com.openai:openai-java:3.6.1")
    implementation("io.github.cdimascio:dotenv-java:3.0.0")
    implementation("io.opentelemetry:opentelemetry-api:1.54.1")
    implementation("io.opentelemetry:opentelemetry-sdk:1.54.1")
    implementation("io.opentelemetry:opentelemetry-sdk-trace:1.54.1")
    implementation("io.opentelemetry:opentelemetry-sdk-metrics:1.54.1")
    implementation("io.opentelemetry:opentelemetry-sdk-logs:1.54.1")
    implementation("io.opentelemetry:opentelemetry-exporter-otlp:1.54.1")
    implementation("io.opentelemetry:opentelemetry-semconv:1.27.0-alpha")
    implementation(platform("io.opentelemetry.instrumentation:opentelemetry-instrumentation-bom-alpha:2.20.1-alpha"))
    implementation("io.opentelemetry.instrumentation:opentelemetry-openai-java-1.1")
}
For Maven (pom.xml):
<dependencies>
    <dependency>
        <groupId>com.openai</groupId>
        <artifactId>openai-java</artifactId>
        <version>3.6.1</version>
    </dependency>
    <dependency>
        <groupId>io.github.cdimascio</groupId>
        <artifactId>dotenv-java</artifactId>
        <version>3.0.0</version>
    </dependency>
    <dependency>
        <groupId>io.opentelemetry</groupId>
        <artifactId>opentelemetry-api</artifactId>
        <version>1.54.1</version>
    </dependency>
    <dependency>
        <groupId>io.opentelemetry</groupId>
        <artifactId>opentelemetry-sdk</artifactId>
        <version>1.54.1</version>
    </dependency>
    <dependency>
        <groupId>io.opentelemetry</groupId>
        <artifactId>opentelemetry-sdk-trace</artifactId>
        <version>1.54.1</version>
    </dependency>
    <dependency>
        <groupId>io.opentelemetry</groupId>
        <artifactId>opentelemetry-sdk-metrics</artifactId>
        <version>1.54.1</version>
    </dependency>
    <dependency>
        <groupId>io.opentelemetry</groupId>
        <artifactId>opentelemetry-sdk-logs</artifactId>
        <version>1.54.1</version>
    </dependency>
    <dependency>
        <groupId>io.opentelemetry</groupId>
        <artifactId>opentelemetry-exporter-otlp</artifactId>
        <version>1.54.1</version>
    </dependency>
    <dependency>
        <groupId>io.opentelemetry</groupId>
        <artifactId>opentelemetry-semconv</artifactId>
        <version>1.27.0-alpha</version>
    </dependency>
    <dependency>
        <groupId>io.opentelemetry.instrumentation</groupId>
        <artifactId>opentelemetry-openai-java-1.1</artifactId>
        <version>2.20.1-alpha</version>
    </dependency>
</dependencies>
Step 2. Import the necessary modules in your Java application
OpenTelemetry:
import io.opentelemetry.api.OpenTelemetry;
import io.opentelemetry.instrumentation.openai.v1_1.OpenAITelemetry;
import io.opentelemetry.sdk.OpenTelemetrySdk;
import io.opentelemetry.sdk.resources.Resource;
import io.opentelemetry.semconv.ServiceAttributes;
Traces:
import io.opentelemetry.sdk.trace.SdkTracerProvider;
import io.opentelemetry.sdk.trace.export.BatchSpanProcessor;
import io.opentelemetry.exporter.otlp.http.trace.OtlpHttpSpanExporter;
Logs:
import io.opentelemetry.sdk.logs.SdkLoggerProvider;
import io.opentelemetry.sdk.logs.export.BatchLogRecordProcessor;
import io.opentelemetry.exporter.otlp.http.logs.OtlpHttpLogRecordExporter;
Metrics:
import io.opentelemetry.sdk.metrics.SdkMeterProvider;
import io.opentelemetry.sdk.metrics.export.PeriodicMetricReader;
import io.opentelemetry.exporter.otlp.http.metrics.OtlpHttpMetricExporter;
Step 3. Setup Traces
import io.github.cdimascio.dotenv.Dotenv;

import io.opentelemetry.api.OpenTelemetry;
import io.opentelemetry.sdk.OpenTelemetrySdk;
import io.opentelemetry.sdk.resources.Resource;
import io.opentelemetry.semconv.ServiceAttributes;

import io.opentelemetry.sdk.trace.SdkTracerProvider;
import io.opentelemetry.sdk.trace.export.BatchSpanProcessor;
import io.opentelemetry.exporter.otlp.http.trace.OtlpHttpSpanExporter;

Dotenv dotenv = Dotenv.load();

String serviceName = "<service_name>";

Resource resource = Resource.getDefault()
            .toBuilder()
            .put(ServiceAttributes.SERVICE_NAME, serviceName)
            .build();

OtlpHttpSpanExporter otlpSpanExporter = OtlpHttpSpanExporter.builder()
            .setEndpoint(System.getenv("OTEL_EXPORTER_TRACES_ENDPOINT"))
            .addHeader("signoz-ingestion-key", System.getenv("SIGNOZ_INGESTION_KEY"))
            .build();

SdkTracerProvider tracerProvider = SdkTracerProvider.builder()
            .setResource(resource)
            .addSpanProcessor(BatchSpanProcessor.builder(otlpSpanExporter).build())
            .build();
<service_name>is the name of your serviceOTEL_EXPORTER_TRACES_ENDPOINT→ SigNoz Cloud endpoint with appropriate region:https://ingest.<region>.signoz.cloud:443/v1/tracesSIGNOZ_INGESTION_KEY→ Your SigNoz ingestion key
Using self-hosted SigNoz? Most steps are identical. To adapt this guide, update the endpoint and remove the ingestion key header as shown in Cloud → Self-Hosted.
Step 4. Setup Logs
import io.opentelemetry.sdk.logs.SdkLoggerProvider;
import io.opentelemetry.sdk.logs.export.BatchLogRecordProcessor;
import io.opentelemetry.exporter.otlp.http.logs.OtlpHttpLogRecordExporter;

OtlpHttpLogRecordExporter otlpLogExporter = OtlpHttpLogRecordExporter.builder()
            .setEndpoint(System.getenv("OTEL_EXPORTER_LOGS_ENDPOINT"))
            .addHeader("signoz-ingestion-key", System.getenv("SIGNOZ_INGESTION_KEY"))
            .build();

SdkLoggerProvider loggerProvider = SdkLoggerProvider.builder()
            .setResource(resource)
            .addLogRecordProcessor(BatchLogRecordProcessor.builder(otlpLogExporter).build())
            .build();
OTEL_EXPORTER_LOGS_ENDPOINT→ SigNoz Cloud endpoint with appropriate region:https://ingest.<region>.signoz.cloud:443/v1/logsSIGNOZ_INGESTION_KEY→ Your SigNoz ingestion key
Using self-hosted SigNoz? Most steps are identical. To adapt this guide, update the endpoint and remove the ingestion key header as shown in Cloud → Self-Hosted.
Step 5. Setup Metrics
import io.opentelemetry.sdk.metrics.SdkMeterProvider;
import io.opentelemetry.sdk.metrics.export.PeriodicMetricReader;
import io.opentelemetry.exporter.otlp.http.metrics.OtlpHttpMetricExporter;

OtlpHttpMetricExporter otlpMetricExporter = OtlpHttpMetricExporter.builder()
            .setEndpoint(System.getenv("OTEL_EXPORTER_METRICS_ENDPOINT"))
            .addHeader("signoz-ingestion-key", System.getenv("SIGNOZ_INGESTION_KEY"))
            .build();

SdkMeterProvider meterProvider = SdkMeterProvider.builder()
            .setResource(resource)
            .registerMetricReader(PeriodicMetricReader.builder(otlpMetricExporter).build())
            .build();
OTEL_EXPORTER_METRICS_ENDPOINT→ SigNoz Cloud endpoint with appropriate region:https://ingest.<region>.signoz.cloud:443/v1/metricsSIGNOZ_INGESTION_KEY→ Your SigNoz ingestion key
Using self-hosted SigNoz? Most steps are identical. To adapt this guide, update the endpoint and remove the ingestion key header as shown in Cloud → Self-Hosted.
Step 6. Setup OpenTelemetry SDK with your created providers
OpenTelemetrySdk openTelemetry = OpenTelemetrySdk.builder()
            .setTracerProvider(tracerProvider)
            .setMeterProvider(meterProvider)
            .setLoggerProvider(loggerProvider)
            .build();
Step 7. Run an Example using OpenAI Instrumentor
import io.opentelemetry.instrumentation.openai.v1_1.OpenAITelemetry;
import com.openai.client.OpenAIClient;
import com.openai.client.okhttp.OpenAIOkHttpClient;
import com.openai.models.ChatModel;
import com.openai.models.chat.completions.ChatCompletion;
import com.openai.models.chat.completions.ChatCompletionCreateParams;

OpenAIClient client = OpenAIOkHttpClient.builder()
            .apiKey(System.getenv("OPENAI_API_KEY"))
            .build();

OpenAIClient otelClient = OpenAITelemetry.builder(openTelemetry)
            .build()
            .wrap(client);

ChatCompletionCreateParams params = ChatCompletionCreateParams.builder()
            .addUserMessage("What is SigNoz?")
            .model("gpt-4.1")
            .build();

ChatCompletion chatCompletion = otelClient.chat().completions().create(params);
System.out.println(chatCompletion);

// Force flush with timeout to ensure all telemetry is exported before shutdown
sdk.getSdkTracerProvider().forceFlush().join(10, java.util.concurrent.TimeUnit.SECONDS);
sdk.getSdkMeterProvider().forceFlush().join(10, java.util.concurrent.TimeUnit.SECONDS);
sdk.getSdkLoggerProvider().forceFlush().join(10, java.util.concurrent.TimeUnit.SECONDS);

sdk.getSdkTracerProvider().shutdown();
sdk.getSdkMeterProvider().shutdown();
sdk.getSdkLoggerProvider().shutdown();
📌 Note: Before running this code, ensure that you have set the environment variable or .env file
OPENAI_API_KEYwith your generated API key.
Requirements
- Java 8 or newer
- OpenAI Java SDK (
openai-java >= 1.1.0) - Valid OpenAI API key
- OpenTelemetry Java agent (if not already installed)
- SigNoz setup (choose one):
- SigNoz Cloud account with an active ingestion key
- Self-hosted SigNoz instance
Setup with Auto-Instrumentation
If you're already using the OpenTelemetry Java agent for auto-instrumentation, you can add OpenAI instrumentation on top of your existing setup.
Step 1. Add dependencies
For Gradle (build.gradle.kts):
dependencies {
    implementation("com.openai:openai-java:3.6.1")
    implementation(platform("io.opentelemetry.instrumentation:opentelemetry-instrumentation-bom-alpha:2.20.1-alpha"))
    implementation("io.opentelemetry.instrumentation:opentelemetry-openai-java-1.1")
}
For Maven (pom.xml):
<dependencies>
    <dependency>
        <groupId>com.openai</groupId>
        <artifactId>openai-java</artifactId>
        <version>3.6.1</version>
    </dependency>
    <dependency>
        <groupId>io.opentelemetry.instrumentation</groupId>
        <artifactId>opentelemetry-openai-java-1.1</artifactId>
        <version>2.20.1-alpha</version>
    </dependency>
</dependencies>
Step 2. Import the necessary modules in your Java application
import io.opentelemetry.api.GlobalOpenTelemetry;
import io.opentelemetry.api.OpenTelemetry;
import io.opentelemetry.instrumentation.openai.v1_1.OpenAITelemetry;
import com.openai.client.OpenAIClient;
import com.openai.client.okhttp.OpenAIOkHttpClient;
import com.openai.models.ChatModel;
import com.openai.models.chat.completions.ChatCompletion;
import com.openai.models.chat.completions.ChatCompletionCreateParams;
Step 3. Wrap your OpenAI client with OpenTelemetry instrumentation
// Get the global OpenTelemetry instance configured by the Java agent
OpenTelemetry openTelemetry = GlobalOpenTelemetry.get();

// Create your OpenAI client
OpenAIClient client = OpenAIOkHttpClient.builder()
    .apiKey(System.getenv("OPENAI_API_KEY"))
    .build();

// Wrap it with OpenTelemetry instrumentation
OpenAIClient otelClient = OpenAITelemetry.builder(openTelemetry)
    .build()
    .wrap(client);

// Use otelClient for all OpenAI API calls
ChatCompletionCreateParams params = ChatCompletionCreateParams.builder()
    .addUserMessage("What is SigNoz?")
    .model("gpt-4")
    .build();

ChatCompletion chatCompletion = otelClient.chat().completions().create(params);
System.out.println(chatCompletion);
Step 4. Download the OpenTelemetry Java agent (if not already installed)
curl -L -O https://github.com/open-telemetry/opentelemetry-java-instrumentation/releases/latest/download/opentelemetry-javaagent.jar
Step 5. Run your application with the Java agent
OTEL_RESOURCE_ATTRIBUTES=service.name=<service_name> \
OTEL_EXPORTER_OTLP_HEADERS="signoz-ingestion-key=<your-ingestion-key>" \
OTEL_EXPORTER_OTLP_ENDPOINT=https://ingest.<region>.signoz.cloud:443 \
java -javaagent:$PWD/opentelemetry-javaagent.jar -jar <my-app>.jar
Configuration Variables:
- Set
<service_name>to the name of your service <region>: Your SigNoz Cloud region<your-ingestion-key>: Your SigNoz ingestion key- Replace
<my-app>with your application JAR file name
Using self-hosted SigNoz? Most steps are identical. To adapt this guide, update the endpoint and remove the ingestion key header as shown in Cloud → Self-Hosted.
📌 Note: This approach uses
GlobalOpenTelemetry.get()to retrieve the OpenTelemetry instance configured by the Java agent. This ensures that OpenAI traces are properly correlated with traces from auto-instrumented components (HTTP servers, databases, etc.).
📌 Note: Before running this code, ensure that you have set the environment variable
OPENAI_API_KEYwith your generated API key.
📌 Note: The Java agent will automatically instrument common frameworks and libraries (Spring Boot, JDBC, HTTP clients, etc.). The OpenAI instrumentation library adds specific telemetry for OpenAI API calls on top of this existing instrumentation.
📌 Note: If you're running a web application or microservice, the OpenAI spans will automatically be linked as child spans to incoming HTTP request spans, providing full distributed tracing across your application.
What data gets captured?
This instrumentation captures comprehensive telemetry data for your OpenAI applications:
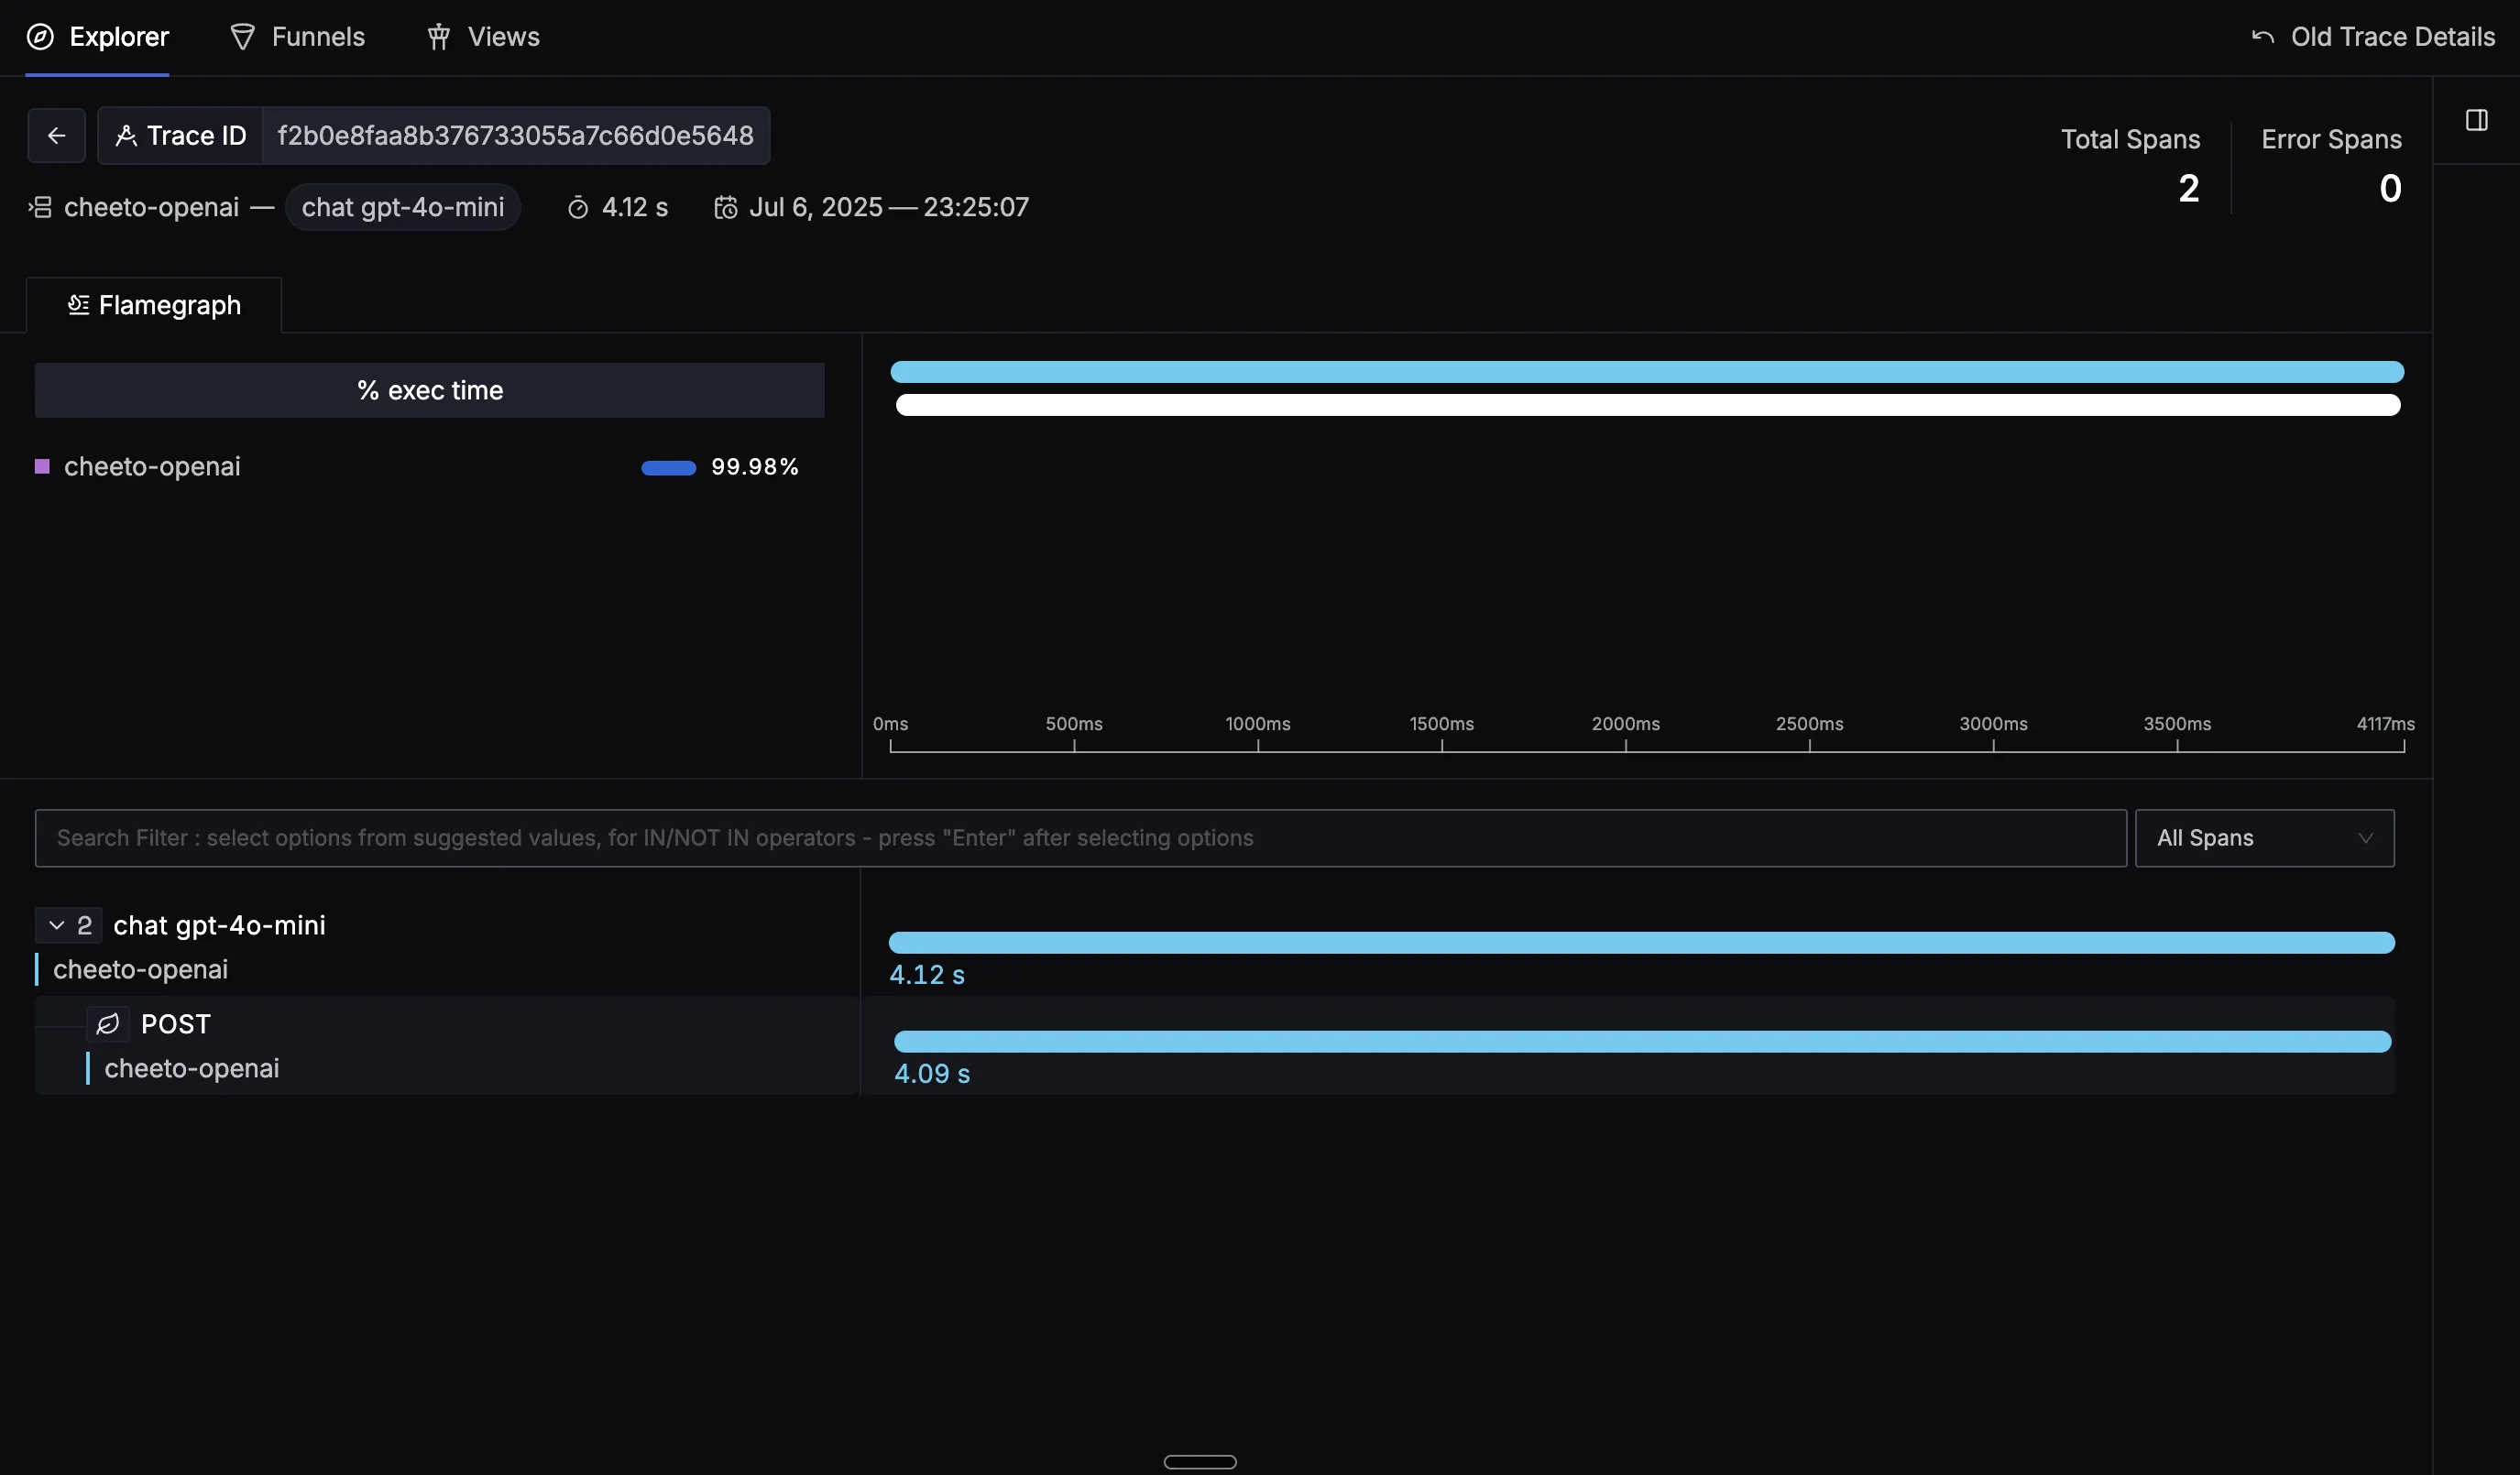
Traces
- Spans for each OpenAI API call with timing information
- Operation details like model name, max tokens etc.
- Token usage including input and output
- Request and response metadata such as finish reason and model used
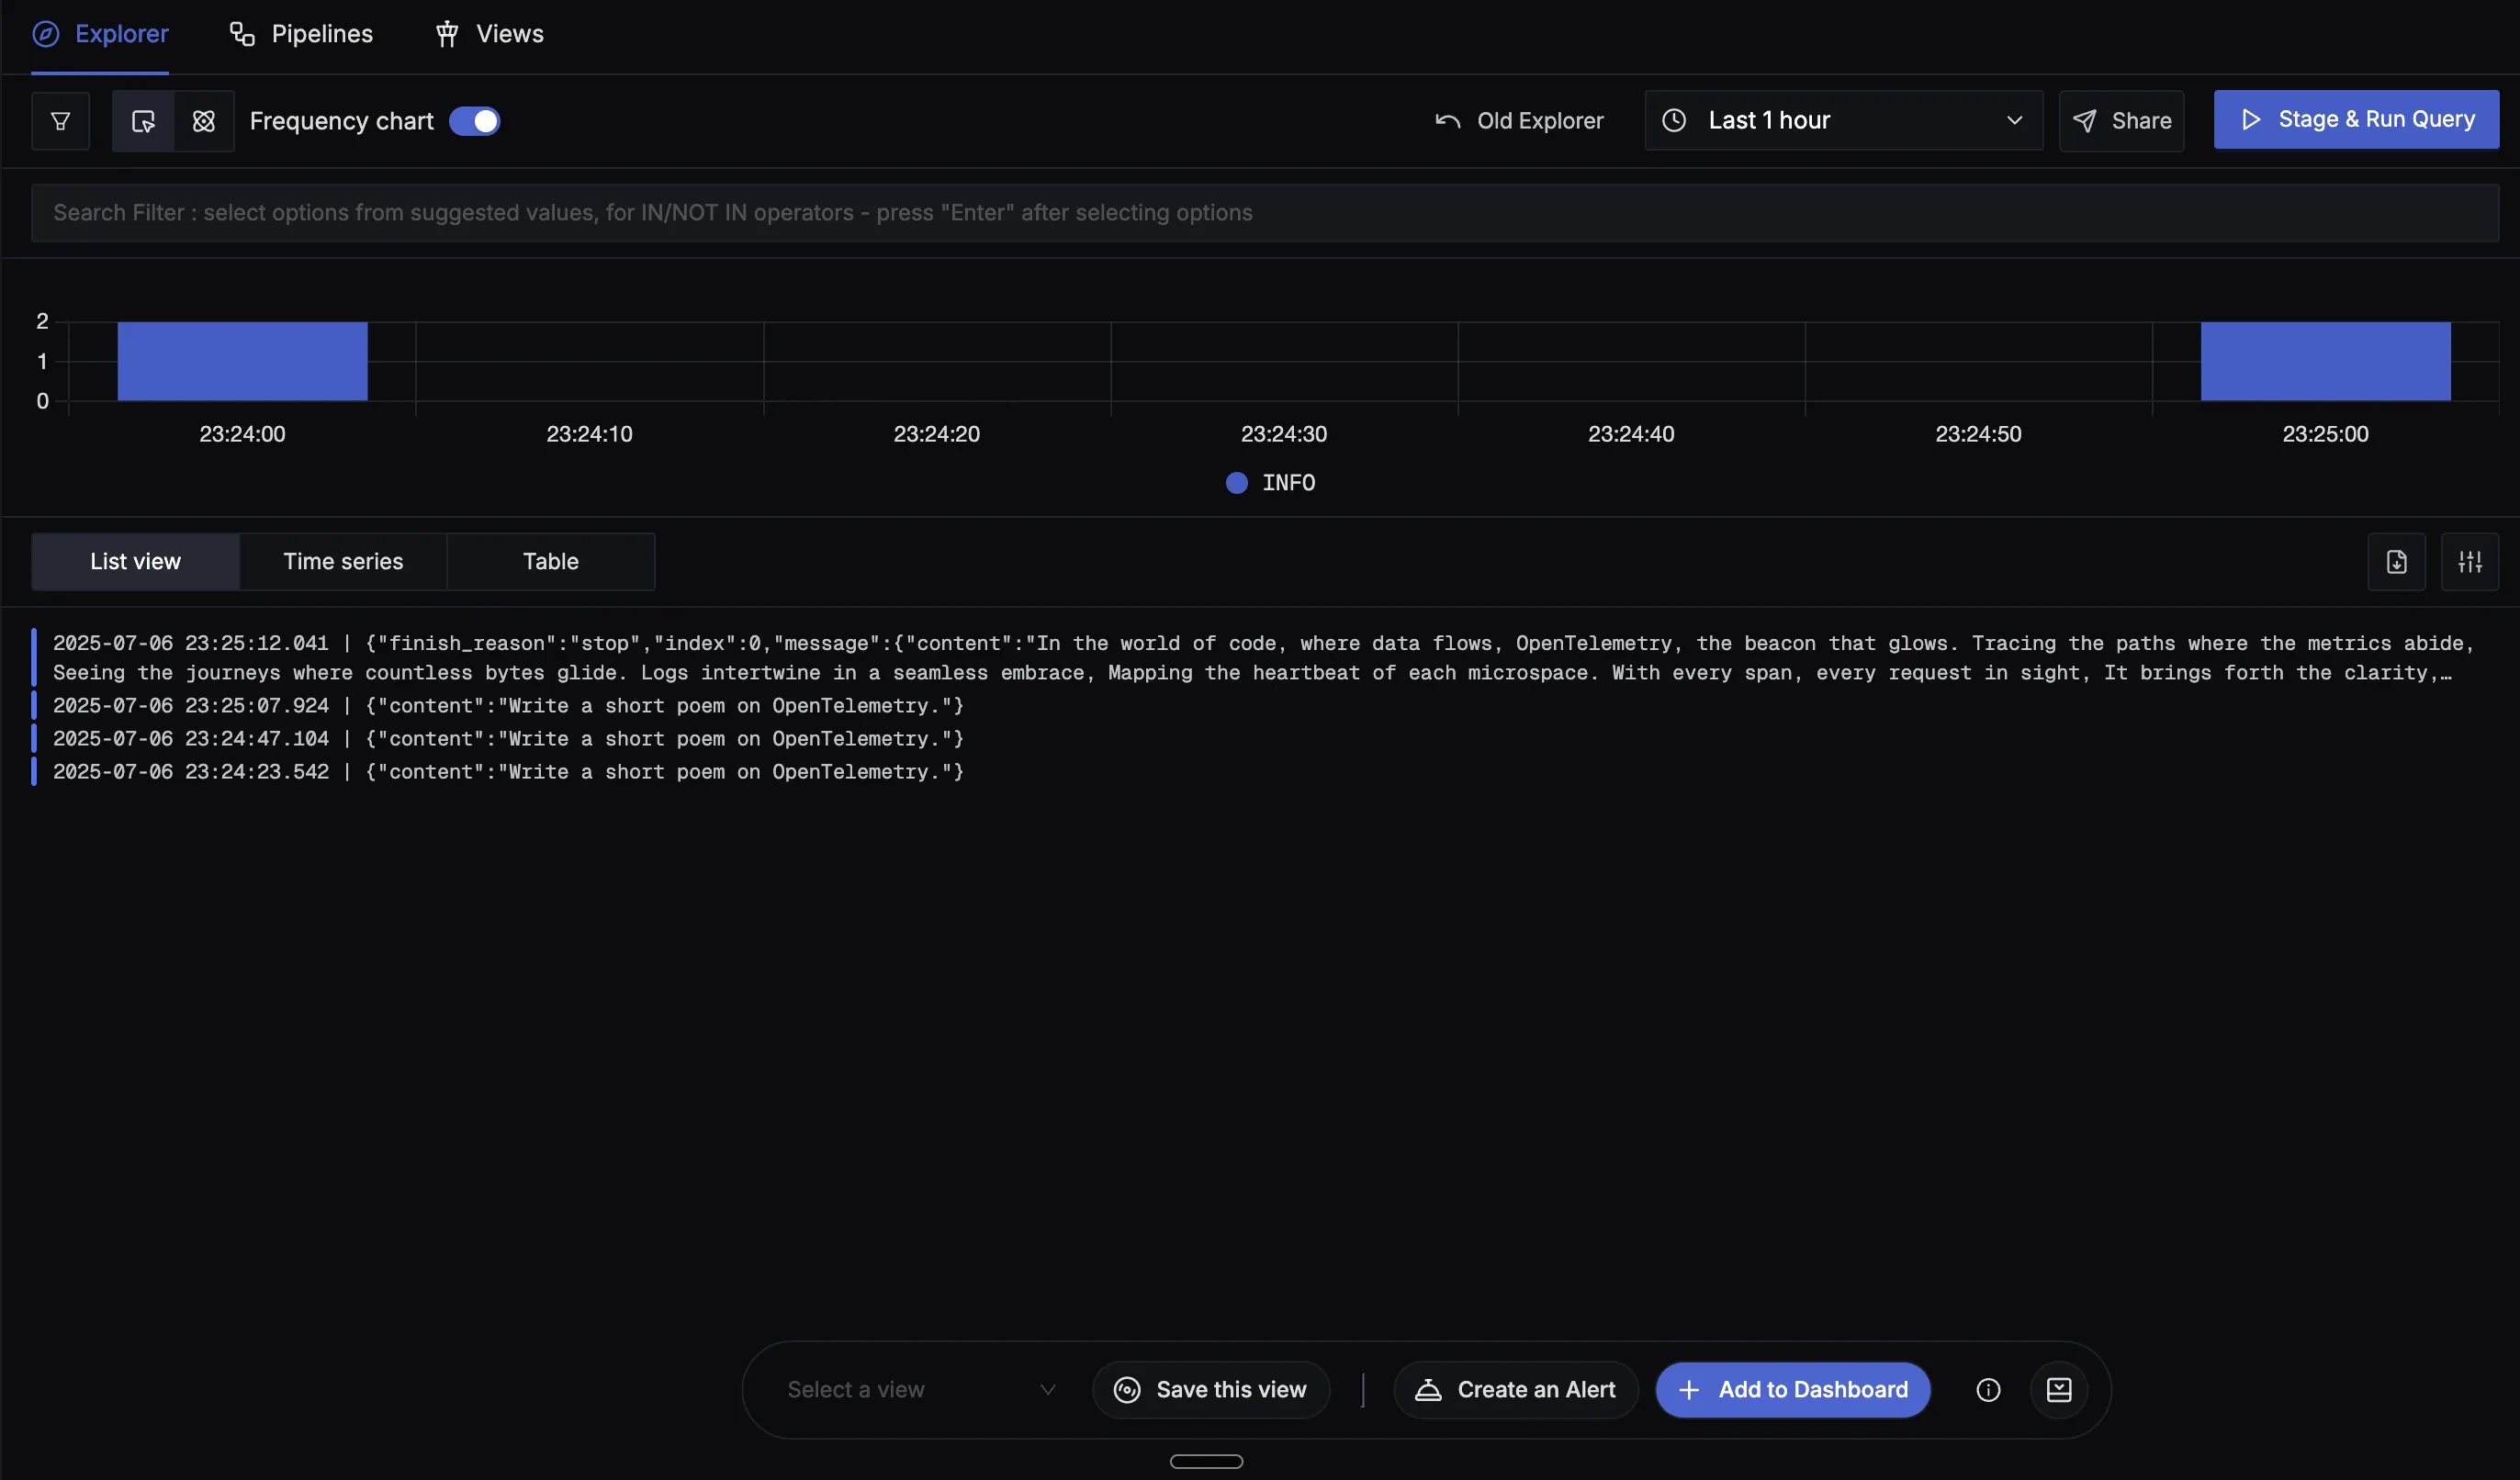
Logs
- Structured logs for each API call when
OTEL_PYTHON_LOGGING_AUTO_INSTRUMENTATION_ENABLED=trueis set - Message content logs (prompts and completions) when
OTEL_INSTRUMENTATION_GENAI_CAPTURE_MESSAGE_CONTENT=trueis enabled - Error logs for failed API calls with detailed error information and stack traces
- Performance logs showing request duration and timing information
Log Levels and Content:
INFOlevel logs for successful API calls with metadataERRORlevel logs for failed requests with error detailsDEBUGlevel logs for detailed request/response information (when debug logging is enabled)
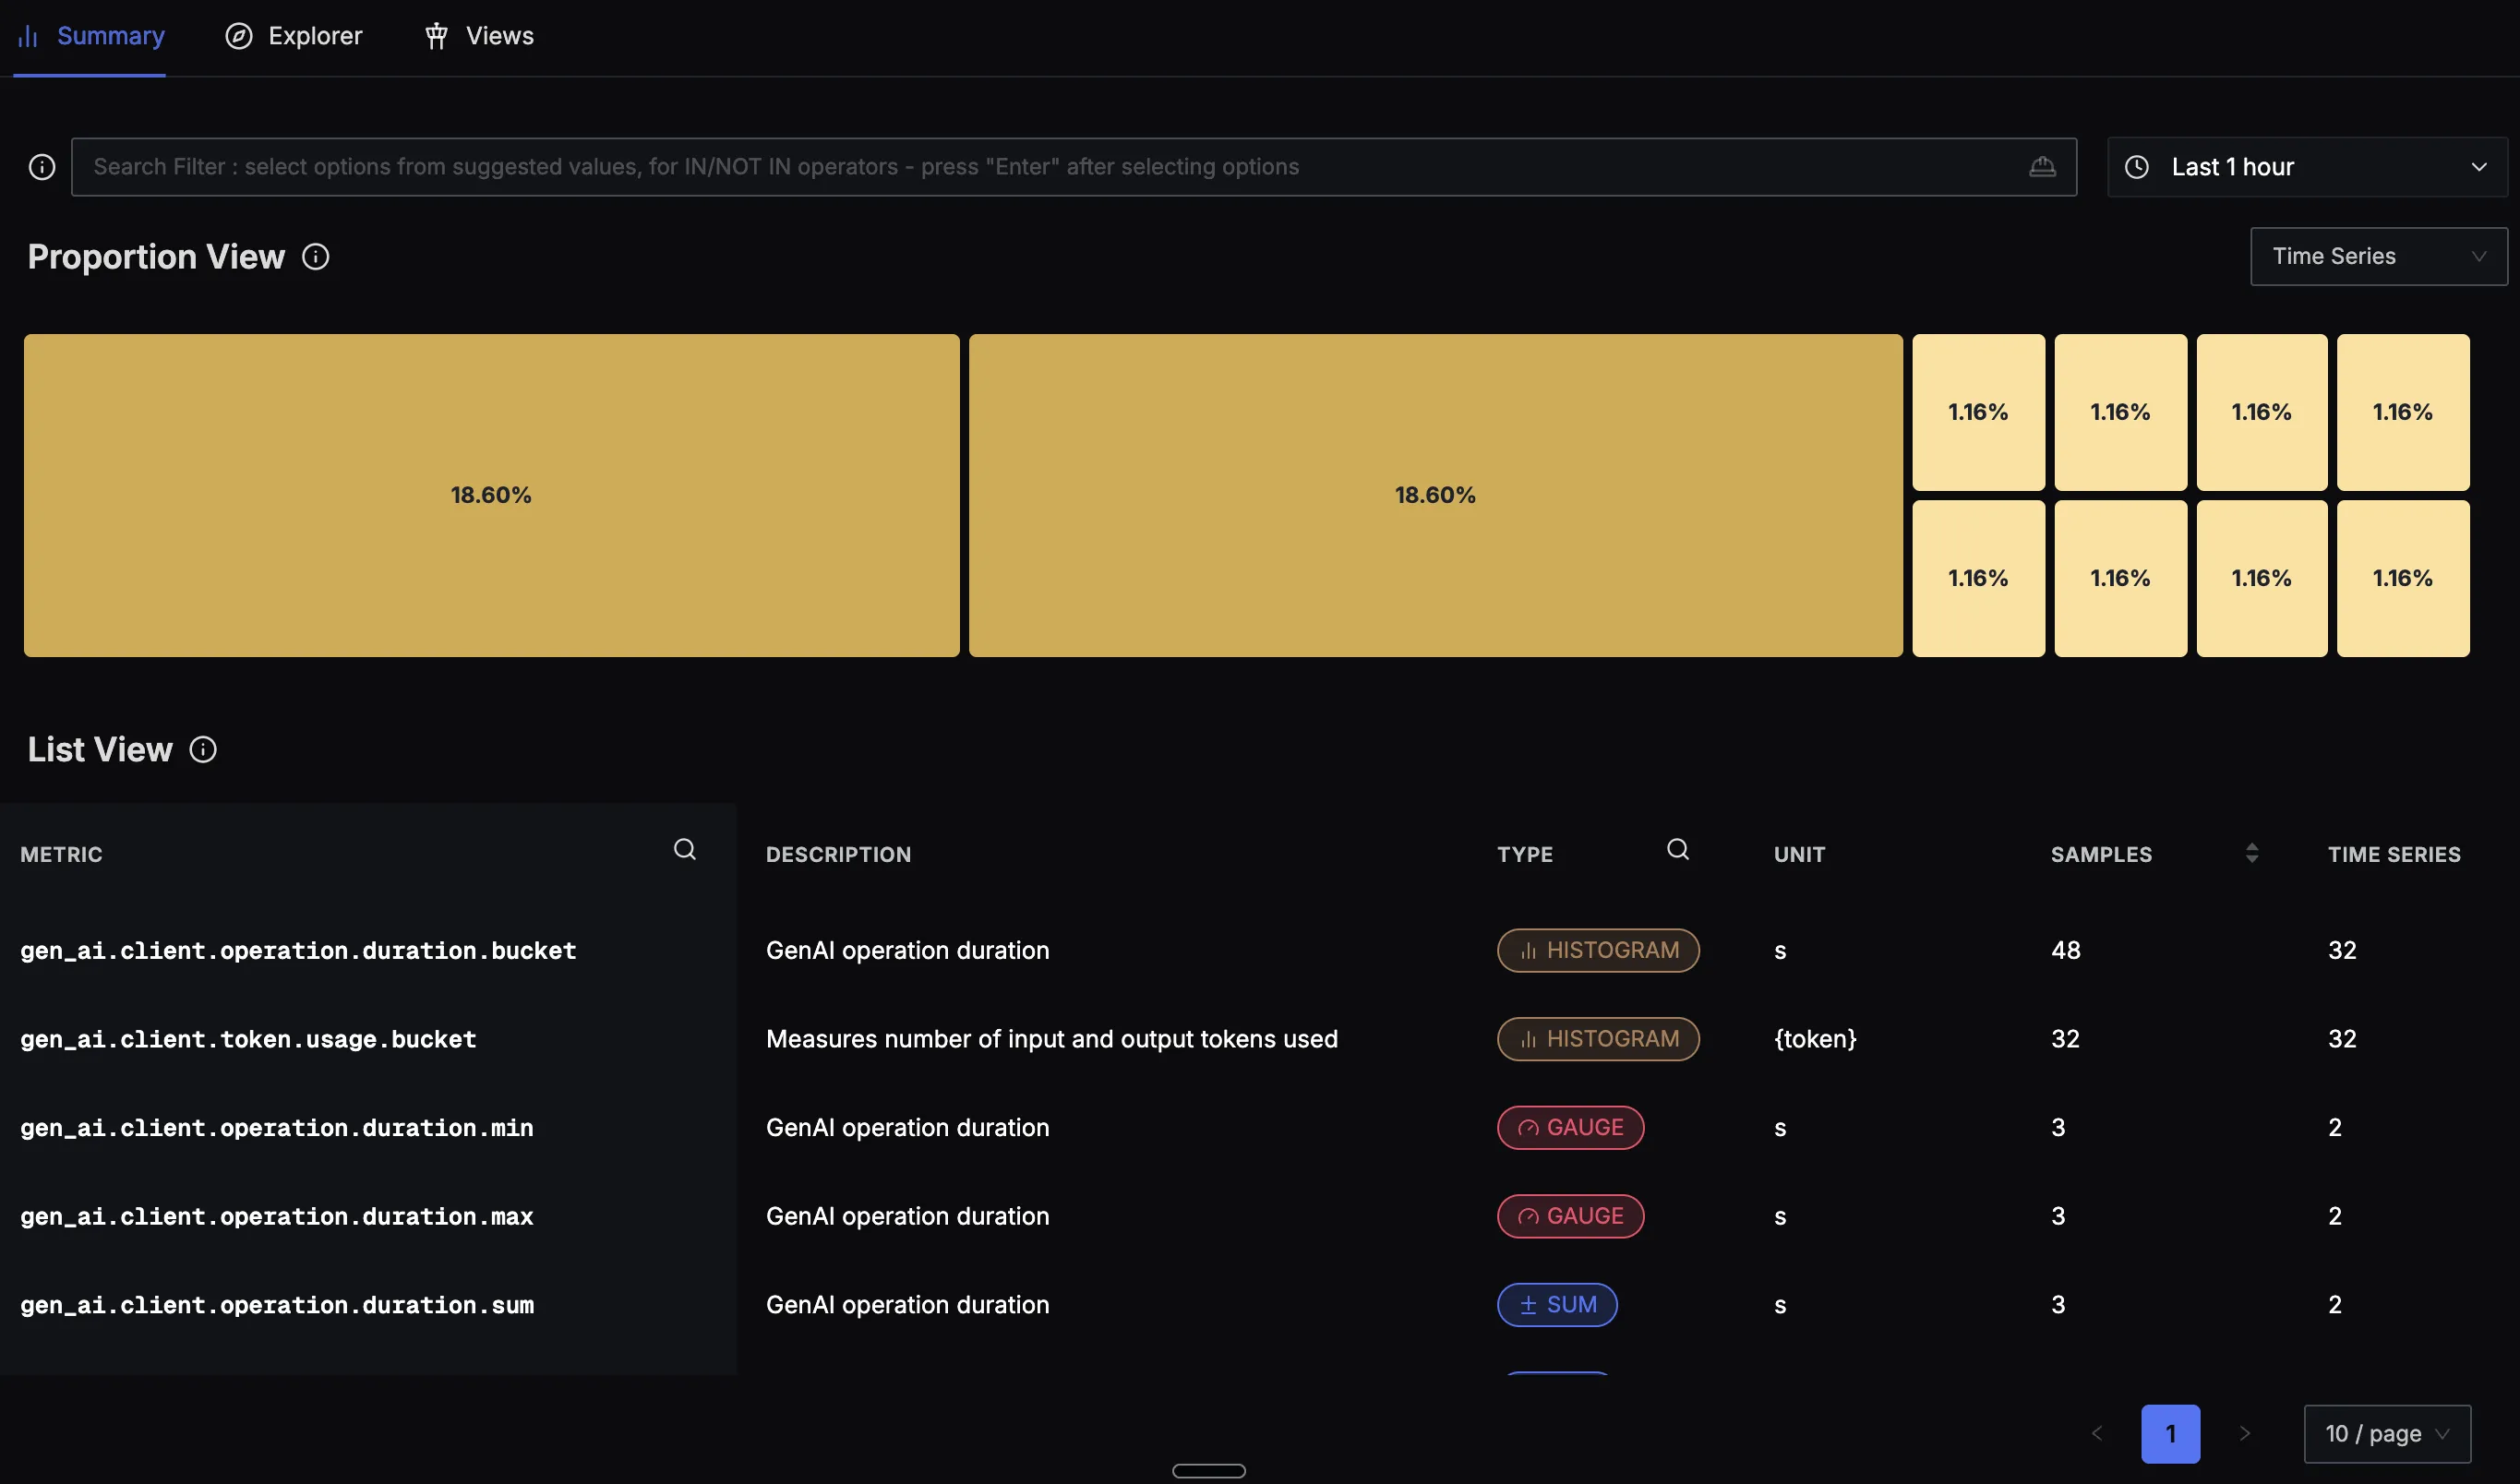
Metrics
- Duration metrics showing how long OpenAI calls take
- Token usage metrics tracking consumption over time
- Request rate metrics showing API call frequency
- Error rate metrics for monitoring API failures
More details about the metrics can be found here.
Validating instrumentation
Validate your traces, logs, and metrics in SigNoz:
- Trigger OpenAI API calls in your app. Make several API calls to generate some data. Then, wait for some time.
- In SigNoz, open the
Servicestab. Hit theRefreshbutton on the top right corner, and your application should appear in the list ofApplications. - Go to the
Tracestab, and apply relevant filters to see your application's traces. - Check the
Logstab to see captured logs from your OpenAI calls. - Visit the
Metricstab to view token usage and performance metrics.
Capturing Message Content (Optional)
By default, message content such as prompts and completions are not captured. To capture message content as log events, set the environment variable:
export OTEL_INSTRUMENTATION_GENAI_CAPTURE_MESSAGE_CONTENT=true
Note: Be cautious when enabling this in production as it may capture sensitive user data. This feature is already included in the run command above.
Troubleshooting your installation
Spans are not being reported
If spans are not being reported to SigNoz, try enabling debug exporter which writes the JSON formatted trace data to the console by setting env var OTEL_TRACES_EXPORTER=console.
OTEL_SERVICE_NAME=my-openai-app \
OTEL_TRACES_EXPORTER=console \
opentelemetry-instrument python app.py
You should see trace data in your console output that looks like:
{
  "name": "chat_completions_create",
  "context": {
    "trace_id": "0xedb7caf0c8b082a9578460a201759193",
    "span_id": "0x57cf7eee198e1fed",
    "trace_state": "[]"
  },
  "kind": "SpanKind.CLIENT",
  "parent_id": null,
  "start_time": "2025-01-15T10:30:00.804758Z",
  "end_time": "2025-01-15T10:30:01.204805Z",
  "status": {
    "status_code": "UNSET"
  },
  "attributes": {
    "gen_ai.system": "openai",
    "gen_ai.request.model": "gpt-4o-mini",
    "gen_ai.usage.total_tokens": 150
  },
  "events": [],
  "links": [],
  "resource": {
    "telemetry.sdk.language": "python",
    "telemetry.sdk.name": "opentelemetry",
    "telemetry.sdk.version": "1.30.0",
    "service.name": "my-openai-app"
  }
}
Common Issues
If you don't see your telemetry data:
- Check your OpenAI API key - Make sure
OPENAI_API_KEYenvironment variable is set - Verify network connectivity - Ensure your application can reach SigNoz Cloud endpoints
- Check ingestion key - Verify your SigNoz ingestion key is correct
- Wait for data - OpenTelemetry batches data before sending, so wait 10-30 seconds after making API calls
Dashboard
You can also check out our custom OpenAI dashboard here which provides specialized visualizations for monitoring your OpenAI usage in applications. The dashboard includes pre-built charts specifically tailored for LLM usage, along with import instructions to get started quickly.

