Overview
This guide walks you through enabling observability and monitoring in the Vercel AI SDK and streaming that data to SigNoz using OpenTelemetry. By the end of this setup, you'll be able to monitor AI-related function calls like generateText() or generateStream()—including request durations, inputs, outputs, and custom metadata—directly within SigNoz.
Instrumenting your AI workflows with telemetry helps you observe performance, debug latency, and trace AI interactions end-to-end across your Next.js application. This is especially valuable when building production-grade AI features where visibility into model behavior and user interactions is critical.
You can explore our example Vercel AI SDK chatbot, which includes observability/monitoring via OpenTelemetry, here.
Prerequisites
- Next.js app
- Vercel AI SDK integrated into the app
- SigNoz setup (choose one):
- SigNoz Cloud account with an active ingestion key
- Self-hosted SigNoz instance
- Network access from your app to the chosen SigNoz endpoint
Instrument your Next.js application
Check out detailed instructions on how to set up OpenTelemetry instrumentation in your Nextjs applications and view your application traces in SigNoz over here.
Send traces directly to SigNoz Cloud
Step 1. Install OpenTelemetry packages
npm install @vercel/otel @opentelemetry/api
Step 2. Update next.config.mjs to include instrumentationHook
This step is only needed when using NextJs 14 and below
/** @type {import('next').NextConfig} */
const nextConfig = {
  // include instrumentationHook experimental feature
  experimental: {
    instrumentationHook: true,
  },
}
export default nextConfig
Step 3. Create instrumentation.ts file(in root project directory)
import { registerOTel, OTLPHttpJsonTraceExporter } from '@vercel/otel'
// Add otel logging
import { diag, DiagConsoleLogger, DiagLogLevel } from '@opentelemetry/api'
diag.setLogger(new DiagConsoleLogger(), DiagLogLevel.ERROR) // set diaglog level to DEBUG when debugging
export function register() {
  registerOTel({
    serviceName: '<service_name>',
    traceExporter: new OTLPHttpJsonTraceExporter({
      url: 'https://ingest.<region>.signoz.cloud:443/v1/traces',
      headers: { 'signoz-ingestion-key': '<your-ingestion-key>' },
    }),
  })
}
<service_name>is the name of your service<region>: Your SigNoz Cloud region<your-ingestion-key>: Your SigNoz ingestion key
The instrumentation file should be in the root of your project and not inside the app or pages directory. If you're using the src folder, then place the file inside src alongside pages and app.
Using self-hosted SigNoz? Most steps are identical. To adapt this guide, update the endpoint and remove the ingestion key header as shown in Cloud → Self-Hosted.
Your Next.js app should be properly instrumented now.
Step 4. Verify Instrumentation Locally
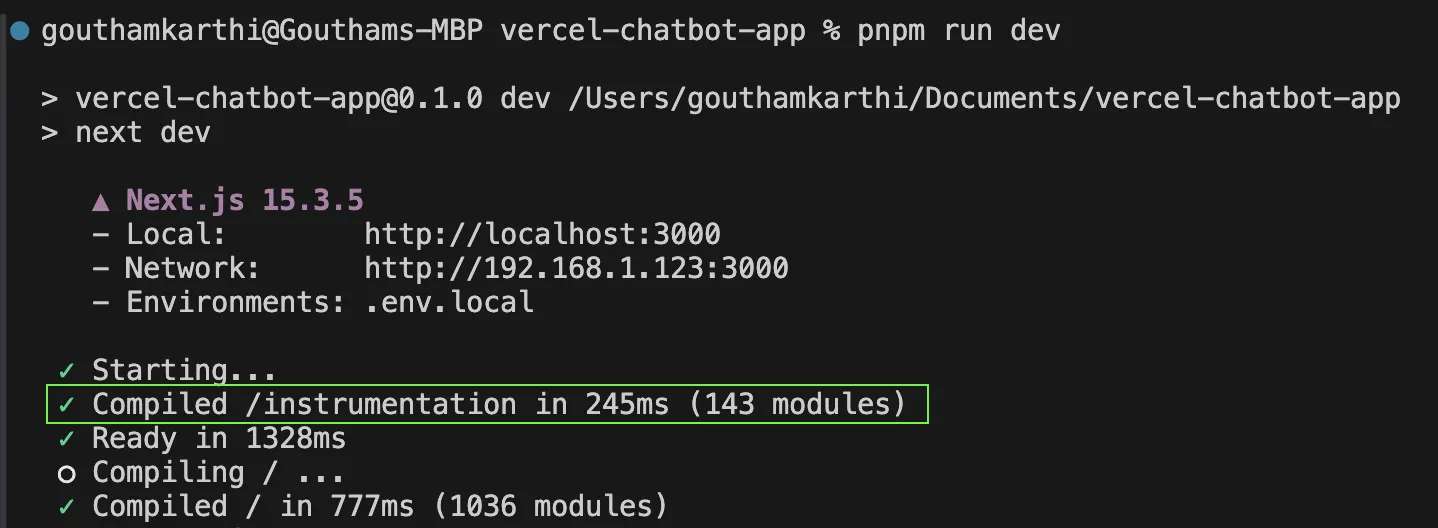
Run your Next.js application in development mode:
npm run dev
In your terminal, you should see output from OpenTelemetry when the application starts, confirming that the instrumentation.ts file was loaded correctly.
To see detailed trace export logs, you can temporarily set the DiagLogLevel to DEBUG in instrumentation.ts:
diag.setLogger(new DiagConsoleLogger(), DiagLogLevel.DEBUG)
Enable Telemetry for Vercel AI SDK
The Vercel AI SDK uses OpenTelemetry to collect telemetry data. OpenTelemetry is an open-source observability framework designed to provide standardized instrumentation for collecting telemetry data.
Enabling Telemetry
Check out more detailed information about Vercel AI SDK’s telemetry options visit here.
You can then use the experimental_telemetry option to enable telemetry on specific function calls while the feature is experimental:
const result = await generateText({
  model: openai('gpt-4-turbo'),
  prompt: 'Write a short story about a cat.',
  experimental_telemetry: { isEnabled: true },
})
When telemetry is enabled, you can also control whether you want to record the input values and the output values for the function. By default, both are enabled. You can disable them by setting the recordInputs and recordOutputs options to false.
experimental_telemetry: { isEnabled: true, recordInputs: false, recordOutputs: false}
Disabling the recording of inputs and outputs can be useful for privacy, data transfer, and performance reasons. You might, for example, want to disable recording inputs if they contain sensitive information.
Telemetry Metadata
You can provide a functionId to identify the function that the telemetry data is for, and metadata to include additional information in the telemetry data.
const result = await generateText({
  model: openai('gpt-4-turbo'),
  prompt: 'Write a short story about a cat.',
  experimental_telemetry: {
    isEnabled: true,
    functionId: 'my-awesome-function',
    metadata: {
      something: 'custom',
      someOtherThing: 'other-value',
    },
  },
})
Custom Tracer
You may provide a tracer which must return an OpenTelemetry Tracer. This is useful in situations where you want your traces to use a TracerProvider other than the one provided by the @opentelemetry/api singleton.
const tracerProvider = new NodeTracerProvider()
const result = await generateText({
  model: openai('gpt-4-turbo'),
  prompt: 'Write a short story about a cat.',
  experimental_telemetry: {
    isEnabled: true,
    tracer: tracerProvider.getTracer('ai'),
  },
})
Your Vercel AI SDK commands should now automatically emit traces, spans, and events. You can find more details on the types of spans and events generated here.
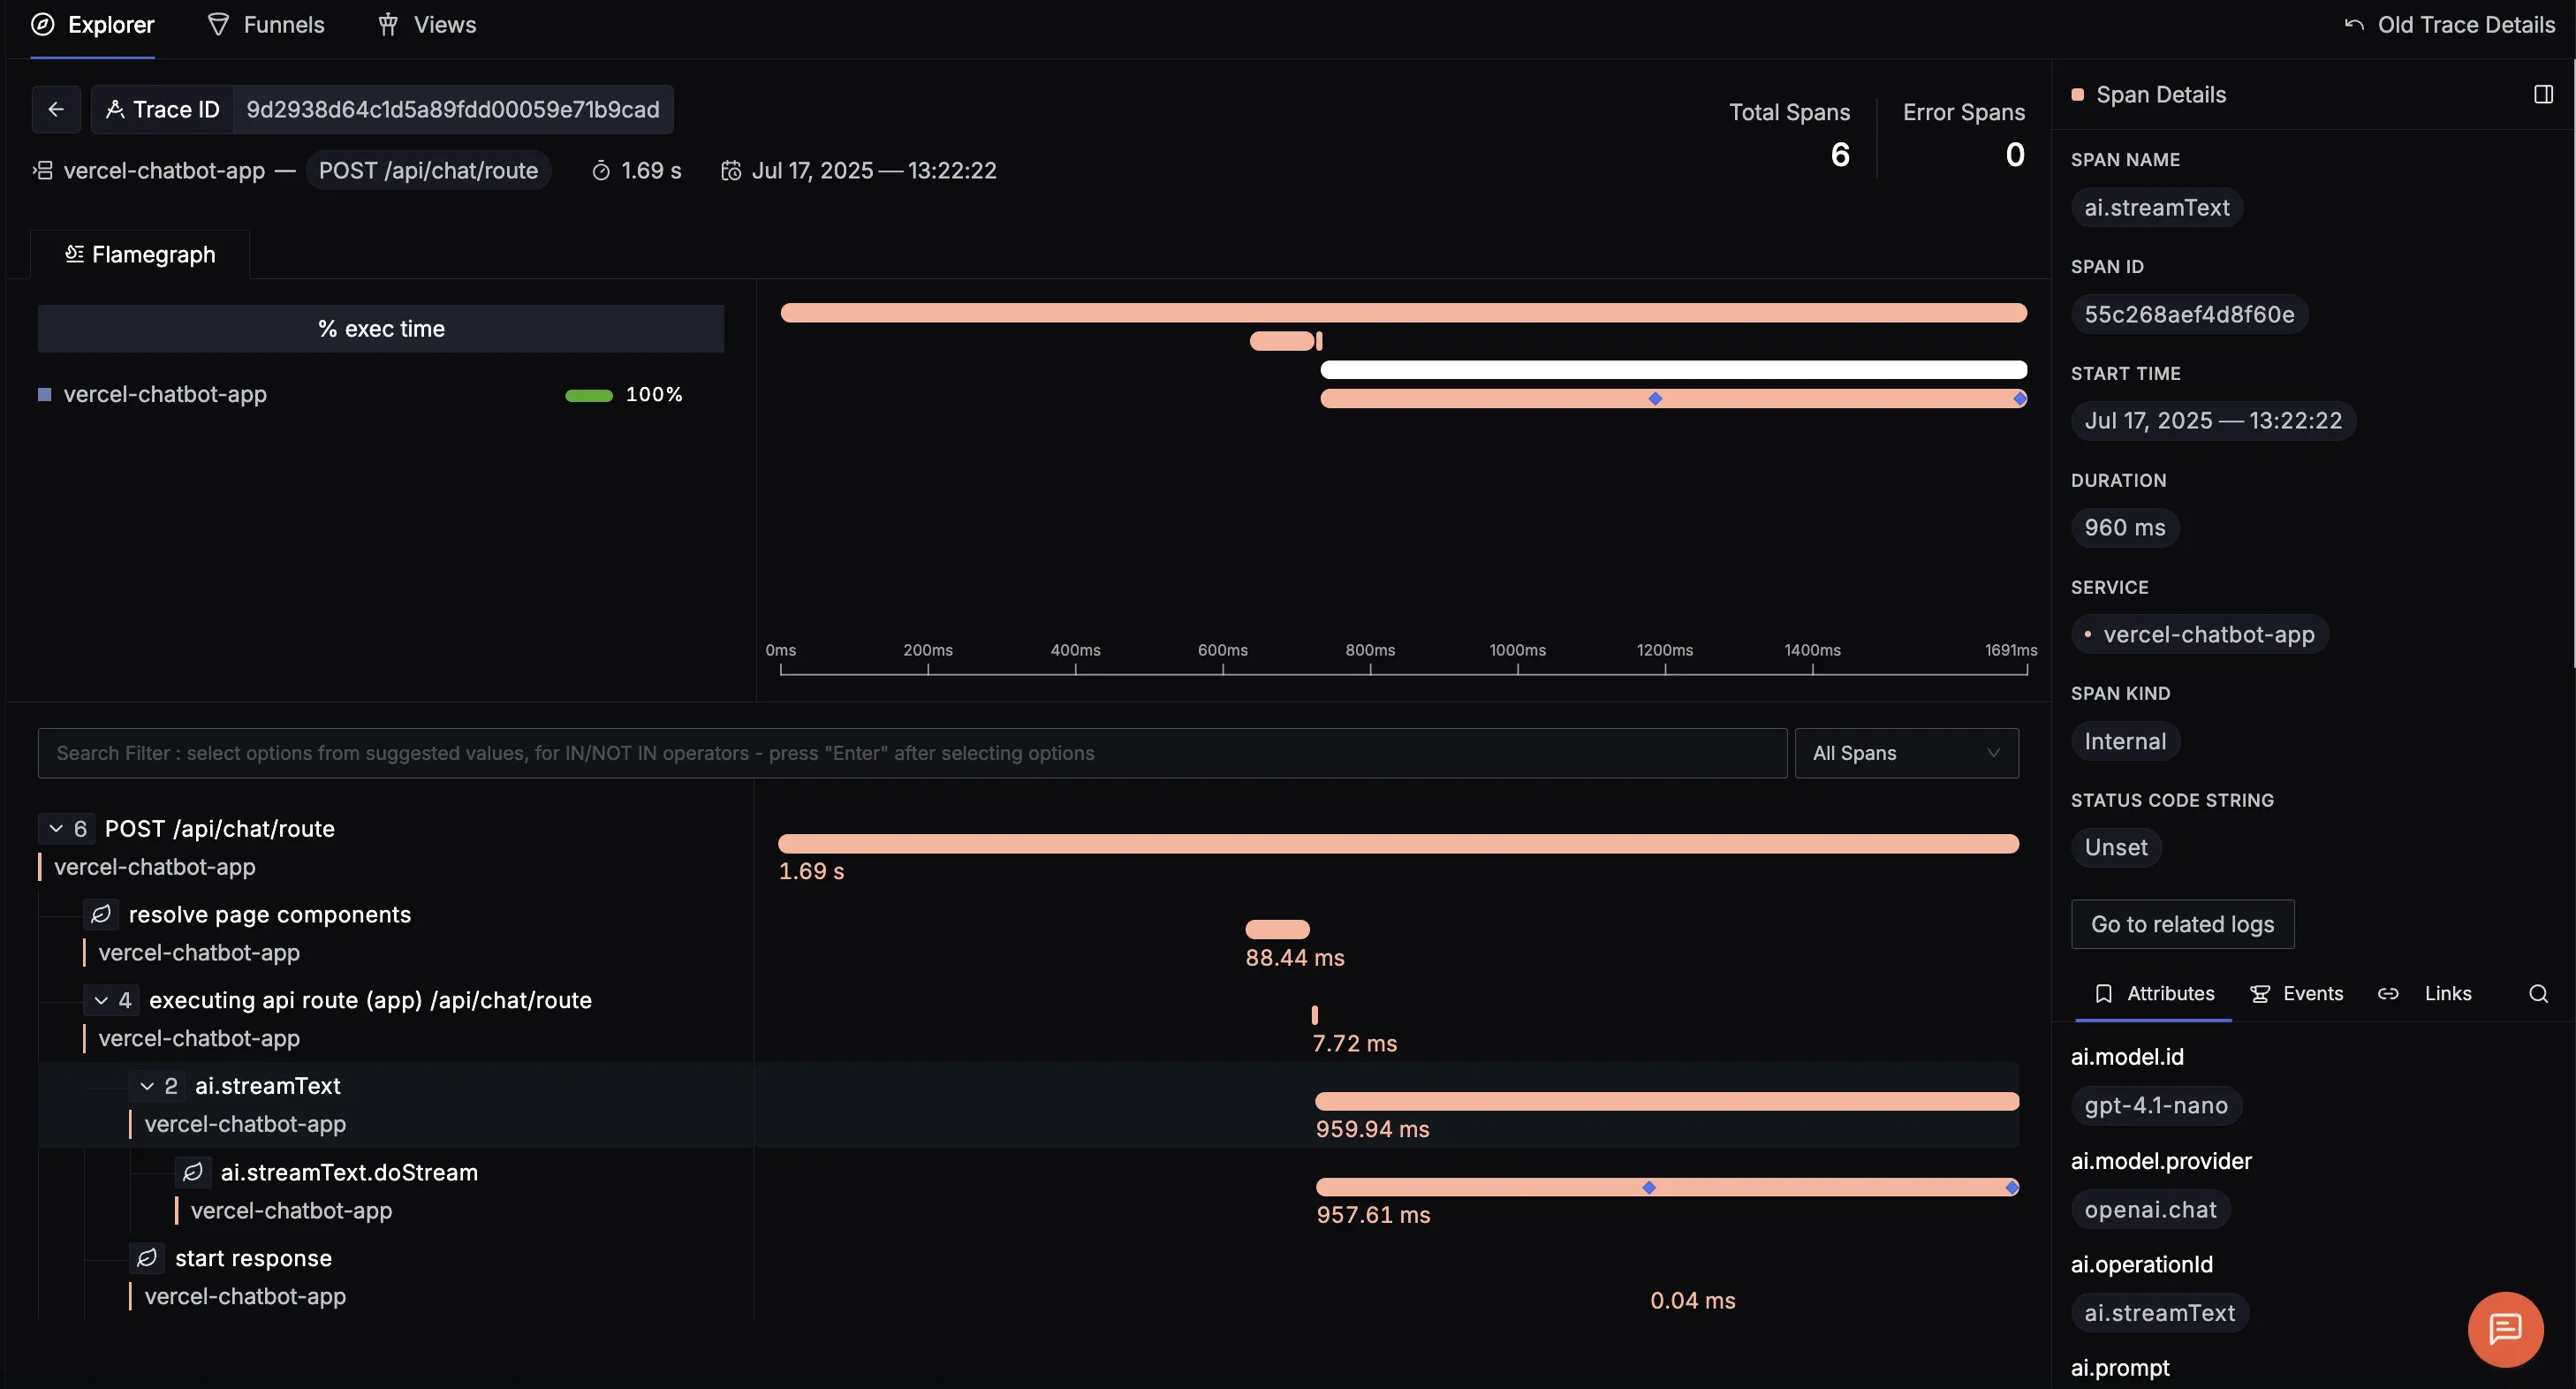
Finally, you should be able to view this data in SigNoz under the traces tab:
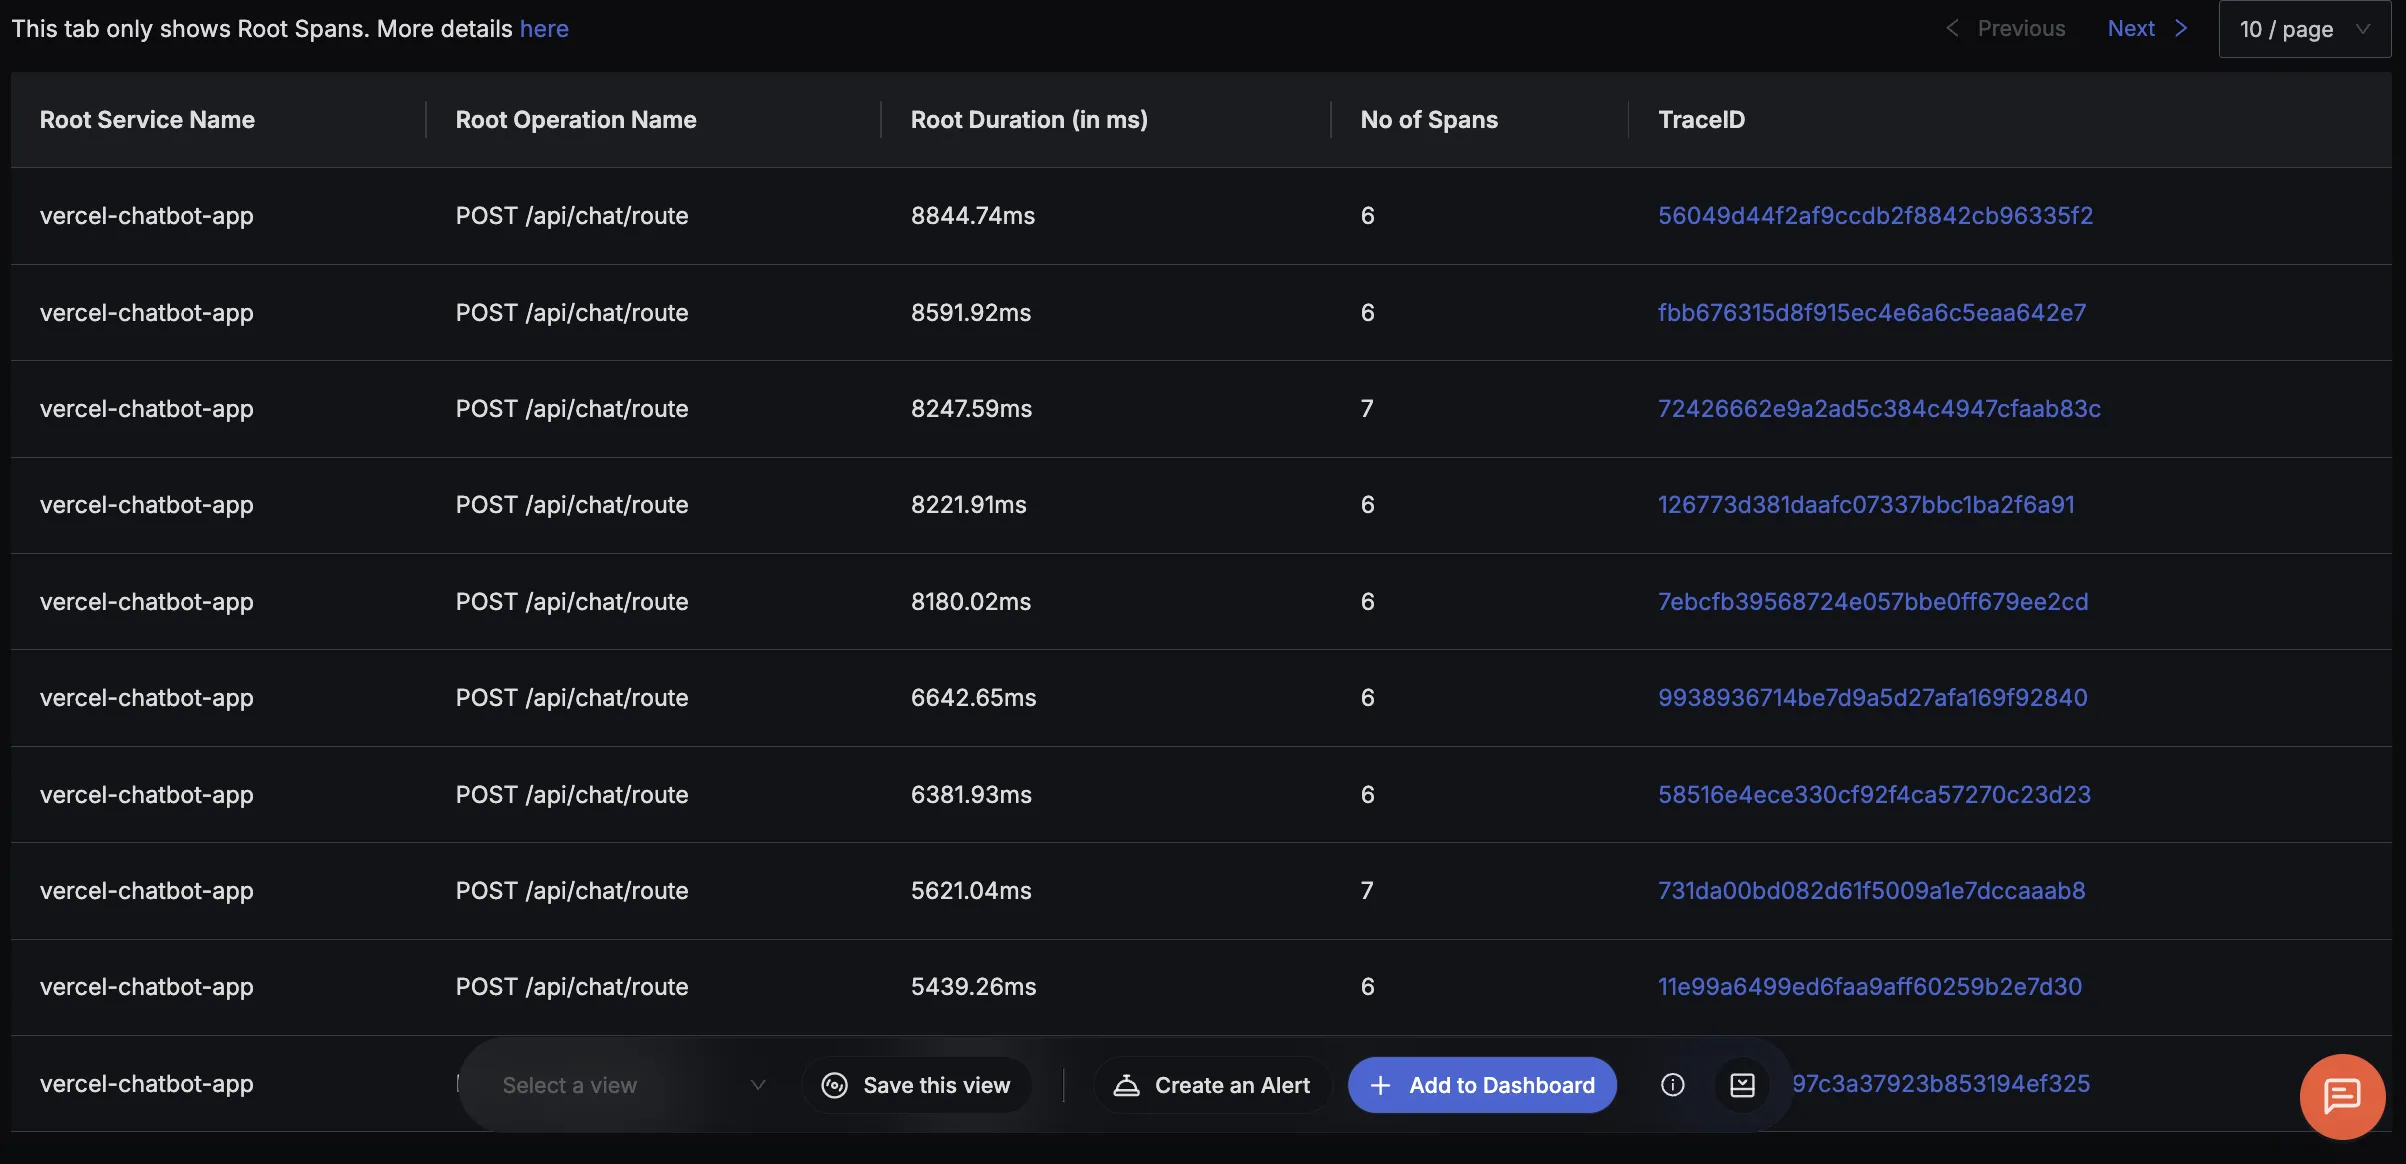
If you click on any span, you can see the detailed trace of which it is a part of.
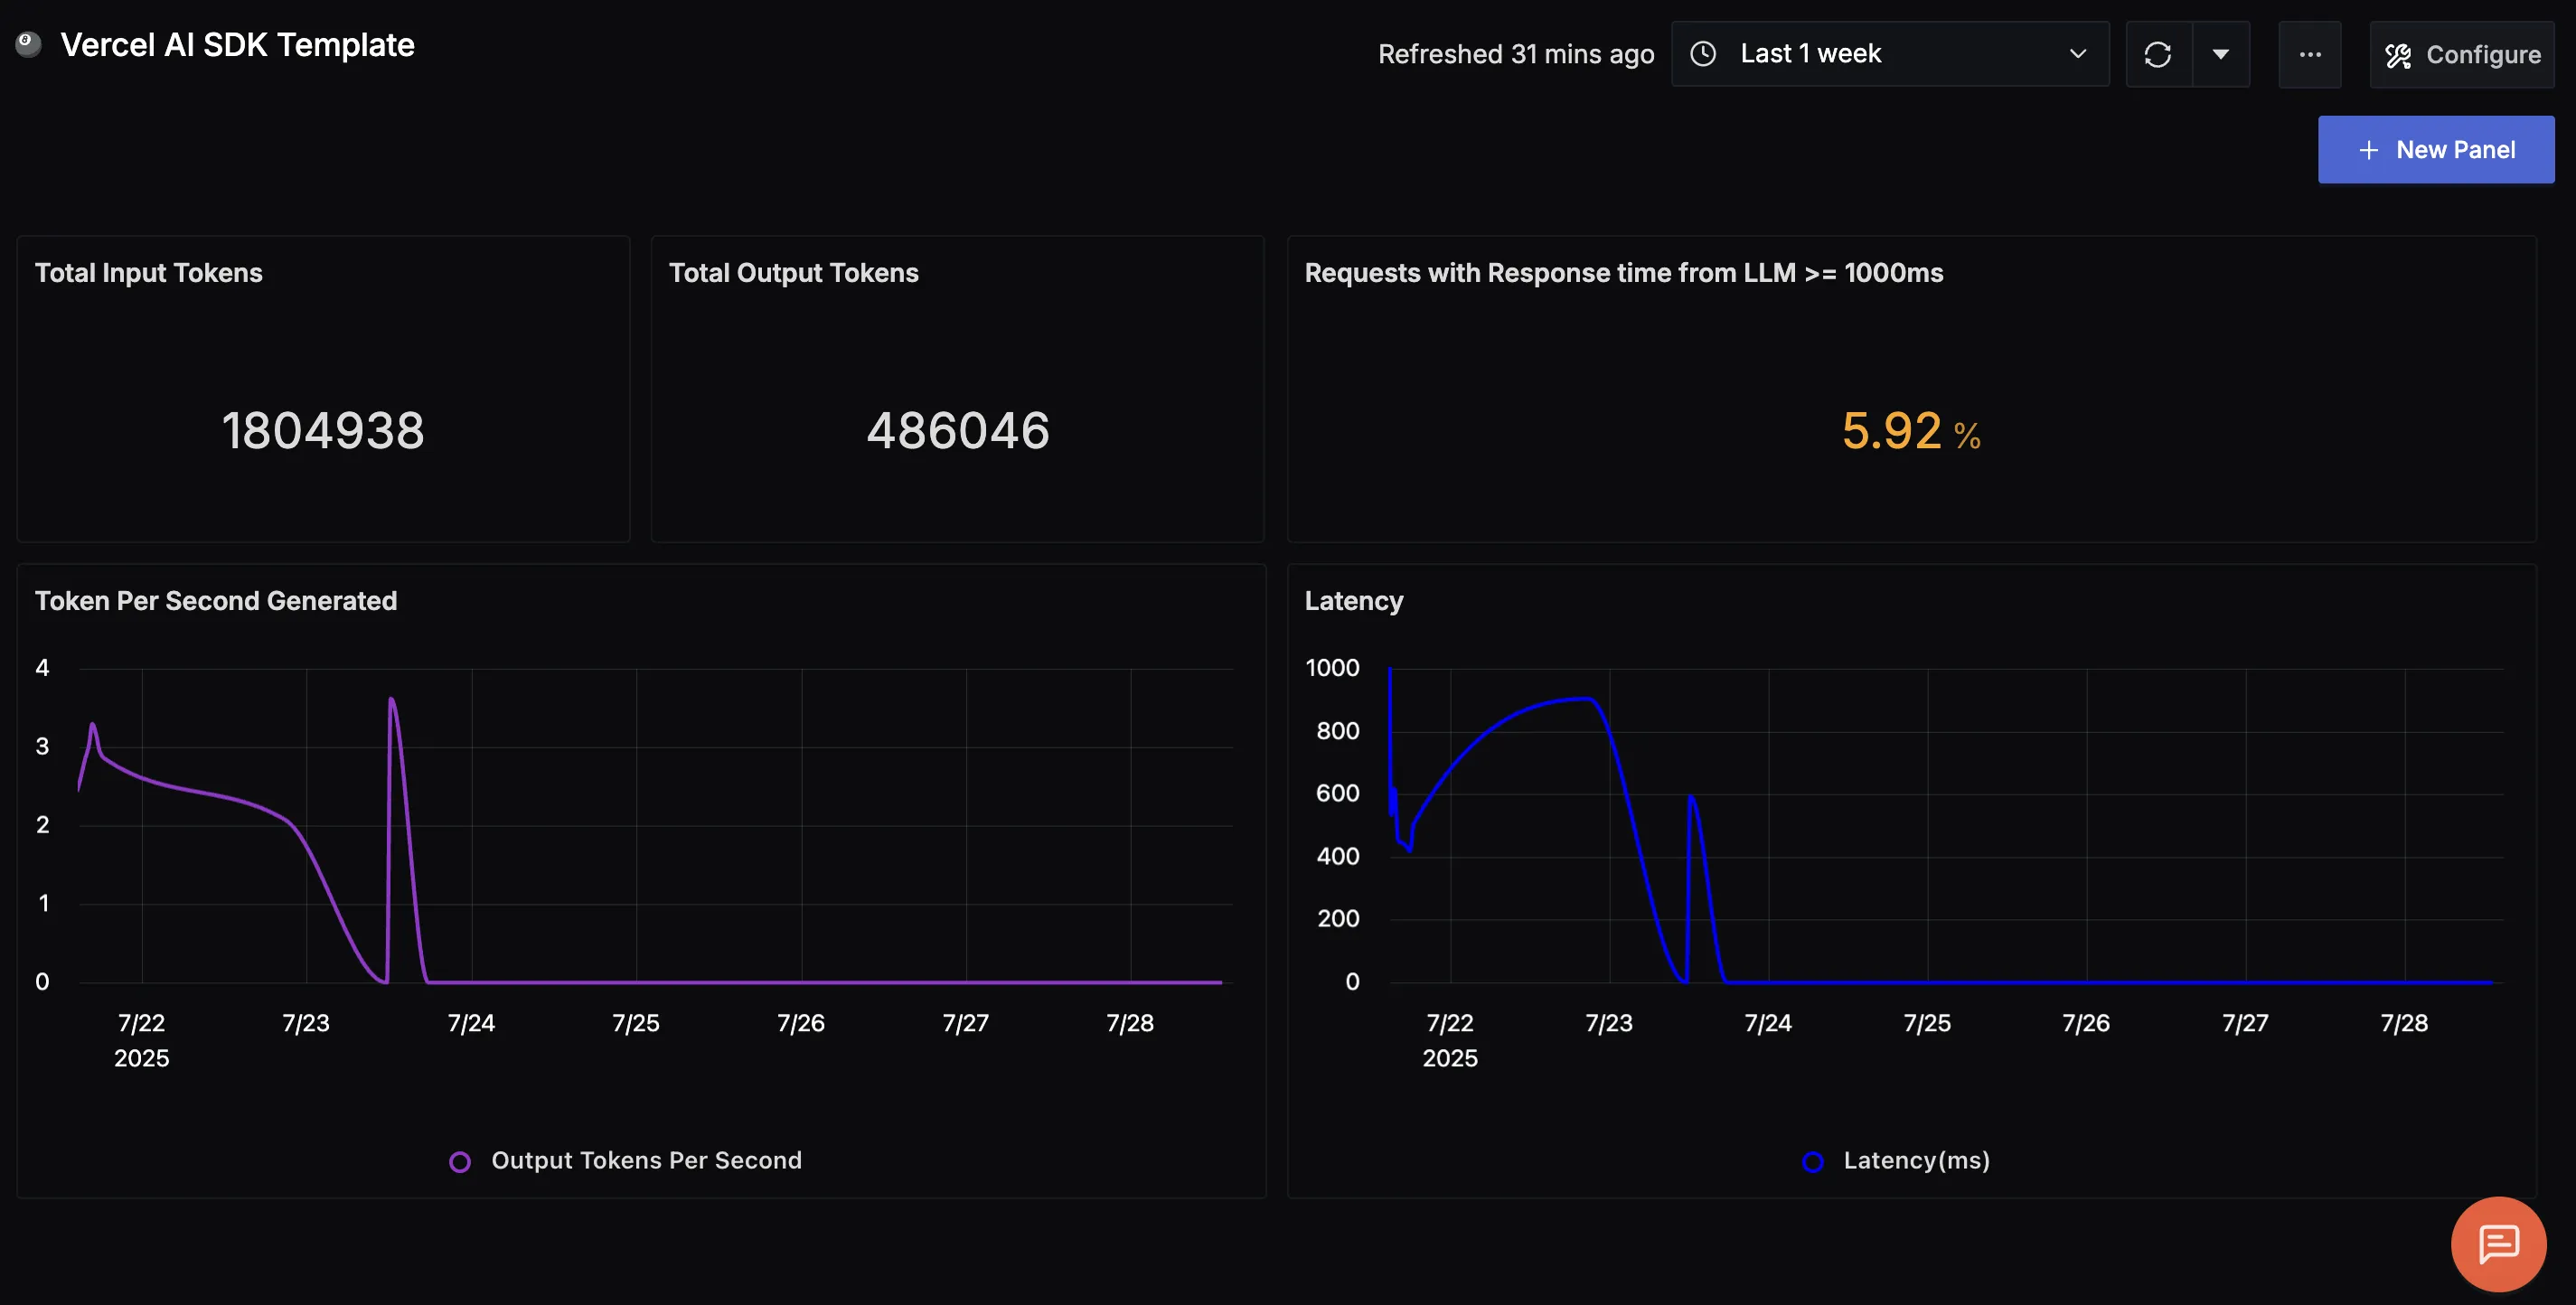
Dashboard
You can also check out our custom Vercel AI SDK dashboard here which provides specialized visualizations for monitoring your AI applications. The dashboard includes pre-built charts and metrics specifically tailored for Vercel AI SDK telemetry data, along with import instructions to get started quickly.